


1. Introduction
Nuclear energy is an important clean energy source for solving energy shortages and environmental problems. It has the advantages of low carbon, high energy density, and no geographical or climatic constraints. The first wall materials, accident-tolerant nuclear fuel (ATF) casing/coating materials, and key structural components of Generation IV nuclear energy systems need to work for a long time in extremely harsh environments such as strong irradiation fields, stress, high temperature, and strong corrosion of coolant. These are prone to irradiation swelling, creep, hardening, helium brittleness, fatigue, amorphization, and other damages that impair the materials' performance and cause them to fail, which has a serious effect on the safety of the components and even the whole nuclear reactor [1-5]. The Chernobyl nuclear leakage incident in 1986 and the Fukushima Daiichi nuclear power plant accident in 2011 have made people realize the constraints of materials on the development of nuclear energy, and it is necessary to research and develop new materials for nuclear reactors that are resistant to high-energy particle bombardment and have high mechanical properties as soon as possible. Currently, the main candidates for nuclear structural materials are alloys (nickel alloys [6,7], zirconium alloys [8,9], aluminum alloys [10,11], magnesium alloys [12,13], molybdenum alloys [14,15], austenitic stainless steel [16,17], low-alloyed steels [18,19], low-activation ferrite/martensitic steels [20,21], and oxide dispersion strengthened steels [22,23], etc.) and ceramics (SiC [24,25], TiC [26,27], ZrC [28,29], TiN [30,31], ZrN [32,33], Al2O3 [34,35], ZrO2 [36,37], etc.). However, the alloy materials suffer from low serviceable temperatures, limited resistance to oxidation and corrosion, pronounced helium embrittlement, and irradiation swelling. The practical application of ceramic materials is also restricted due to their low hardness, limited heat conductivity, inadequate irradiation resistance, and challenging preparation.
In 1967, Nowotny synthesized a type 312 carbide and a carbide material called the "Hagg phase" (type 211). In 1972, Nickl found that "H-phase" materials have higher toughness than other carbides, but have not yet attracted attention. In 1996, Barsoum successfully prepared a single-phase, dense bulk Ti3SiC2, and in a review published in 2000, renamed this type of material as Mn+1AXn phase, which led to a wave of research [38,39]. The space group of the ternary layered material MAX phase [40-43] is P63/mmc with the molecular formula Mn+1AXn, where M is an early transition element, A is a main group element (mostly group IIIA and IVA), X is C or N element, and n is taken to be 1,2,3 or even higher integers. An octahedral M-X layer, stacked along the c-axis with the A atom layer, is formed by the six M atoms and the X atom at the core of the structure. There is just van der Waals forces or weak chemical bonding between the M-X and A layers; M and X are covalently connected, while A atoms are metal bound to each other. Single or double A layers can be inserted between binary boride layers to create MAB-phase materials that resemble the MAX phase structurally. The hybrid bonded structure of the MAX/MAB phase allows it to have a variety of metal and ceramic properties, including high electrical conductivity, high thermal conductivity, high resistance to oxidation, corrosion resistance, ease of processing, low density, high toughness, high strength, etc., which can fulfill the mechanical property requirements of nuclear materials.
The effect of irradiation on the microstructure and properties of MAX/MAB-phase materials is crucial for applying the materials in nuclear energy systems. In 2008, Nappé et al. [44] irradiated Ti3SiC2 with 80% purity for the first time at room temperature (RT) with heavy ions. They found that high-energy heavy ions interacting with the nucleus and extra-nuclear electrons lead to only partial amorphization and caxis expansion. Subsequently, for more than a decade (as shown in Fig. 1), the MAX/MAB phases have received extensive attention in the field of nuclear energy, and have been continuously demonstrated to have significant damage tolerance and excellent resistance to amorphization, becoming a candidate material for Generation IV nuclear energy systems. To simulate the extremely harsh environment of nuclear reactors, the MAX/MAB phase was bombarded with energetic particles such as neutrons, heavy ions, ions of nuclear transmutation products, and electrons in the experiments. It was found that the main structural evolutions generated include M/A antisite defects, Frenkel defect pairs, lattice distortion, crystalline phase transformation, phase decomposition, amorphization, and high-temperature defect recovery. It was concluded that the material's mechanical properties and resistance to irradiation are determined by the choice of M,A, and X elements as well as the value of n. Meanwhile, due to the editable, diversified, and polymorphic nature of the MAX/MAB phase structure, the combination of theoretical calculation performance prediction and experimental characterization has become the main strategy of the research.
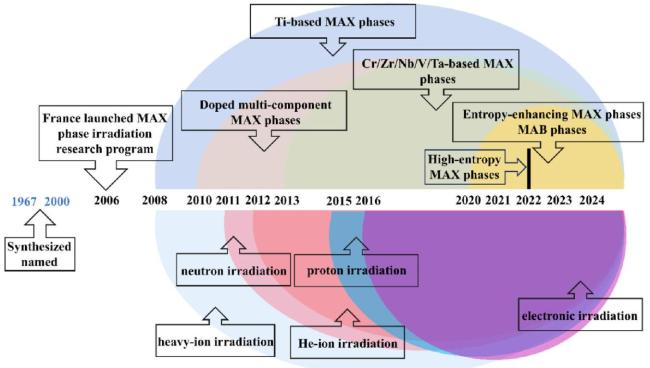
Fig. 1. Schematic of the duration of irradiation studies in MAX/MAB phase materials based on incomplete results. |
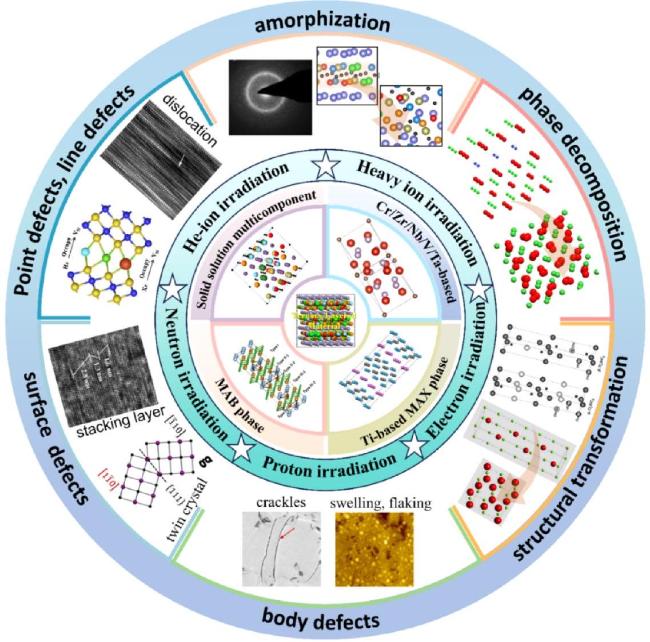
Studies on the synthesis methods, bonding characteristics, composite toughening, and application areas of MAX/MAB phases have been much discussed [38-46]. As shown in Fig. 2, this paper does not dwell on the properties of the material itself but mainly summarizes the irradiation responses of the currently studied MAX/MAB phases of different structures under neutron, heavy ion, He ion, proton, and electron bombardment [47-58]. The accommodation, evolution, and annihilation behavior of irradiation defects in MAX/MAB phases are explored, and their anti-irradiation properties and unique mechanisms are analyzed. Special attention is given to the irradiation damage effects and properties of doped solid solutions, medium-low entropy, and high entropy MAX phases, which have been investigated recently. The prospect of enhancing the irradiation performance database and developing more effective ternary stacked materials is also covered, and the notion of developing nuclear MAX/MAB phases through control over the entropy value and solid solution elements is put up.
2. Irradiation resistance and mechanisms of MAX/MAB phases
2.1. Irradiation resistance and mechanisms of Ti-based MAX phases
2.1.1. Temperature effect
The MAX phase has the largest proportion of atoms in the M-site, and materials with the same M atom have similar properties. Ti-based MAX phase refers to the MAX phase materials in which the element Ti occupies the M-site, and due to the adjustability of the value of n and the A and X-sites, there are many members of the "family" of Ti-based MAX phases including ${\mathrm{T}\mathrm{i}}_{3}{\mathrm{S}\mathrm{i}\mathrm{C}}_{2},{\mathrm{T}\mathrm{i}}_{3}{\mathrm{A}\mathrm{l}\mathrm{C}}_{2},{\mathrm{T}\mathrm{i}}_{2}\mathrm{A}\mathrm{l}\mathrm{C},{\mathrm{T}\mathrm{i}}_{4}{\mathrm{A}\mathrm{l}\mathrm{C}}_{3},{\mathrm{T}\mathrm{i}}_{3}{\mathrm{A}\mathrm{l}\mathrm{N}}_{2}$, Ti3GeC2, etc., which are the most abundantly prepared, and most intensively researched class of MAX phase materials. In particular, Yin et al. [59] concluded that under the same irradiation conditions, Tibased MAX is more capable of maintaining the crystal structure than Cr/V/Ta/Nb-based MAX phases. The initial studies of Ti-based MAX focused on RT-irradiated Ti3SiC2 [60]. It was generally believed that Ti3SiC2 materials were insensitive to electronic excitation, and the impact on the nuclei would generate and accumulate a large number of point defects, which eventually manifested as partial amorphization, partial phase decomposition, and expansion of the hexagonal structure along the c-axis. Subsequently, researchers gradually realized that there is a temperature effect on the irradiation damage of the MAX phase.
Zhang et al. [61] showed the decomposition phase TiC after irradiating Ti3SiC2 with 2MeVI2+ at RT, and the MAX phase crystal quality was improved due to the recovery of some defects after annealing at 500-800∘C. However, this is not enough to activate the Si atomic layer to form the MAX-phase lattice structure with TiC again, but the recrystallization of the nano-amorphous phase TiC occurs. This suggests that high-temperature annealing can promote defect annihilation, but the MAX-phase lattice recovery needs to exceed a certain critical value [62]. Generation IV nuclear materials need to be in service at 600∘C or even higher, and similar to annealing, high-temperature irradiation can restore defects. For example, Shen et al. [63] found that although the irradiation damage of Ti3SiC2 reached 116.9 dpa at 500∘C, the material was not completely amorphous, and there was no obvious microstructural change despite the presence of nano-TiC heterophases; Huang et al. [48] used 7MeVXe 26+ ions to irradiate Ti3SiC2 and Ti3AlC2, and found that the material could maintain crystal stability better at the irradiation temperature of 600∘C; Zhao et al. [64] also believed that increasing the irradiation temperature could enhance the irradiation damage resistance of MAX-phase materials.
Both high-temperature irradiation and high-temperature annealing processes can lower the atomic migration barriers, prompting defect complex annihilation and recovery of damage, but there are differences in their ability to recover the lattice in different experiments. Fig. 3(a-c) characterizes the damage and recovery phenomena produced by different doses of ion irradiation of Ti2AlC at RT-700 ∘C [65]. They found that the Raman vibrational peaks and GIXRD characteristic peaks of the MAX phase disappeared, weakened, or distorted due to lattice damage after irradiation at RT,360∘C, and 700∘C, and only the sample after annealing at 700∘C recovered the lattice structure, suggesting that annealing reconstructed the lattice stronger than the high-temperature irradiation in this process. However, Fig. 3(d) shows that the crystalline quality of Ti3SiC2 after irradiation at 700∘C is higher than that of annealing at 700∘C, contrary to Ti2AlC. Similarly, Ti3SiC2 was irradiated with 700 keV C ions at 270∘C as the critical temperature for lattice reconstruction, above which the generation of heterogeneous phases was avoided [50]. This value was significantly lower than the lattice reconstruction temperature threshold for annealing of Ti3SiC2 after RT irradiation, indicating that high-temperature irradiation was more favorable for Ti3SiC2 damage recovery. Although both high-temperature irradiation and high-temperature annealing can maintain the lattice and avoid the generation of heterogeneous phases, the former focuses on the dynamic recovery of point defects, while the latter focuses on the lattice reconstruction after phase decomposition. The sensitivity of different materials to these two mechanisms is the reason for the differences.
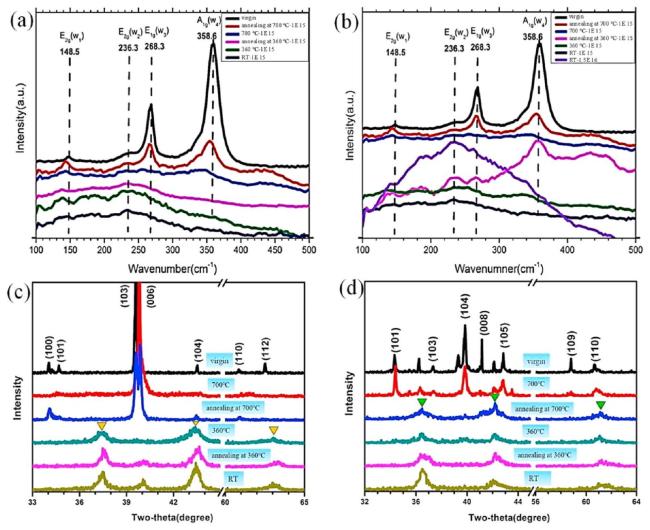
Fig. 3. Structural evolution of Ti2AlC after irradiation and annealing: (a-b) Raman spectra of Ti2AlC irradiated and annealed at different temperatures, with irradiation fluxes of 1×10¹⁵ ions ⋅cm-2,1.5×1016 ions ⋅cm-2 in that order; (c-d) Ti2AlC and Ti3SiC2 irradiated at different temperatures and annealed by GIXRD. Reproduced with permission from Ref. [65]. Copyright 2017 Elsevier. |
2.1.2. Influencing factors
Different A-site elements of the Ti-based MAX phase affect the bonding properties, atomic migration, and defect diffusion in the structure due to differences in valence electron properties and metallicity, which in turn produce differences in properties. Yang et al. [66] irradiated Ti3AlC2 with 50 keV He ions at different fluences and found that a large number of antisite defects (TiAl and AlTi) accompanied by phase transitions and rearrangement of C atoms at 2.61 dpa, and stacked laminar dislocations at 4.18 dpa. They concluded that compared to Ti3SiC2,Ti3AlC2 had a lower formation energy of antisite defects, which could accommodate more point defects and therefore had a stronger resistance to irradiation. Huang et al. [48] also experimentally found that the irradiation hardening degree of Ti3AlC2 was lower than that of Ti3SiC2 under the same irradiation dose. Although Ward et al. [51] proved the existence of lower antisite defect formation energy of Ti3AlC2 by using the results of the density flooding theory (DFT) calculations, they did not agree that this represents a high resistance to irradiation performance, because Ti3AlC2 left more defects that could not be annihilated after irradiation annealing than Ti3SiC2. Similarly, Clark et al. [67] found that the lattice expansion of Ti3AlC2 and Ti2AlC after irradiation was significantly higher than that of Ti3SiC2 because of the accommodation of more point defects; Ang et al. [68] suggested that excessive defects resulted in more microcracks in the internal structure of Tin+1AlCn. These studies indicate that the influence of A-site elements on the formation of Frenkel defects and antisite defects is one of the main reasons for the performance variations of MAX phases. Additionally, there is controversy among researchers regarding the contribution of antisite defects to the irradiation damage resistance of MAX phases. The essence of this controversy lies in the double-edged nature of antisite defects and the inconsistent focus of researchers on the definition of irradiation resistance. The controversy over antisite defects will be discussed in detail in the next section.
These studies show that low antisite defect formation enables Tin+1AlCn to resist high doses of irradiation damage and remain phasestable under high-temperature irradiation, but if a large number of point defects accommodated are dominated by antisite defects, they are not easy to be annihilated during the annealing process, and it is more difficult to recover from the irradiation damage. Liu et al. [64] found that under the same irradiation dose, the irradiation-resistant performance of Ti3SiC2 was higher, and the annihilation of defects such as vacancies and interstitial atoms of Ti2AlC was faster. Therefore, the recovery ability of irradiation damage is related to the defect formation energy, and the degree of damage recovery is related to the type of defects.
The stability of Ti-based MAX phases is affected by the M-A bond type and bond length. Yin et al. [59], from the perspective of bond type, concluded that the reconstruction of the Ti-Si/Ga/Ge strong bond (biased towards short-range covalent bonding) required higher energy, whereas the Ti-Al bond tended to be long-range ionic bonding, and the damaged structure was more likely to re-establish coherence with the lattice, so it was not easy to be amorphous in the irradiation; Chen et al. [52] calculated the vacancy formation energy of Ti3AC2( A=Al,Si,Ge) using first principles and found Ti3AlC2 to be the most stable, in agreement with experimental results. This is similar to the study of Trachenko et al. [69,70] in 2004 for chemical bonding irradiation resistance, i.e., ionic bonding facilitates the recovery of irradiation-damaged materials to the initial crystalline state. Other studies have shown that the selection of the X-site element in the MAX phase can affect the properties of M-A. Wang et al. [53] experimentally combined with first-principle calculations determined that, in the Ti-Al-X system, X taken to be the N -element improves the covalent nature of the Ti-Al bond, resulting in slightly lower susceptibility to irradiation-induced phase transitions in Ti2AlN than in Ti2AlC, but Ti2AlC was more likely to recover the damaged MAX phase lattice due to the stronger ionic bonding nature.
Different values of n directly affect the A/MX layer ratio and A element content of the Ti-based MAX phase, which indirectly change the bond energy strength and Frenkel defect pair formation energy, anion vacancy rate, He interstitial ion migration energy, and other point defect properties. This, in turn, influences the lattice stability and phase transition trend, and makes the material exhibit different irradiation resistance and defect recovery. For Ti-based MAX phases, materials with larger values of n may be more stable after irradiation. Xiao et al. [71] calculated the defect formation energies of six MAX phases with different values of n using the first nature principle and found that the antisite defects formation energy decreased with the increase in the ratio of Al/TiC layers, which meant that MAX phases with smaller values of n could accommodate more point defects and had a stronger ability to recover from damaged lattices but weakened stability. Yang et al. [72] irradiated Ti2AlN and Ti4AlN3 with 70 keV He ions at RT and found that the irradiation induced the generation of Ti-Al antisite defects and X-atom rearrangements, which transformed the MAX phase structure from chemically ordered to chemically disordered (the hexagonal phase transformed to the γ phase). At high fluence, the γ-phase Ti2AlN was further transformed into fcc nanotwin structure due to detwinning and fcc nanograin growth in the damaged region, a phenomenon that was consistent with the previous studies on Ti2AlC and Ti3AlC2[66,73,74]. Wang et al. [74] also proposed that the increase in the number of dislocations and stacked laminae drove the transition of the γ phase to fcc.
However, under the same irradiation conditions, Ti4AlN3 still maintained the hexagonal phase or γ phase, as shown in the selected area diffraction pattern of electrons (SADP) in Fig. 4, and Ti4AlN3 retained the laminar structure without transforming into the fcc phase at the highest fluence of this experiment, 1×1018 cm-2, which exhibited higher resistance to irradiation. In this regard, Yang et al. and Wang et al. [53,72] made two points: on the one hand, compared with phases 211-type and 312-type, the Al content and the density of the twin boundary in the 413-type MAX phase Ti-Al-X material decreased, and the driving force for the structural transformation of Ti4AlN3 decreased. This was because Al could reduce the free energy of the twin boundaries and stabilize the twin structure, while the twin boundaries enhanced the stability of the material, and the grain boundary gap promoted defect accommodation and annihilation. On the other hand, there were four Ti-X octahedral layers between the Al layers of Ti4AlN3, while there were only two layers of Ti2AlC. The Ti-X bond was significantly stronger than the Ti-Al bond, which made the octahedral layers more stable than the Al layers. So, the higher the ratio of octahedral layers, the better the stability of the Ti-based MAX phase.
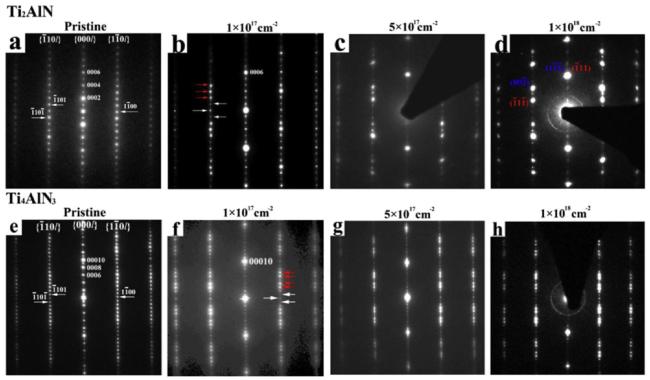
Fig. 4. Structural transformation of Ti2AlN and Ti4AlN3 with increasing irradiation fluence: (a-d) SADP plots of Ti2AlN irradiated with 70 keV He ions; (e-h) SADP plots of Ti4AlN3 irradiated with 70 keV He ions. Reproduced with permission from Ref. [72]. Copyright 2019 Elsevier. |
The regulatory effect of n values on properties can guide material screening and optimization for diverse application scenarios. Nuclear structural materials require a balance of long-term irradiation stability and high-temperature mechanical properties. Ti-based MAX phases with higher n values, characterized by a higher proportion of MX octahedral layers, exhibit stronger lattice distortion resistance and hightemperature phase stability, making them potentially suitable for nuclear structural applications such as fast neutron reactors. However, the increased n values strengthen interlayer covalent bonding, elevating interlayer slip resistance and inducing slight brittleness. Thus, in scenarios involving intense impacts (e.g., fusion reactor first walls), doping or grain boundary engineering is necessary to balance stability and toughness, mitigating the risk of brittle fracture from excessively high n values. Conversely, for coating materials demanding good toughness and thermal shock resistance, 211-type MAX phase materials with smaller n values are more appealing due to their relatively superior toughness, processability, and potential dynamic repair mechanisms.
2.1.3. Antisite defect
There is controversy regarding the role of antisite defects in the resistance to irradiation damage. One essence of this controversy lies in the "double-edged sword" nature of antisite defects. It is necessary to understand the advantages and disadvantages brought by high or low antisite defect formation energy. High-energy irradiated particles impinging on the lattice induce displacement cascades, generating a large number of Frenkel defects such as vacancies and interstitial atoms. The massive generation and aggregation of these defects may cause MAX phases to lose lattice order and long-range periodicity, resulting in amorphization. When the formation energy of antisite defects is low, the antisite defects formed by displaced atoms still occupy lattice sites, enabling the material to avoid amorphization even under high damage of 31 dpa [66]. The accumulation of antisite defects may lead to the transformation of the hexagonal phase structure to structures such as fcc [72-74]. This process maintains lattice order and also serves as an effective mechanism for MAX phases to resist amorphization under high-dose irradiation. Furthermore, the aggregation of Frenkel defects into regularly arranged configurations can form dislocation loops. Vacancies trap He, a product of neutron transmutation reactions, thereby promoting the formation of He bubbles. Dislocation loops and He bubbles are the primary causes of irradiation-induced hardening. The generation of antisite defects reduces interstitial atoms and vacancies, depriving dislocation loops of their constituent "raw materials" and He bubbles of nucleation sites, thereby suppressing irradiation-induced hardening [49].
Therefore, the advantages of low antisite defect formation energy (L-AE) mainly include two aspects: firstly, accommodating point defects to inhibit amorphization; secondly, suppressing the formation of dislocation loops and He bubbles to mitigate irradiation-induced hardening. However, disadvantageously, Frenkel defects can be annihilated by high-temperature annealing, while antisite defects are insensitive to this process. It should be noted that the more significant lattice expansion, stacking faults, and microcracks observed in some MAX phases with L-AE cannot be directly attributed to the accumulation of antisite defects, as these materials also tend to form Frenkel defects [67,68]. MAX phases with high antisite defect formation energy (H-AE) tend to have more stable lattice structures, being less prone to atomic displacement damage and significantly suppressing defect generation under irradiation with low-fluence particles. However, under the same high dpa damage, H-AE MAX phases generate more Frenkel defects and suffer greater lattice structural damage compared to L-AE counterparts, making them more susceptible to long-range periodic collapse and amorphization.
Irradiation damage exhibits multi-scale manifestations, including point defect formation and recovery, unit cell distortion, amorphization, formation of dislocation loops and He bubbles, hardening, and cracking. Another major cause of controversy lies in the inconsistent focus of researchers when evaluating irradiation damage resistance. For instance, studies focusing solely on defect recovery capability during high-temperature irradiation or annealing may yield contradictory conclusions. This is because MAX phases with L-AE more readily recover Frenkel defects under high-temperature irradiation compared to those with H-AE [64], yet L-AE MAX phases retain more irrecoverable antisite defects during high-temperature annealing [51]. Thus, a crucial approach to resolving the controversy is to unify the evaluation criteria for irradiation damage resistance and establish a multi-scale assessment system covering processes from short-term to long-term and from defect formation to recovery. Based on current research, it is evident that the formation of antisite defects constitutes an important mechanism for MAX phases to resist irradiation damage. However, comprehensive performance evaluation methods are required to assess the associated drawbacks for material screening.
2.1.4. Phase transition
The crystallographic transition in the irradiation of the Ti-based MAX phase is complex and varied, and the overall trend is from ordered to disordered, but the process is much debated. In 2010, Liu et al. [75] carried out a Rietveld refinement of the XRD patterns of Ti3Si0.90Al0.10C2 irradiated with high-energy heavy ions (74 MeV Kr and 92 MeV Xe ) (shown in Fig. 5) and found that the Wyckoff position of Al atoms moved from 2 b to 2 d, and the corresponding stacking sequence changed to CBCABCBA, i.e., the MAX phase underwent a structural transition from α-phase to β-phase. This process did not significantly damage the crystal structure and increased the capacity to accommodate defects. The γ-phase is a further disordered structure, which is understood to include hexagonal metastable structures, chemically disordered structures, and solid solution phases, and is mostly regarded as an intermediate phase that can be transformed into the fcc structure. It is also believed that the energy of the γ phase is lower than that of the β phase, so the metastable β phase, if formed, will be transformed into the γ phase with the increase of irradiation flux. When both the migration barrier of the atoms along the A layer and the formation energy of the antipodal defects are low, these two processes may co-occur, producing a direct transition from α to γ [45]. The formation of the metastable γ phase allows the MAX phase to accommodate higher concentrations of irradiation-induced defects and remain crystalline.
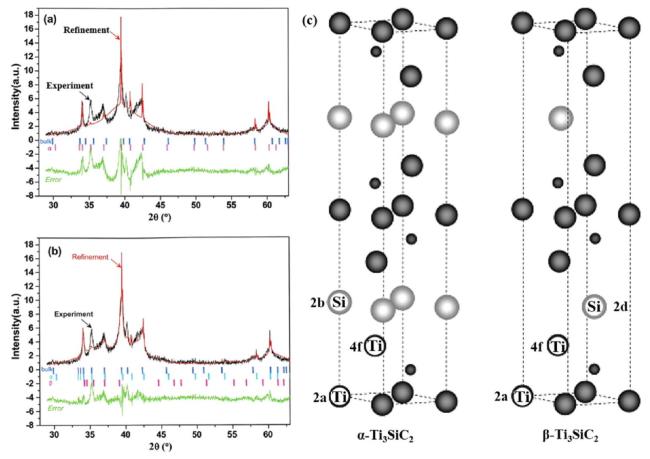
Fig. 5. α to β phase transition: (a-b) Rietveld refinement of XRD of Xe ion irradiated samples, a for α-Ti3SiC2, b with both α and β-Ti3SiC2; (c) Schematic structure of α and β-Ti3SiC2. Reproduced with permission from Ref. [75]. Copyright 2010 Elsevier. |
Under RT irradiation, most of the MAX phases are transformed into fcc structures or amorphous phases after irradiation reaches a certain threshold, and there are three views of the transformation process. One is phase decomposition. There is a tendency for the MAX phase to decompose in extreme environments, such as high temperatures and corrosive conditions. Since the M-A bond is the longest and the weakest, and the migration energy barriers of A-atom Frenkel defect pairs and M/A antisite defects along the A-atom plane in the MAX phase are shallow, it is hypothesized that the phase decomposes to form a binary fcc structure [76]. However, since the phenomena of MAX phase decomposition and diffusion of A-site elements observed under irradiation are much less than the phase transition, the relationship between them is doubtful. The second one is the formation of fcc-structured Mn+1(AXn) solid solution phases. In 2013, Bugnet et al. [77] proposed a new model using ab initio calculations, i.e., irradiation led to the occupation of anionic sites by A-site atoms, and a phase transition to form an fcc structure (e.g., Ti(Al0.33C0.67) phase) under a certain dose. They also found solid solution structures similar to TiC in their experiments. Although theoretically feasible, this idea lacks direct observational evidence and has been questioned as a misclassification of the γ-phase after it was observed. The third is the formation of the fcc structure (Mn+1A)Xn solid solution phase. The idea is that the solid solution γ-(Mn+1 A)Xn(γ-phase) is formed when the M and A atoms uniformly occupy the cation sites (3:1 occupancy) and the anions occupy the centers of the rearranged cation octahedra. The irradiation-induced stacking order of the γ-phase further transforms into the fcc- (Mn+1 A)Xn structure. It is often present in nanotwin structures and remains stable even at damage levels up to 300 dpa, showing excellent resistance to irra-diation-induced amorphization [53,72,77-81]. This idea is now highly recognized.
From the above analysis, the essence of phase transformation in MAX phases is that the hexagonal structure collapses due to massive accumulation of defects, followed by atomic rearrangement into other crystal structures or disordering. Several factors may drive phase transformation during irradiation by promoting the disorder of atoms in the A layer. For instance, Zhang et al. [82] and Su et al. [83] observed that the interface between SiC and Ti3SiC2 facilitates the accumulation of antisite defects in the Si layer, and large-sized He bubbles can force the displacement of Si atoms. Both the defective interfaces and large He bubbles in these two phenomena accelerate the irradiation-induced damage to the Si layer, driving the transformation of the hexagonal structure of MAX phases into the fcc phase.
2.2. Irradiation resistance and mechanisms of Cr/Zr/Nb/V/Ta-based MAX phases
The Ti-based MAX phase, as a typical structure, exhibits commonalities with many MAX phase materials. The influence of factors and processes, such as high-temperature defect recovery, bonding properties, A/X/n selection, and phase evolution, applies to most MAX phase materials. The irradiation properties of MAX phases with elements such as Cr/Zr/Nb/V/Ta occupying the M-site have been studied for only a decade. The difference in their properties from Ti-based MAX phases mainly originates from the difference between M-A and M-X bonds, which further affects the defect formation energy, phase transition tendency, and resistance to amorphization. For example, there was a high degree of hybridization between M(3 d) and C(2p) orbitals in the density of states (DOS) of M2AlC(M=Ti,V,Cr) compounds, suggesting a strong covalent interaction of M-C bonds. However, the hybridization of M-Al and M-C bonds in Ti2AlC was closer to the Fermi energy level (Ef) than in V2AlC and Cr2AlC, i.e., covalent bonding was stronger in V2AlC and Cr2AlC, which were less susceptible to lattice distortions to accommodate irradiation-induced defects, and relatively difficult to resist amorphization [71]. This theoretical study and experimental results are consistent [74,80], so it can be assumed that the nature of the bonding pattern formed by different M-site elements is the key to the properties, which directly determines the defect formation ability. However, it should be emphasized that the low defect formation energy does not mean that the irradiation resistance must be good, and the nature of a certain defect in the MAX phase of different M-site matrices cannot determine the irradiation resistance of the material. Christopoulos et al. [84] calculated the various point defect formation energies of the four MAX phases of M3AlC2(M=V,Zr,Ta,Ti), as shown in Table 1, including the M,Al,C Frenkel defects and M/Al antisite defects formation energies. It is found that although Ti3AlC2 had excellent resistance to irradiation damage, it didn't have an absolute advantage in various defect formation energies among the four materials, and the formation energies of M, Al, C Frenkel defects and M/A antisite defects were ranked in the 2nd, 2nd, 3rd, and 2nd places, respectively (from low to high), which suggested that the performance was a result of the combination of multiple defects.
Table 1 Calculated point defect formation energies for MAX phase in eV. [84]. Copyright 2017 Elsevier. Reproduced with permission from Ref. |
| Reaction | V3AlC2 | Zr3AlC2 | Ta3AlC2 | Ti3AlC2 |
|---|---|---|---|---|
| MM→VM+Mi | 7.40 | 6.12 | 7.43 | 7.32 |
| AlAl→VAI+Ali | 6.31 | 1.46 | 5.84 | 3.40 |
| CC→VC+Ci | 2.73 | 3.47 | 2.87 | 3.17 |
| MM+AlAl→MAl+AlM | 2.71 | 3.46 | 3.85 | 3.27 |
| MM+CC→MC+CM | 9.80 | 10.60 | 17.36 | 10.52 |
| AlA1+CC→AlC+CAl | 9.36 | 8.43 | 10.67 | 9.26 |
| Ali+VM→AlM | -5.38 | -2.39 | -4.44 | -4.20 |
| Ci+VM→CM | -1.15 | 0.14 | 1.35 | -0.48 |
| Mi+VAl→MAl | -5.62 | -1.72 | -4.97 | -3.25 |
| Ci+VAl→CAl | 0.21 | 0.46 | 0.58 | 0.31 |
| Mi+VC→MC | -0.63 | 0.86 | 5.72 | 0.51 |
| Ali+VC→AlC | 0.12 | 3.04 | 1.39 | 2.39 |
| Mi+AlAl→MAl+Ali | 0.68 | -0.27 | 0.87 | 0.15 |
| Mi+CC→MC+Ci | 2.10 | 4.33 | 8.58 | 3.68 |
| Al1+MM→AlM+Mi | 2.03 | 3.73 | 2.99 | 3.12 |
| Ali+CC→AlC+Ci | 2.85 | 6.51 | 4.25 | 5.55 |
| Ci+MM→CM+Mi | 7.70 | 6.26 | 8.78 | 6.84 |
| 18) Ci+AlAl→CAl+Ali | 6.51 | 1.92 | 6.42 | 3.71 |
The Cr-based MAX phase has high elastic stiffness, electrical and thermal conductivity, excellent resistance to oxidation and corrosion, and strong autonomous crack healing ability. Since Bugnet [85], Huang [86], Wang [45], and other teams studied the ion irradiation damage behavior of this material, it has become an important candidate material for nuclear energy systems so far, especially as a coating material that can effectively resist the penetration of nuclear transmutation reaction products [87, -89]. Cr2AlC has been extensively studied and has the highest Al vacancy formation energy, lower Cr vacancy formation energy, and lowest C vacancy formation energy. Since antisite defects do not significantly destroy the crystal structure but promote crystalline transformation, the damage of C atomic defects may be one of the main reasons for the structural damage of the material [90,92]. As shown in the Raman and Rutherford backscattering spectra (RBS) of Fig. 6, the irradiation up to a fluence of 1×1017 cm-2 produced C deposition on the near-surface of the Cr2AlC thin films due to the displacement and diffusion of C atoms [93]. Cr-based MAX phase vacancy generation usually reduces the material stiffness and brittleness and increases the hardness, so it often exhibits significant irradiation hardening. However, it has been found that vacancies could also cause Cr2AlC irradiation softening in low-dose damage at 0.002-0.098 dpa [94]. The anionic antisite defect formation energy of Cr2AlC is significantly lower compared to the previous Ti-based MAX phases, which implies excellent damage tolerance [92]. The Al atom in Cr2AlC has the lowest migration energy and possesses thermodynamic activity, so it can form an oxide layer to protect the MAX phase substrate or to form a crack bridging in high-temperature, corrosive environments [90].
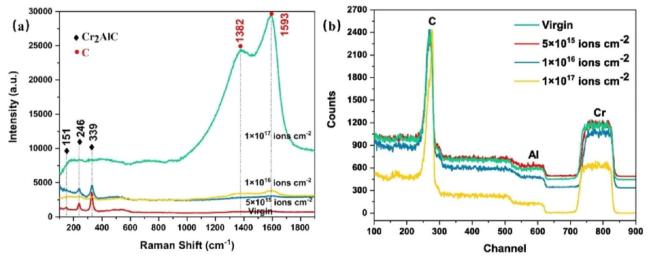
Fig. 6. Deposition of C on the near-surface of Cr2AlC during irradiation: (a) Raman spectra of Cr2AlC irradiated with 100 keV He ions at different fluences; (b) RBS spectra of Cr2AlC irradiated with He ions at different fluences. Reproduced with permission from Ref. [93]. Copyright 2019 Elsevier. |
Low-dose irradiation damage could cause the c-axis expansion and a-axis shrinkage of Cr2AlC, and the damage reached the saturation of irradiation effect after more than 1 dpa, at which time there was no obvious transformation of the crystals, and the crystal structure could still be maintained up to 5.2 dpa. This was because the antisite defect Cr/Al led to a mixture of Cr and Al in the atomic layer until the amount of the mixture reached a maximum at a certain dose. Thereafter, although the ion irradiation could continue to produce antisite defects, the mixture of Al and Cr in each atomic layer reached a dynamic equilibrium. Meanwhile, irradiation-induced rearrangement of C atoms made the layer spacing uniform after irradiation up to a certain dose [80]. Since the Cr-based MAX phase's M/A antisite defect formation energy was higher than that of Ti-based materials, this mechanism was less capable of accommodating defects than Ti-based. The above features are also manifested in Cr-based MAX phases such as Cr2AlN and Cr2GeC, which are mostly observed in [95-98]. It should be emphasized that Cr2AlC tends to transform into an amorphous form instead of forming an fcc structure in irradiation, which is related to the fact that CrC with an fcc structure is in a metastable state [45].
Zr-based MAX phases have been suggested since 2016 as structural materials and ATF coatings for nuclear energy systems or as protective materials against high-temperature vapors that may be present in light-water reactors (LWRs) during coolant damage (LOCA) accidents, due to the small thermal neutron absorption cross-section and good neutron transparency [99,100]. However, the irradiation resistance of Zr-based MAX phases is still to be discussed. Qarra et al. [101] caused 1.0-3.5 dpa irradiation damage to Zr2AlC with 22MeVAu 7+, which became amorphous at RT and retained its crystal structure at 300-600∘C. It was found that the point defects migrated and aggregated to form defect clusters at 300∘C, which reduced the overall defect density and improved the crystal quality. However, Fig. 7(a-g) shows that due to the inability of the Zr2AlC defect clusters to relax to low-energy clusters, strains in the lattice and even intergranular cracks and surface cracking occurred, which might indicate that Zr2AlC didn't have desirable irradiation resistance. Other Zr-based MAX phases have been studied with divergent views. Tian et al. [102] calculated the He irradiation properties of Zr -based MAX phases by first principles and found that Zr vacancies had higher formation energies compared to Al and C vacancies. Fig. 7(h-i) shows that He atoms were not easily migrated out of the Zr-C layer but existed in the C-Al layer. Combined with the strong He atom trapping ability of the Al vacancies, the Al layer tended to be disordered to accommodate the He interstitial atoms, while the Zr-C layer remained stable, which showed defect accommodation and irradiation resistance.
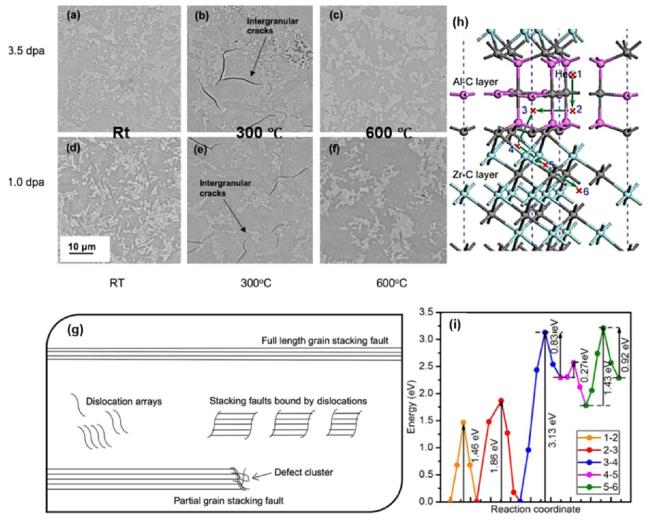
Fig. 7. (a-f) Backscattered SEM images of Zr2AlC under different ion irradiation conditions; (g) Schematic representation of the types of defects produced by irradiated Zr2AlC; (h-i) Migration paths and potential barriers of He atoms in Zr3Al3C5. Reproduced with permission from Ref. [101,102]. Copyright 2019, 2021 Elsevier, respectively. |
Although other M-elements of MAX phases, such as V and Ta, were mentioned previously [71,84], irradiation studies of Nb/V/ Ta-based MAX phases are minimal. This is partly due to the difficulty of material preparation and processing, and partly due to the short time of MAX phase irradiation studies, but they still have high research value. For example, the V-based MAX phase transforms from hexagonal phase to fcc structure under irradiation with a wide flux range of 1 MeV Au ions, a process similar to that of the Ti-based MAX phase, indicating excellent resistance to amorphization [80]. Nb-based MAX phases are dominated by phase 211-type, and nine of them (${\mathrm{N}\mathrm{b}}_{2}\mathrm{A}\mathrm{l}\mathrm{C},{\mathrm{N}\mathrm{b}}_{2}\mathrm{P}\mathrm{C},{\mathrm{N}\mathrm{b}}_{2}\mathrm{S}\mathrm{C},{\mathrm{N}\mathrm{b}}_{2}\mathrm{C}\mathrm{u}\mathrm{C}$, ${\mathrm{N}\mathrm{b}}_{2}\mathrm{G}\mathrm{a}\mathrm{C},{\mathrm{N}\mathrm{b}}_{2}\mathrm{G}\mathrm{e}\mathrm{C},{\mathrm{N}\mathrm{b}}_{2}\mathrm{A}\mathrm{s}\mathrm{C},{\mathrm{N}\mathrm{b}}_{2}\mathrm{I}\mathrm{n}\mathrm{C}$, and Nb2SnC ) are excellent superconducting and dielectric materials. In 2015, Chen et al. [103] simulated the newly predicted structure of Nb2GeC and found that interstitial atoms such as He increased the lattice parameter a, decreased c, shrink the cell, and the impurities tended to stay more on the octahedral sites. In 2020, Hadi et al. [104] used DFT to calculate the elastic properties and defect formation of the Nb-based 211-type MAX phase and concluded that Nb2SnC had the best resistance to irradiation because it had the largest Frenkel defect and antisite defect formation energies. However, this argument might be biased as lower defect formation energies could also improve irradiation resistance by accommodating more point defects (e.g., antisite defects) that did not affect crystallization.
Increasing the value of n enhances the stability of Ti-based MAX phases essentially by increasing the proportion of strongly bonded M-X layers and reducing the ratio of M-A bonds, which act as weak links in stability or drivers of phase transformation. However, this rule may not apply to MAX phases based on other elements. Firstly, this is due to the unfavorable properties of certain M atoms, such as the pronounced thermal diffusion ability of Cr atoms. Theoretically, materials with a high n value (e.g., Cr4AlC3 ) can also enhance structural rigidity, but their thermochemical stability decreases. Similarly, V atoms have a high neutron absorption cross-section, and increasing the proportion of such M atoms may weaken material performance. Secondly, the bonding strength between atoms like Zr and V and A -site atoms (e.g., Al) is relatively high, which enhances the stability of A layers and thus reduces or even reverses the effect of increasing n. Current research on non-Ti-based MAX phases mainly focuses on the 211-type with n=1, so there is insufficient data to clarify the role of n in these systems. Given the complexity of different MAX phase systems, it is necessary to conduct studies for each specific M-A-X system and independently evaluate the influence of n on their comprehensive properties.
It can be expected that with the development of MAX phases for nuclear applications, more and more new MAX phases will be added to irradiation studies.
2.3. Irradiation resistance and mechanisms of doped/entropy-enhanced MAX phases
Multicomponent solid solution MAX phases arise from the need to improve the mechanical properties of MAX phases, and researchers use solid solutions to regulate the lattice structure. The solid solution MAX phases can be categorized into M-site solid solution, A-site solid solution, and X-site solid solution according to the different site substitutions. A large number of new MAX phases such as Ti3(Si,Al)C2, (Ti,V)2AlC,Cr,Mn2AlC,(Cr,Mn2GaC, bulk Ti2AlCxNy, etc., have been prepared by this method [105-108], and their hardness, strength, stability, and oxidation resistance have been improved. The "mediumentropy" and even "high-entropy MAX phases (HE-MAX)" have been further prepared by solid solution of elements with equimolar ratios, such as M2AIC-MC(M=Ti, Zr,Hf,Nb,Ta,V2(Sn,A)C(A=Fe,Co,Ni, Mn), (Ti, Zr,Hf,V,Nb)-(Al, Sn)-C, etc [109-112], where significant performance advantages were found. Entropy in thermodynamics indicates the degree of chaos in a system. In 2004, Ye from Taiwan and Cantor's group at Oxford University introduced entropy into alloy systems and proposed the concept of "high entropy alloys (HEAs)". After more than a decade of research, the connotation of high entropy has been gradually introduced into the field of ceramics, such as high entropy oxides, such as high entropy pyrochlore, which can solidify the radioactive elements of nuclear waste [113,114]. The design concept of high entropy usually involves mixing five or more constituents in nearly equal molar ratios to form a solid solution or alloy (three to five constituents are considered medium entropy, and less than three are regarded as low entropy). In the past few years, it has received increasing attention from researchers of materials for nuclear applications due to its characteristic high entropy effect, lattice distortion effect, and delayed diffusion effect that inhibits the irradiation-induced defect formation, evolution, migration, and aggregation processes.
2.3.1. Doped multi-component MAX phase
The irradiation properties of doped, entropy-increasing MAX phases have been studied for a long time, with the French Atomic Energy Commission initiating a program of neutron irradiation experiments and charged particle irradiation of solid-solution MAX-phase materials in French reactors in 2006 [44]. However, for a long time, the irradiation studies were limited to A -site doped solid-solution Ti3(Si,Al)C2 materials, and were not extended to other solid-solution MAX-phase or even high-entropy MAX-phase materials until recent years. The difference between doped solid solution and entropy increasing lies mainly in the molar ratio of solid solution components, and doped MAX phases tend to be dominated by one component with a lower content of the other component. Influenced by this French research program, in 2010 Liu et al. [75] irradiated Ti3(Si0.90,Al0.10)C2 with 74 MeV Kr and 92 MeV Xe ions at RT,300∘C, and 500∘C, and found that the peak intensities of the MAX-phase XRDs decreased, the widths increased, and the diffraction angles shifted as the irradiation dose increased. This comes from three structural changes: the formation of the hexagonal phase nanostructure β-Ti3Si0.90Al0.10C2; a large increase in the lattice parameter c of α-Ti3Si0.90Al0.10C2; and the generation of microstrain in the lattice. The difference between β-Ti3Si0.90Al0.10C2 and α Ti3Si0.90Al0.10C2 lies in the Wyckoff position of the Si atoms, and this defect behavior is essentially the same as that of the single-component Ti-based MAX phase. In the same year, Marion et al. [115] observed the structural changes of Ti3(Si0.90,Al0.10)C2 with increasing irradiation dose in TEM and found that some of the diffraction spots disappeared due to the introduction of defects at 0.15 dpa, and diffuse patterns appeared at 3 dpa. The ABABACAC periodicity of the 312MAX phase disappeared at 6.67 dpa, but still, no amorphous rings appeared, indicating that it had not changed to an amorphous structure and showed excellent resistance to irradiation. Since the critical irradiation doses of it and the pure phase Ti3SiC2 phase transition have not been compared, the extent of the effect of the low amount of Al doping on the irradiation properties cannot be determined yet. By 2022, Chen et al. [116] utilized Zr atoms with excellent neutronic properties to replace the 2a and 4 f sites of M-site Ti. As shown in Fig. 8, it was found that the lattice distortion caused by Zr contributed to the enhancement of all kinds of bonding of Ti, while the multi-position solvation energy of He was reduced. In particular, Fig. 8(d) shows that Zr substitution at the 4 f site reduced the intensity of He interaction with atoms. These results indicate that Zr substitution improves the He irradiation stability of the MAX phase. Compared to Ti-based, the A-site doped Zr-based MAX phase studied so far has unsatisfactory properties. Zr3(Al0.9Si0.1)C2 was still stable at low dose irradiation, and it would phase decompose into ZrC when it reached 8 dpa, and there was no significant improvement even after annealing at 300∘C and 600∘C [117].
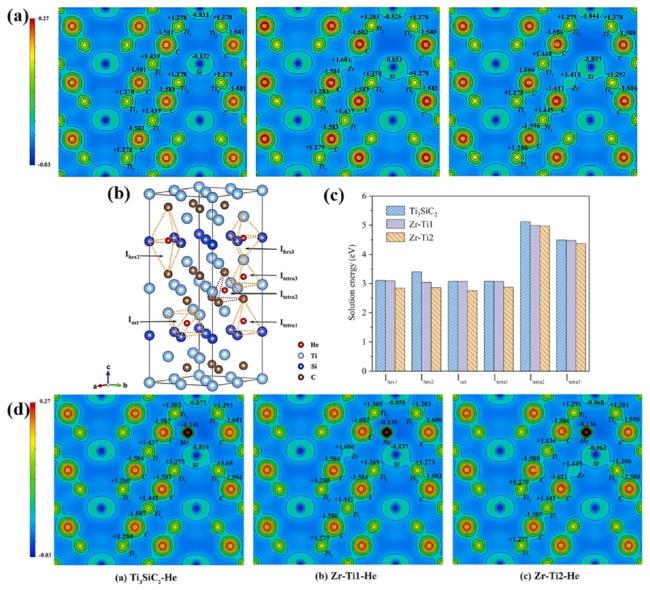
Fig. 8. Structural changes and He ion irradiation behavior of Zr -doped Ti3SiC2 : (a) charge density distribution, in order of Ti3SiC2, Zr-Ti1, and Zr-Ti2; (b) sites occupied by He in the MAX phase; (c) solvation energies of He in the interstitial sites; and (d) charge density distributions of doped He, in order of Ti3SiC2-He,Zr-Ti1- He, Zr-Ti2-He. Reproduced with permission from Ref. [116]. Copyright 2022 Elsevier. |
2.3.2. Entropy increasing multi-component MAX phase
Increasing entropy affects the chemical complexity of the material, and different irradiation properties exist even for two-component low-entropy MAX phases with similar doping structures, but due to the very limited research results, it has not been possible to determine whether there is a common law for the effect of increasing entropy. (Zr0.5, Ti0.5)2(Al0.5,Sn0.5)C MAX-phase flakes showed moving dislocation rings under He irradiation at 500∘C,8dpa, indicating that irradiation induced the generation of higher defect mobility, which was favorable for the annihilation and aggregation of defects. The transformation to the γ-M2AC phase started at 400-500 ∘C but recovered with increasing temperature, and the coexistence of chemically ordered lattice structure and a few nanostructures after irradiation showed good irradiation tolerance [118]. Similarly, (Zr0.5,Ti0.5)3AlC2 possessed a more stable lattice structure than the corresponding single M-component MAX phase in an RT irradiation environment under a nitrogen atmosphere [119].
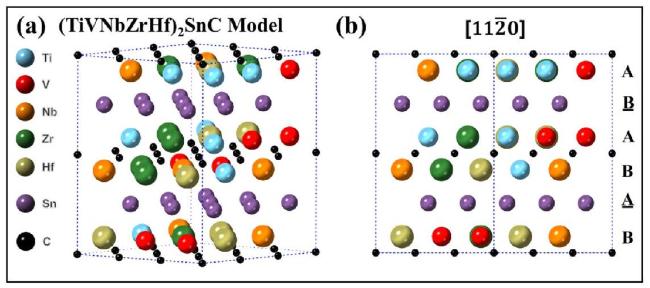
Fig. 9. (a-b) Schematic representation of (TiVNbZrHf) 2SnC supercell structure and atomic arrangement. Reproduced with permission from Ref. [120]. Copyright 2022 Elsevier. |
There are a large number of lattice distortions in the HE-MAX phase, and the high chemical complexity can produce mechanical properties that are not available in any of the single-component MAX phases, as well as make the nature of the various defects in the lattice structure change with a positive tendency. However, due to the late birth of the concept and the difficulty of preparation, the high-entropy MAX phase was not introduced into irradiation property studies until 2022. For the (TiVNbZrHf)2SnC structure shown in Fig. 9, it was found that the ir-radiation-induced resistance to amorphization increased with increasing chemical complexity from single to five components. Fig. 10 shows its in situ selected area electron diffraction (SAED), and the HEMAX phase amorphization corresponded to irradiation damage that was 0.74 dpa higher than that of Ti2SnC. This was mainly due to lattice distortions and hysteretic diffusion effects that reduced the antisite defect formation energy to accommodate more displacement cascade damage. The authors speculated that this might also be related to the fact that high entropy reduced energy dissipation and enhanced defect reorganization, thus slowing down damage accumulation. The complexity of the HE-MAX phase M/A antisite defects can also improve material stability. A recent study [121] showed that the hcc crystallographic transition of Nb2AlC under 540 keV He ion irradiation was due to the explosive growth of antisite defects, whereas (TiZrVNbTa)2AlC was unchanged due to the milder generation of antisite defects. However, it is not a certainty that increasing the entropy can improve the MAX phase irradiation properties because the electronegativity and size difference of the selected solid solution elements are also important influencing factors. The defect formation energy of meso-entropic (TiZrHf)2SnC was lower than that of single-component MAX phase, and after increasing the entropy to (TiVNbZrHf)2SnC, the defect formation energy was further reduced, and the irradiation resistance was improved, but both of them were higher than that of three-component (TiVNb)2SnC. This was because the addition of Zr and Hf atoms strengthened the interatomic charge transfer in the MAX phase and suppressed the defect formation. Meanwhile, Zr and Hf caused higher lattice distortion than V and Nb due to their larger size, which improved the C vacancy migration barrier and was also unfavorable for defect aggregation and annihilation [122].
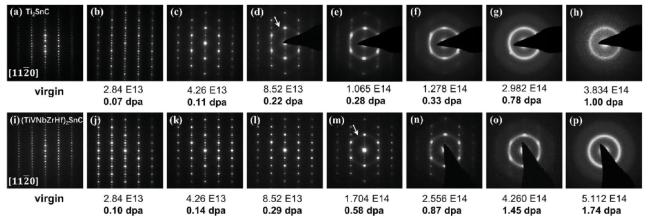
Fig. 10. In situ SAED maps of (a-h) Ti2SnC and (i-p) (TiVNbZrHf2SnC under 800keVKr2+ irradiation. Reproduced with permission from Ref. [120]. Copyright 2022 Elsevier. |
2.4. Irradiation resistance and mechanisms of MAB phase
The MAB phase is not clearly defined and is a generic name for a class of ternary layered transition metal borides. It is mainly of the 111type (CrAlB, MoAlB, WAlB) or 212-type (Fe2AlB2,Mn2AlB2, and Cr2AlB2). Although there are MAB phases with other structures, such as Cr3AlB4,Cr4AlB6, and Cr4AlB4, they exist only as individual compounds and do not represent a category of structures [123]. The MeAB(Me=Mn,Fe,Co) phase was first discovered in 1959 [124], but it was long underappreciated. In 2013, it was found to possess good room-temperature magneto-thermal effects [55]. In 2018, the MAB phase made a theoretical breakthrough in the field of 2D material development for new-generation nanodevices [125], which made it gradually become a research hotspot. Subsequently, Wang and Miao et al. [126,127] successively synthesized MAB phase materials with special structures (e.g., hexagonal structure), thermodynamic stability. It combines excellent mechanical properties, magneto-thermal properties, catalytic properties, high-temperature oxidation resistance, irradiation resistance, etc., and is an important candidate for protective and wear-resistant coatings, magnet cooling, electrocatalysis, electrochemical sensing, and irradiation shielding [128-131]. In recent years, the theoretical prediction, experimental synthesis, and property discovery of MAB phases have produced numerous results, which have become the "favorites" in the research of new structural and functional materials, but the research in the field of nuclear energy is still in its infancy.
Currently, research on the irradiation resistance of MAB phases focuses on MAlB materials, where M is mainly Mo, Fe, W, Cr, etc. Fig. 11 (a-f) shows the schematic diagram of borides transforming into MAlB phase structures by inserting Al layers. Kim et al. [132] proposed that the single B -chain, single B -ring, and double B -rings contained in Cr2AlB2,Cr3AlB4, and Cr4AlB6, respectively, play an important role in the defect recovery ability of materials. They suggested that the recombination of Cr and B interstitial atoms with adjacent vacancies of the same element through the Al layer is a key mechanism for defect recovery. In the single B-chain MAB phase Cr2AlB2, both the Cr migration barrier and B-B vacancy recombination barrier are higher than those of B-ring MAB phases, with a lower amorphization threshold (complete amorphization at 0.5 dpa ). Additionally, in the double B-ring MAB phase Cr4AlB6, displaced B atoms tend to occupy sites far from the Al layer, making it difficult to achieve defect recombination through migration via the Al layer. Therefore, the single B -ring MAB phase Cr3AlB4, where defects are most easily recombined, exhibits the strongest resistance to amorphization and Frenkel defect aggregation, followed by the double B-ring Cr4AlB6, and the single B-chain Cr2AlB2 is the weakest. From the perspective of bond strength, more B-rings correspond to lower B-Cr bond energy, resulting in lower defect formation energy and higher Frenkel defect concentration [133]. Moreover, the differences in defect properties of MAB phases can be analyzed from the perspective of the number of Al layers. Kim et al. [134] studied MoAlB, Fe2AlB2,CrAlB,Cr2AlB2, etc., and found that MAB phases with two Al layers (i.e., 111-type) cannot accommodate M interstitial atoms, as interstitial atoms immediately transform into antisite defects, hindering defect annihilation. In contrast, MAB phases with one Al layer (e.g., 212-type) can accommodate M interstitial atoms in the Al layer. The structures of MAB phases with different numbers of Al layers are shown in Fig. 11( g-j).
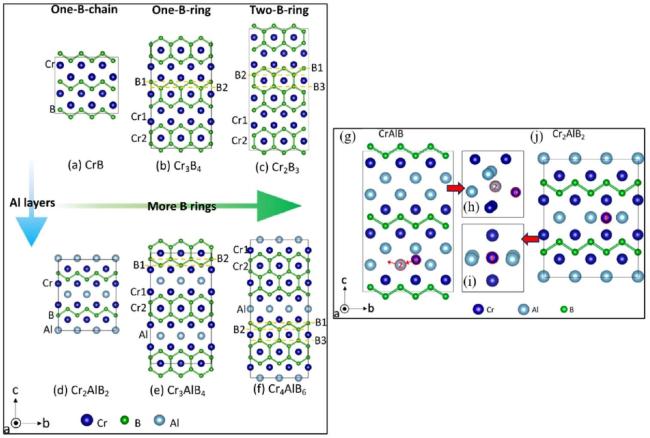
Fig. 11. Atomic structure of (a) CrB, (b) Cr3 B4, (c) Cr2 B3, (d) Cr2AlB2, (e) Cr3AlB4, and (f) Cr4AlB6; (g-j) Cr-based MAB phases with one and two Al layers, and the configurations of their Cr interstitials before and after relaxation. Reproduced with permission from Ref. [132,133]. Copyright 2022 Elsevier and 2022 American Chemical Society, respectively. |
As candidate neutron shielding materials for fusion reactors, MoAlB and WAlB have attracted attention. Zhang et al. [135] first proposed MoAlB as a shielding material for compact tokamaks, demonstrating its high neutron/ γ-ray linear attenuation coefficients and irradiation resistance. Their calculations revealed that WAlB, with its higher density, could provide better shielding performance than MoAlB. Subsequent experiments confirmed that WAlB exhibits superior resistance to ra-diation-induced amorphization and maintains a crack-free structure even under high-dose irradiation [131]. Wang et al. [123] studied the shielding properties of MoAlB and WAlB, showing that under γ-ray irradiation, the linear attenuation coefficient of WAlB is more than twice that of MoAlB. They further prepared (MoW)AlB via W solid solution in MoAlB, and calculations suggested that the solid solution enhances its shielding capability against neutrons and γ-rays. Si ion irradiation experiments indicated that compared to pure MoAlB, this solid solution exhibits higher tolerance to crack formation and other irradiation damage effects. Li et al. [136,137] sequentially investigated the surface deuterium (D) erosion and retention behaviors of MoAlB and WAlB after D ion irradiation. They found that both MAB phases have significantly lower D retention rates than pure W and no surface blistering, which is observed in pure W, demonstrating their excellent resistance to D erosion. These studies on neutron/ γ-ray shielding ability, irradiation damage resistance, and D erosion resistance confirm the application potential of MoAlB and WAlB in fusion reactors. However, the brittleness of these two materials may prevent them from withstanding transient thermal shocks. Qin et al. [138] proposed that using electric pulses to induce the formation of a crystalline-amorphous mixed Al structure wrapping MAB phase grains could enhance toughness.
The 211-type Fe2AlB2 is also often compared with the 111-type MoAlB. Fe2AlB2 exhibits stronger irradiation tolerance than MoAlB under high-energy C and Si ion irradiation, while the opposite is true under He ion irradiation. As shown in Fig. 12, Fe2AlB2 remained fully crystallized under 7.5×10¹⁶ ions cm-2(150∘C) and 1.5×10¹⁷ ions cm-2(300∘C)C-ion irradiation conditions, whereas only partial amorphization occurred under 1.5×10¹⁷ ions ⋅cm-2(150∘C) irradiation conditions. Under the same conditions, most of MoAlB had been transformed into an amorphous phase structure [139]. This is mainly due to the difficulty in the formation of Frenkel defect pairs of Mo and the low Mo vacancy mobility, which results in the weak ability of MoAlB to accommodate point defects and annihilation point defects, as well as the presence of a large number of Mo/Al antisite defects. When the number of antisite defects in MoAlB grew explosively, the structure was disordered, and it was difficult to recover the crystal structure after high-temperature annealing. For the same reason, MoAlB could recover most of the defects after Si ion irradiation, even after annealing at temperatures above 450∘C, but the antisite defects and Mo vacancies were difficult to recover [135]. Under He ion irradiation, the He bubbles of both could be further connected into strings through interlayer vacancies. And since the single/double vacancy formation energy of Fe2AlB2 was lower than that of MoAlB, the number density of He bubbles was significantly higher, and there existed more obvious irra-diation-induced embrittlement [140]. This finding is consistent with the conclusion presented by Kim et al. [133], who noted that the defect recovery rate of MAB phases with a single Al layer structure is higher than that of phases with a double Al layer structure. Therefore, in terms of defect recombination capability, the order is as follows: single B-ring MAB phase > double B-ring MAB phase > single B-chain MAB phase with a single Al layer > single B -chain MAB phase with double Al layers.
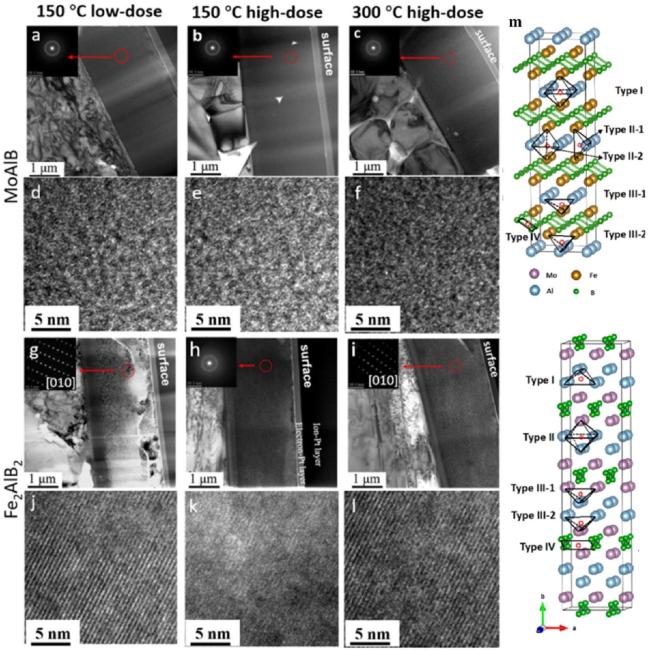
Fig. 12. (a-l) TEM and HRTEM images of MoAlB and Fe2AlB2 irradiated at 150∘C,7.5×1016 ions cm-2 (left column), 150 ∘C,1.5×1017 ions cm-2(middle column) and 150∘C,7.5×1017 ions cm-2 (right column); (m) Schematic structures of MoAlB and Fe2AlB2. Reproduced with permission from Ref. [139]. Copyright 2020 Elsevier. |
The main advantages and disadvantages of MAX phases and MAB phases in terms of resistance to irradiation damage are summarized in Table 2. The distinct properties of MAB phases from MAX phases primarily arise from the modified A-layer characteristics constrained by the B-layer. In MAX phases, the A-layer forms weak metallic bonds with M-X layers, and the bonding between A-site atoms is also weak. This renders the A-layer prone to both slipping and defect generation: while it enhances toughness, defect accommodation, and resistance to amorphization, it also facilitates the migration and aggregation of Frenkel defects, antisite defects, and He interstitials within the A-layer, leading to sequential damages such as He embrittlement, stacking faults, phase transitions, and cracking. In MAB phases, despite the metallic bonding between the A-layer and M-B layers, the strongly covalent B-B bonds form chains or rings that simultaneously constrain the A-layer. This configuration enhances rigidity, reduces swelling, and suppresses crack formation and large He bubble growth. Conversely, it increases brittleness and elevates the slip and defect migration barriers in the A-layer, thereby reducing resistance to amorphization. Thus, the key optimization directions for these materials may involve appropriately enhancing the stability of the vulnerable A-layer in MAX phases, while improving the toughness and B-network stability of MAB phases. Additionally, B's neutron absorption capability endows MAB phases with neutron shielding functionality absent in MAX phases. However, when MAB phases are used as nuclear materials without neutron shielding functionality, they should be kept away from neu-tron-sensitive regions.
Table 2 Comparison of main advantages and disadvantages of irradiation resistance between MAX phases and MAB phases studied so far. |
| Phase type | Subclass | Main Advantages | Main Disadvantages |
|---|---|---|---|
| MAX | Ti-based MAX phases | Easy defect recovery at high temperatures; strong resistance to amorphization and hardening; high n values enhance phase stability. | C-axis expansion; antisite defects hard to annihilate; He in A-layer causes embrittlement; phase transition. |
| Cr-based MAX phases | Strong corrosion/oxidation resistance; self-healing ability. | Prone to irradiation hardening; softening at low doses; amorphization at high doses. | |
| Zr/Nb/V/Ta-based MAX phases | Zr: good neutron transparency. V: phase transformation against amorphization. | Zr: easy amorphization at room temperature; cracking; high-temperature phase decomposition. Others: scarce research; difficult preparation. | |
| doped/entropy-enhanced MAX phases | High amorphization threshold; difficult defect aggregation; strong defect accommodation capacity; swelling resistance. | Possible phase decomposition at high doses; performance highly dependent on entropy and element selection. | |
| MAB | single B-chain with double Al layer (111-type MAB phases) single B-chain with single Al layer (212-type MAB phases) single B-ring (Cr3AlB4) | Strong neutron absorption of MoAlB and WAlB; Resistance to D erosion; Inhibition of He bubble growth. Stronger resistance to amorphization than 111-type; high defect recovery rate. Best defect recovery and anti-amorphization capabilities among MAB phases. | Difficult defect recovery; thermal shock cracking; poor stability. High He bubble density; prone to embrittlement. |
| double B-ring (Cr4AlB6 ) | Medium amorphization threshold; B-ring restrains interlayer peeling; high γ-ray attenuation rate. | Harder defect recombination than single B-rings; high Frenkel defect concentration. |
3. Neutron irradiation damage of MAX/MAB phase
Irradiation damage of nuclear materials comes from the action of incident energy-carrying particles (neutrons, charged ions, etc.) on lattice array atoms. The energy-carrying particles transfer energy to the target atoms to produce Frenkel defect pairs and primary knock-on atoms (PKA). PKA further collision cascade to produce a large number of secondary delocalized atoms and point defects. Defect migration, aggregation, and annihilation to form defect clusters, layer error, dislocation rings, micropores, bubbles, and other body defects, so that the material shows irradiation hardening, creep, softening, swelling, cracking, and other damage. The damage to the material in the nuclear reactors mainly comes from the ionization effect, nuclear transmutation reaction, and delocalization effect caused by neutron irradiation. Due to the high cost, long cycle, harsh equipment requirements, and safety issues of experimental research on neutron irradiation, it is common to use accelerated charged ions to simulate the damage caused by neutrons to materials. However, Ion irradiation, with shallow penetration, non-uniform damage distribution, and ultra-high damage rate, differs markedly from neutron irradiation, which has deeper penetration, uniform damage distribution, and lower damage rate. So they cannot completely replace neutron irradiation research [141-143].
In 2011, Hoffman et al. [144] used the ORIGEN-S of the SCALE code system for the first time to simulate the neutron activation of the MAX phase exposed to neutron irradiation from idealized fast and hot reactors. The specific activities of Ti3SiC2,Ti3AlC2, and Ti2AlC were studied for 10, 30, and 60 years of service in nuclear energy systems and compared with those of SiC and Alloy 617, fourth-generation nuclear candidates. The specific activity of the MAX phase was found to be similar to that of SiC and three orders of magnitude lower than that of alloy 617, which proved the potential of the MAX phase as a new generation of nuclear-use material and attracted more research teams to carry out the study of neutron irradiation damage in MAX phase. In 2014, Tallman's team [145] conducted the first neutron irradiation experiments on the bulk MAX phase and found that Ti3SiC2 had smaller lattice distortions, less phase decomposition and microcracks than Ti3AlC2. This was in line with the previous observation about the Tibased MAX phase that the lattice was more stable under low-dose irradiation damage (0.1 dpa ) due to stronger Ti-Si bonds than Ti-Al bonds. Almost no phase decomposition was observed in Ti2AlC, and this phase stability did not seem to be consistent with the law that the stability of the Ti-based MAX phase increased with increasing values of n. However, at low doses of irradiation damage and high temperatures of 657∘C,Ti2AlC with a smaller n value had a stronger defect recovery capability, which was sufficient to resist the phase decomposition tendency caused by irradiation. The team's study also observed for the first time the generation of MAX phase dislocation loops and concluded that the irradiation response of the MAX phase was lower than that of the impurity phases TiC and Al3O2. They suggested that Ti2AlC and Ti3AlC2 might be more promising, especially Ti3SiC2 could be applied in the environment of 3.4 dpa and 973 K [145-147].
The study on the neutron irradiation damage of Ti3SiC2, especially the change of mechanical properties, further proved the above viewpoints and also indicated that the suitable structural optimization of the single-phase MAX phase was beneficial to the performance improvement. As shown in Fig. 13, Ti3SiC2 was subjected to neutron irradiation of 2×1025n⋅m-2 at 400∘C,630∘C, and 700∘C. At 400∘C, the c-axis expanded by 15%, the flexural strength decreased from 445±29MPa to 315±33MPa, and the content of TiC increased by 15wt\%; raised to 700∘C, the lattice parameter was unchanged, the heterophase increased by 5wt\%, and the flexural strength was 391±71MPa [148]. This proved that Ti3SiC2 had a certain resistance to neutron irradiation and the ability to recover defects from high temperatures, but it was difficult to recover all the property damage at elevated temperatures. In the Ti3AlC2-Ti5Al2C3 material, the MAX phase stability was weakened due to the decrease in the Ti/Al layer ratio, such as the anisotropic swelling and the loss of 90% of the flexural strength observed under irradiation conditions at 400∘C and 2 dpa. However, defect recovery was also improved by the decrease in the Ti/Al layer ratio, and a large number of defects began to recover dynamically at 630-700∘C, retaining only a small number of antisite defects and thus exhibiting little irradiation damage [149].
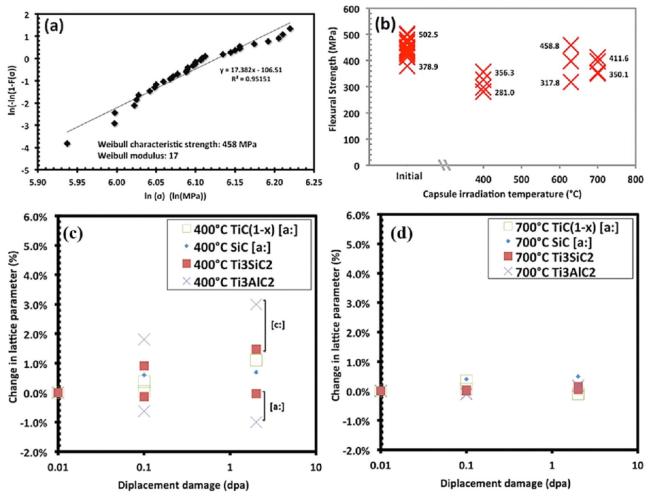
Fig. 13. (a) Weibull modulus and strength distribution of pre-irradiated Ti3SiC2 material; (b) average strength of pre-irradiated and irradiated specimens at selected temperatures; (c) variation of the lattice parameter of the samples at different temperatures and damage doses. Reproduced with permission from Ref. [148]. Copyright 2017 Elsevier. |
Some researchers have also questioned the resistance to neutron irradiation exhibited by the single-component MAX phase and its high-temperature irradiation stability. Tunes et al. [150,151] irradiated Ti3SiC2 and Ti2AlC at 1273 K with neutrons at irradiation damage of 2 dpa and 10 dpa (the highest neutron dose achieved in current MAXphase studies), respectively, and found black spots, dislocation loops, cavities, and phase decomposition. They questioned the high-temperature irradiation stability of the MAX phase due to this severe irradiation damage phenomenon. Although the temperatures and irradiation doses chosen by the team were high for the new materials under study, and there was no evidence of amorphization, it also shows that the single-phase MAX phase requires some phase screening or structural optimization to find MAX-phase materials that satisfy all aspects of the requirements. At present, neutron irradiation research only focuses on Ti-based MAX phase materials, and because the experimental requirements are too demanding, leading to more and more researchers simulate neutron irradiation with heavy ions, protons, He ions, electrons, etc. to study the resistance of materials to irradiation. However, ion irradiation is unsuitable for simulating damage behaviors in real service environments; only neutron irradiation can provide direct evidence of MAX phase damage behaviors in nuclear reactors.
4. Ion Irradiation damage of MAX/MAB phase
Ion irradiation is a valuable alternative to neutron irradiation. However, the differences between ion irradiation and neutron irradiation result in both validity and limitations in the outcomes of ion irradiation, necessitating a clear differentiation of their applicable scopes and scientific interpretation. On one hand, the dose rate of ion irradiation (typically 10-4-10-1dpa/s ) is much higher than that of neutron irradiation (approximately 10-8-10-6dpa/s in reactors). In neutron irradiation, the slower defect generation rate allows sufficient time for materials to achieve dynamic recovery through thermal activation (e.g., vacancy-interstitial recombination, dislocation climb) [145,148,149]. In contrast, the high dose rate of ion irradiation causes defect formation to outpace recovery, potentially leading to excessive defect accumulation and morphological changes. On the other hand, heavy ions exhibit significantly higher ionization energy loss than neutrons, which may induce additional damage. Despite these differences, ion and neutron irradiation share consistency in terms of core defects (antisite defects, Frenkel defect pairs) and macroscopic damage (hardening, swelling, phase decomposition) in MAX phases. Thus, the high-dose rapid implantation of ions can reflect the resistance of MAX phases to extreme scenarios such as massive defect accumulation after long-term service, facilitating studies on single irradiation damage mechanisms, exploration of irradiation resistance mechanisms, and rapid screening of candidate materials. Only the combination of ion and neutron irradiation experiments enables efficient and accurate prediction of the long-term service performance of materials.
4.1. Heavy ion radiation damage
4.1.1. Conventional heavy ion
Heavy ions refer to charged particles or ions with masses exceeding that of He atoms, including but not limited to elemental ions such as C, Xe,W,Fe, and Au. In the decades of irradiation research, collisional cascades and defects resulting from elastic collisions of heavy ions with atomic nuclei have been used to model neutron irradiation damage [152-154]. Accelerated heavy ions have high energy and mass, and the damage rate is 104 times higher than neutrons. Heavy ion irradiation to simulate neutron irradiation can produce high damage (200 dpa) in a short period, and it is easy to control the experimental parameters such as irradiation dose, irradiation temperature, and irradiation depth. The irradiation damage can even be observed in situ, and the irradiated material is not radioactive, significantly reducing the economic and time costs.
Although the types of defects and property damage produced by heavy ion irradiation and neutron irradiation-induced MAX phases are the same, there are differences in the effects of the two on the materials, mainly in the defect formation and recovery processes. The main point defects generated by MAX phase irradiation are antisite defects and Frenkel defect pairs, in which the formation of antisite defects is mainly due to nuclear energy loss caused by elastic collisions. Hanson et al. [155] found that the strong ionization energy loss of heavy-ion irradiation could exacerbate this effect and increase lattice strains after irradiation of MAX phases by using Ag,Pt, and Cl plasma. On the other hand, phase decomposition, nanostructure precipitation, and dislocation rings were produced in Ti2AlC and Ti3SiC2 by neutron irradiation, but little irradiation damage was observed at similar temperatures (above 1000 K ) and 700 keV Kr ion irradiation, which was attributed to the deposition of ionization energy induced by ions and recoil, resulting in localized heating of the lattice and annealing-like recovery of defects [151]. However, most of the irradiation damage caused by heavy ions and neutrons to the MAX phase has commonality, and the results of heavy ion research can be utilized as a reference for service in actual nuclear reactors. The characterization of the action of heavy ions on the MAX phase is discussed next.
Damage from elastic collisions of heavy ions with nuclei is more sensitive to temperature and often recovers dynamically or saturates at high temperatures. Ti3SiC2 is insensitive to electronic interactions with heavy ions below 28keVnm-1, but nuclear interactions greatly disrupt the structure of Ti3SiC2, which is responsible for anisotropic changes in the lattice parameters and cell enlargement but rarely leads to its amorphization. Irradiation at RT at damage doses above 0.1 dpa increases microstrain in Ti3SiC2 crystals, while elevated irradiation temperatures significantly reduce the damage caused by nuclear interactions [60]. This increase in defect density produced by elastic collisions leads to the hardening of the material and loss of its laminar structure, phase transition, and consequently, a possible increase in its brittleness, as observed in [49,67,101,156]. However, heavy ion-induced defects do not necessarily cause weakening of properties, for example, 100 keV Ne ion irradiation of Ti3InC2 resulted in a partially disordered structure due to delocalization, but still exhibited good mechanical properties such as Young's modulus, hardness, etc. [157].
The less amorphization of the MAX phase indicates that the damage to it by heavy ions does not increase without limit. In the study of Ti2AlC irradiated with 1 MeV Kr ions, the MAX phase continuously produced small dislocation rings, and the dislocation rings saturated and gradually began to grow up to 800∘C. This resulted in an increase in defect size and a significant decrease in defect density for the irradiated sample at 800∘C in Fig. 14, and the defect density curves at all three temperatures leveled off [158]. These phenomena indicate that Ti2AlC has not been destroyed without limit, but that there is an equilibrium. The energy provided by high temperatures drives this restoration and equilibrium, but may also cause crystal growth. For example, after heavy ion irradiation of Ti3SiC2 produced cracks, annealing to temperatures of 500-80∘C did not result in significant recovery but led to crystal regrowth of Ti3SiC2 and heterophase TiC [61]; nanocrystalline thin films of Cr2AlC did not observe amorphization at 973 K and 138 dpa, but instead showed recrystallization [57]. Heavy ion irradiation also suffers from a property common to ion irradiation, i.e., damage to the surface region of the MAX phase is higher than the Bragg peak region (the region of energy depletion of the incident ions) [159].
4.1.2. Self-Ion
Self-ion irradiation is a special member of heavy ion irradiation, which is an irradiation process that uses the material's ions as the incident particles. Self-ion irradiation has two advantages: firstly, it does not introduce impurity atoms and avoids other doping effects; secondly, in a fusion reactor, the energy-carrying particles collide with the lattice atoms of the structural material to produce PKA and transmutation nuclides, and the PKA produces a collision cascade in the lattice, which is mainly a collision between the structural material's atoms so that MAX-phase self-ion irradiation of malefactors is close to the real environment. The most common self-ions in MAX-phase self-ion irradiation studies are the C and Si ions, and there are no MAB-phase self-ion irradiation studies.
The damage caused by C-ion RT irradiation of Ti3SiC2 was difficult to recover, and annealing at 350∘C improved the crystal quality. The extent of the damage decreased by increasing to 850∘C, but the damage in the MAX phase expanded and was more uniformly distributed. This was due to the increase in defect mobility at 350∘C, which promoted defect annihilation, while defects at 850∘C migrated out of the collision cascade damage region before annihilation, which produced defect diffusion, but the extent of the damage was reduced because of the reduced defect density [50]. In particular, C ion irradiation might produce a carbon film on the surface, which arose from hydrocarbon deposition during the irradiation process and diffusion of C in the MAX phase driven by heat and irradiation. The MAX phase often undergoes structural transformation in C and Si ion irradiation, and this phase transformation process and defect recovery and saturation are considered to be a reflection of the MAX phase's resistance to irradiation damage and amorphization. Ion irradiation of Ti3AlC2 by 1MeVC 4+ at different temperatures (RT,300∘C,500∘C, and 800∘C ) resulted in the first complete observation of the transformation process of α→β→γ→ fcc structure of the MAX phase shown in Fig. 15(a) [79]. The crystal phase occupancies at different irradiation fluences and temperatures were counted, as shown in Fig. 15(b-d). The hexagonal phase was recovered at low fluences and high temperatures, and the fcc was recovered to the γ phase at high fluences and high temperatures, which demonstrated that the phase transition was a reversible process at high temperatures. The same phase transition existed in the experiment of Ti3SiC2 irradiated by 6 MeV Si ions at 300∘C, and the hexagonal phase structure was transformed into an fcc structure. There were spiral dislocations in the Bragg peak region and corrugated dislocations in the damaged region after annealing [160]. Both studies suggested that microstrain, dislocations, and laminar dislocations might promote the phase transition, and a similar point was made by [74].
4.2. He ion radiation damage
In reactors, the (n,α ) nuclear transmutation reaction of neutrons with structural materials and the β-decay of tritium bombard the materials with He. Since helium atoms have low solubility and do not diffuse easily in materials, they tend to accumulate in places with low form-nucleus barriers, such as vacancy clusters, dislocations, and grain boundaries, or as interstitial atoms that continually self-travel, crowding out the atoms of the normal fractional lattice to grow and form He bubbles. He bubbles grow continuously through the absorption of He atoms, migratory merging, and Ostwald ripening mechanisms, causing internal swelling, surface foaming, and helium embrittlement of the material [161-163]. Among the MAX phase irradiation studies, He ion irradiation has received the most attention because He ion-induced defects, lattice distortions, and phase transitions are some of the most important factors in the damage to the mechanical properties of materials. Wang et al. [58] found that as the He ion dose increased from 8×1016 cm-2 to 1×1018 cm-2,Ti3AlC2 first produced small isolated defects, which then aggregated to form defect clusters and dislocation loops. The location enlarged to form a distinct damage region, at which time the MAX phase elastic strain began to increase. Spherical He bubbles with a radius of 1 nm were produced at a dose of 2×1017cm-2, and the density of helium bubbles increased with increasing stoichiometry. The spherical He bubbles coalesced to form stringy He bubbles, and further aggregation of the He bubbles resulted in cracks to release the stress. These results demonstrate that He irradiation of the MAX phase ultimately leads to fracture, surface blistering, and spalling, and degradation of the mechanical properties of the material. Researchers use experiments and first-principles calculations to study the complexation, self-trapping, and diffusion of He atoms in the MAX phase. The mechanism of property damage and recovery is determined by studying the site of action, solvation energy, interlayer diffusion path, and rate of He atoms in the MAX phase.
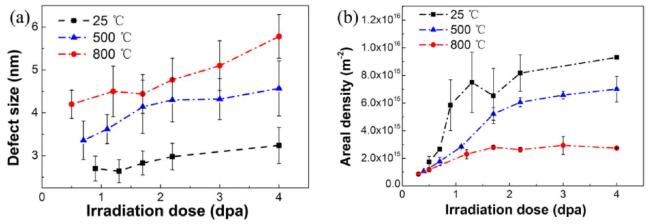
Fig. 14. Variation of (a) size and (b) density of Ti2AlC irradiated defects as a function of irradiation dose and temperature during 1 MeV Kr ion irradiation. Reproduced with permission from Ref. [158]. Copyright 2018 Elsevier. |
4.2.1. Sites of action and limitations
Several studies have shown that He ions mainly act on the atoms in the A layer of the MAX phase, but at the same time are confined by the A layer. Irradiation of polycrystalline Ti3AlC2 with 2×1017 cm-2He ions at 500∘C revealed that the Ti3Si2 layer remained intact while the Al layer was disrupted into a disordered structure by the intrusion of He ions, at which time the He atoms formed small bubbles with a radius of 1 nm in the Al layer [164], which caused the c-axis to expand and the aaxis to contract. It can be found that He bubbles do not readily form larger sizes in the MAX phase. The theoretical study by Jia et al. [165] showed that He tended to stay in the Al layer and squeezed out the normal dot atoms to create vacancies, which weakened the M-A layer strength, and the vacancies further trapped He accelerating the MAX phase layer separation, but it was difficult to form larger sizes because He was limited by the Al layer sites. The results of first-principles calculations by Xiao et al. [166] similarly demonstrated that helium atoms tended to occupy interstitial sites in the Al layer, and suggested that it was only possible to replace aluminum sites in titanium- and carbon-rich environments. In the MAB phase structure, MoAlB could form large plate-like He bubbles and small spherical He bubbles, whereas in Fe2AlB2 relatively small spherical He bubbles were formed. This difference in the shape and size of He bubbles might be attributed to the different confinement capabilities of the Al layers of different MAB phases for He atoms [140].
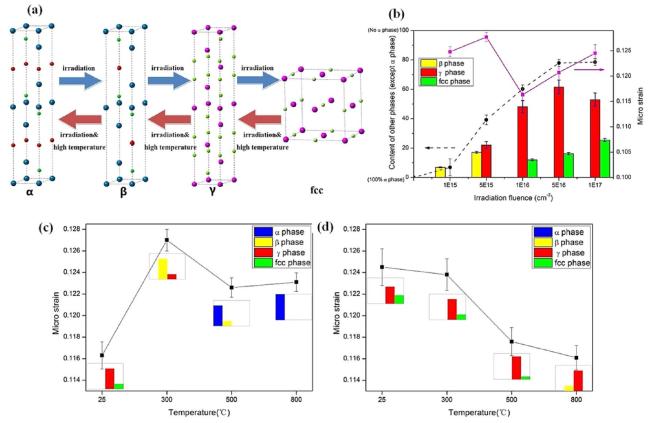
Fig. 15. Phase transformation pattern of Ti3AlC2 irradiated by C ions: (a) Schematic diagram of the phase transition structure and path; (b) microstrain and phase ratio of samples irradiated with different fluences at RT; (c-d) microstrain and phase ratio of samples irradiated with different temperatures at fluences of 1×10¹⁶ ions cm-2 and 1×10¹⁷ ions cm-2, respectively. Reproduced with permission from Ref. [79]. Copyright 2020 Elsevier. |
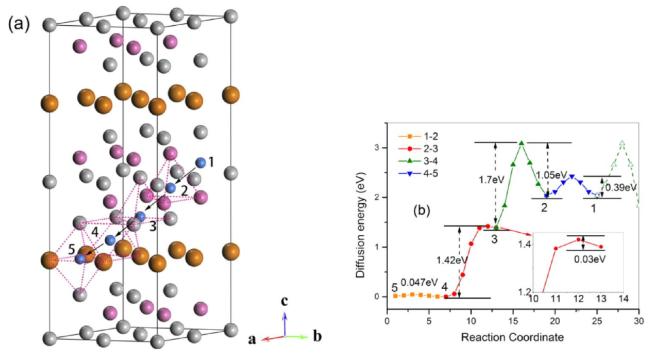
Fig. 16. (a) Interlayer migration paths of He atoms diffusing along the c-axis: |
The MAX phase with the A-site occupied by the element Si has the same set of laws. Zhang et al. [167] found that He atoms replace Si atoms in Ti3SiC2 with an energy of up to 50.86 eV, which caused a significant expansion of the c-axis, so this defect was not easy to form. This is consistent with the results of MAX phase studies where Al occupies the A site, i.e., He atoms dominate the A layer in interstitial positions. Song et al. [168] calculated the diffusion paths and diffusion barriers of individual He atoms in Ti3SiC2 as shown in Fig. 16, which indicated that uniformly generated He atoms in the material migrate rapidly to the Si layer at temperatures higher than 500∘C. However, the He atoms were also limited by the Si layer, and the He cluster consisted of no more than seven He atoms, which led to a volume expansion of Ti3SiC2 of only up to 2%. Since the diffusion barrier of He atoms in the Si layer was only 0.05 eV, other He atoms might flow to the grain boundaries.
This indicates that the He atoms are not stable in the A layer and may also act on other sites in the MAX phase. Shen et al. [169] suggested that at high flux and temperatures, He atoms detached from the He vesicles in the Al layer and acted on the C vacancies in the MX lattice, which caused expansion in the a-axis direction. Literature [102] studied He irradiation of Zr3Al3C5 and found that He interstitial atoms tended to be located in the Al-C layer, which laterally supported this view. However, they also suggested that the migration energy of He impurity atoms along the c-axis was lower than that along the a-b basal plane. Al vacancies were more capable of trapping He atoms than C vacancies, suggesting that He atoms mainly act in the A layer. The results of Xu et al. [170] were consistent with this viewpoint. Still, they theoretically calculated that the common spherical He vesicles might also come from He captured by C vacancies, which proved the diversity of He action sites. Meanwhile, the idea that A sites are more likely to capture He than X sites does not apply to all MAX-phase materials. C vacancies were found to trap He atoms better than Ge vacancies in the study of the Nb-based MAX phase Nb2GeC [103].
The confinement of He atoms by the A-layer is temperature-sensitive. He bubbles grow gradually with increasing irradiation and annealing temperatures [171,172]. Zhang et al. [173] and Su et al. [83] observed that He irradiation of Ti3SiC2 at 750∘C resulted in elongated He bubbles constrained by the nano-laminate structure, with the crystal structure remaining stable. However, when the irradiation temperature was elevated to 1100∘C, He bubbles grew significantly and broke through the A-layer confinement. At this point, large He bubbles forced the displacement of adjacent Si-layer atoms, which segregated on the surface to form a Si-O layer. As He bubbles grew, Si-layer damage intensified, driving the transformation of Ti3SiC2 from hexagonal phase to fcc structure. Thus, excessively high temperatures can cause He bubbles to overcome A-layer confinement, potentially inducing phase transitions or cracks. With the continuous development of MAX-phase irradiation studies, the role of He atoms in different MAX phases will become clearer.
4.2.2. Performance loss and recovery
As shown in Table 3, the performance damage caused by He ions mainly exists in two aspects: on the one hand, the damage caused by He to normal point defects and the accumulation of such defects exhibit manifests lattice anisotropic swelling, stress, microcracks, phase transformation, hardening, and helium embrittlement; on the other hand, He vesicle formation causes internal swelling and surface exfoliation phenomena. All these damages can lead to a significant decrease in mechanical properties. The manifestation of performance damage is the result of a variety of factors. For example, due to the point defects introduced by He shrinks the a-axis and subsequently generates stress, the stress release generates cracks, and the crack extension path is affected by the MAX phase and the impurity phase MX grain size [174]. When He atoms accumulate in the A layer to form He bubbles, the tandem formation of He two-dimensional structures or channels can likewise contribute to the fracture of the M-A layer. Since He tends to accumulate at grain boundaries, interfaces, and other locations with lower nucleation barriers, the interfaces and other places are more prone to fracture. He ion irradiation of the Zr substrate- V2AlC coating system found that the excess free volume and vacancies at the interface between the substrate and the coating make it a preferential nucleation site for He, and the He bubbles at the interface are larger and denser, which leads to a decrease in coating adhesion with increasing irradiation dose [175]. In addition to He vesicle-induced swelling and surface spalling, cracking is the main mechanical property damage induced by He irradiation [176].
Table 3 He-irradiation-induced damage. |
| Year | Composition | Conditions | Damage | Ref. |
|---|---|---|---|---|
| 2014 | Ti3AlC2 | 500keV;300∘C,500∘C or RT | He bubbles, dislocations, and microstrains | [179] |
| 2017 | Ti3AlC2 | 400keV;500∘C or RT | oriented cracks, surface exfoliation | [174] |
| 2017 | Zr/V2AlC | 500keV;RT;450∘C annealed | reduced the adhesion of the coating | [175] |
| 2018 | Ti3SiC2 | 110 keV ; RT, or 450∘C | crystal damage, phase decomposition, phase transition | [177] |
| 2018 | Ti3SiC2 | 110keV;RT;430∘C,750∘C, or 1050∘C annealed | phase decomposition and recovery, He bubbles | [172] |
| 2019 | Ti2AlC | 100keV;RT-750∘C | lattice distortion, He bubbles, microcracks | [176] |
| 2020 | Cr2AlC | 100keV;RT;700∘C or 600∘C annealed | irradiation hardening | [178] |
| 2021 | Ti2AlC | 110keV;RT;450∘C,600∘C or 700∘C annealed | laminations, dislocations, non-nanocrystalline phases, reversible phase transition, C enrichment | [171] |
| 2021 | Ti3SiC2 | 110 keV ; RT or 750∘C | highly disordered (RT), stable lattice (750∘C ), elongated He bubbles | [173] |
| 2023 | Ti3SiC2 | 110keV;RT;1100∘C annealed | large-sized He bubbles, phase transition, Si layer damage | [83] |
Zhang et al. [172,177] proposed that He irradiation of Ti3SiC2 exists in three stages of damage: accumulation of point defects and damage to the crystal structure at low doses; irradiation dose increases, part of the Si layer is destroyed, and nano amorphous TiC is generated in the MAX phase; at higher doses, crystalline TiC phase impurities are generated. The dose is further increased, and then the MAX phase irradiation reaches saturation, showing a high irradiation tolerance. The damage caused by He is more sensitive to temperature, and high-temperature irradiation and annealing are conducive to the annihilation of defects, the recovery of damaged bonds, and lattice reconstruction. For example, both Ti3SiC2 can effectively achieve defect recovery or restoration of the hexagonal crystal structure of the MAX phase under an irradiation or annealing temperature of 750∘C [172,173]. Wang et al. [178] found that the hardening of Cr2AlC films due to He ion irradiation disappeared after annealing. Su et al. [171] found that three types of nanostructures were produced after He irradiation of Ti2AlC : firstly, fcc nanostructures of TiC solid solution produced by diffusion of the Al layer; secondly, the irradiation-induced amorphization of this fcc structure; and thirdly, the recrystallization of TiC nanostructures to produce MAX-phase nanostructures during the annealing process. This suggests that part of the He-induced phase transformation also becomes a reversible process due to high-temperature annealing, which is also supported by [179].
4.3. H ion radiation damage
4.3.1. H diffusion
H is another impurity atom produced by the nuclear transmutation reaction of neutrons with structural materials. H -ion irradiation, also known as proton irradiation, has been used to mimic the damage created by neutron irradiation, which has an irradiation damage rate that is one to three orders of magnitude higher than that of neutrons, but lower than that of typical heavy ion irradiation. Despite the differences between proton and heavy-ion irradiation in the PKA cascade process, electron energy loss, and energy spectra, they are similar in irradiation MAX phase-induced generation of defects and structural evolution, with Frenkel defects, antisite defects, and phase decomposition as the main manifestations [51], so they will not repeat the discussion. In 2018, Tang et al. [180] investigated the permeation behavior of H in Cr2AlC and Ti2AlC and found that the permeation rate of H in the MAX phase was low and easily spilled out of the material. Ling et al. [91] further used DFT to calculate the diffusivity of H in the MAX phase, as shown in Fig. 17. H atoms tend to diffuse parallel to the A-plane and are difficult to penetrate beyond the A-layer. Still, the vacancies in the A-layer can improve the mobility of H impurity atoms, and thus H clusters tend to aggregate near the A-plane and grow into H vesicles. By comparing the diffusion behaviors of H and He in the MAX phase, it can be found that H preferentially occupies the interstitial sites, especially the centers of polyhedral structures. H is more likely to form composite structures with vacancies, and these interstitial structures cause lattice expansion [103,181]. However, unlike He-vacancy structures and He vesicles, H easily escapes from the material due to the constant leaps of H in the interstitial sites and the instability of the process of forming H vesicles, which produces a lower impact on the material properties than He.
4.3.2. H/He synergies
Both H and He ions are products of nuclear transmutation reactions, and they exist and act on materials almost simultaneously. Therefore, irradiation of H and He often has a synergistic effect, which is first manifested in the trapping of H by He and the inhibition of H bubble formation. H tends to occupy Ti -Al tetrahedral interstitial sites, and He tends to occupy octahedral interstitial sites. H is repulsive to H atoms, but weak binding exists between He-He as well as He-H. When He and vacancies (V) are combined to form a He-V structure, the adsorption capacity of H is strengthened, at which time the composite cluster will turn into a source of H trapping, driving the H atoms to be biased, and contributing to the formation of the H-He-V cluster structure [182,183]. The trapping of H by He inhibits the aggregation of H atoms into H vesicles on the one hand, and prevents the further penetration of H into the material on the other hand.
Studies of H/He co-irradiation of MAX phases are still lacking. Although a study of H/He irradiation of Ti3SiC2,SiC, and TiC was recently published [184], no attention was paid to the respective roles of H and He in the irradiation damage, and thus it is not yet possible to determine whether synergistic damage exists during H and He irradiation of the MAX phase. However, researchers have found a significant synergistic swelling of H and He in the study of H and He irradiation effects on materials such as FeCr ferrite alloys, ODS steels, and CLAM steels. The H atoms took on a catalyst-like role, catalytically enhancing the He-induced irradiation swelling, which resulted in a higher degree of material destruction than He ion irradiation alone [185,186]. We therefore hypothesize that such irradiation synergistic damage may also exist in the MAX phase, but further studies and validation are needed.
5. Electron irradiation damage of MAX/MAB phase
The light mass of electrons and low energy transfer efficiency often produce only one pair of Frenkel defect pairs in a single impact, but they also have the advantage that the irradiation process is simple, and the damages caused are all off-site damages, which do not introduce any impurity atoms in the material [187]. Huang et al. [188,189] found that electrons at 100 KV produce almost no damage to MAX-phase materials, indicating a high threshold energy for damage under electron irradiation in the MAX phase. Further electron irradiation of Ti3AlC2 was carried out at a current density of 200 KV and 105 A⋅ cm-2, as shown in Fig. 18(a-h). When the irradiation was carried out up to 150 s, TiC crystalline facets were observed, the diffraction point tended to polycrystalline rings at 300 s, amorphous structures appeared at 600 s, and the amorphous structures increased as the time continued to increase. This damage process can be explained by Fig. 18(i). Under the action of the electron beam, the atoms of Ti3AlC2 absorbed energy from the electrons, and some atoms consumed the energy in a vibrational manner. Due to the weak bonding between Ti and Al atoms, Al detached from the crystal structure after the energy exceeded the atomic displacement threshold, followed by the delocalization of C and Ti atoms, producing Frenkel defect pairs. The process of generating defects such as dislocations, stacked layer dislocations, and twins was similar. In Fig. 18(j), the Al atomic layer was detached, and the atomic sequence ABABACACA became ABBACCA, which was a very unstable structure. At this time, continuing to electron irradiation, the atom would slide in different directions under the action of the electron energy and began to rearrange into the structure of $\mathrm{A}\mathrm{C}\mathrm{B}\mathrm{A}\mathrm{B}\mathrm{C}\mathrm{A},\mathrm{A}\mathrm{C}\mathrm{B}\mathrm{A}\mathrm{C}\mathrm{B}\mathrm{A},\mathrm{A}\mathrm{B}\mathrm{C}\mathrm{A}\mathrm{B}\mathrm{C}\mathrm{A},\mathrm{A}\mathrm{B}-CACBA$, as shown in Fig. 18(k1)-(k4). So, the detachment, diffusion, and atomic rearrangement of the Al layer in electron irradiation are responsible for the appearance of TiC and amorphous structures.
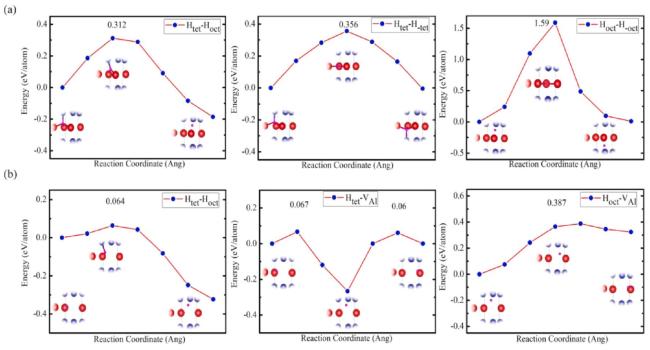
Fig. 17. Migration energy barriers for H atoms: (a) intact Cr2AlC; (b) Cr2AlC containing Al vacancies. Reproduced with permission from Ref. [91]. Copyright 2023 Elsevier. |
6. Conclusions and perspective
During more than a decade of research on the irradiation properties of the MAX/MAB phase, abundant research results have continuously demonstrated its high damage tolerance and resistance to amorphization. This is manifested in the following aspects: the use of antisite defects and Frenkel defects to accommodate point defects; the use of atomic rearrangement and crystalline transformation to resist amorphization; the trapping of He atoms through the low-bonding A-layer to limit the growth of helium bubbles; the inhibition of further diffusion and penetration of energetic particles; and the realization of defect annihilation and damage recovery in the process of high-temperature irradiation and annealing. Especially in recent years, the medium- and high-entropy MAX phases with complex chemical properties, the structurally stable MAB phase, and the MAX phase with novel components have gradually replaced the conventional MAX phase as the research hotspots, indicating that the irradiation research of ternary layered materials has made great progress. However, considering the diversity and tunability of MAX/MAB phase materials, as well as the imperfection of high-energy particle irradiation experiments, more indepth and comprehensive explorations are still needed. Key points for further research that can be done in this field are presented below.
6.1. Entropy regulation
High-entropy MAX phases have received much attention since their successful synthesis, thanks to the key properties such as complex chemical properties, lattice distortion, retarded diffusion, and cocktail effect brought about by the increased entropy value [190-192]. In the last three years, research on materials for nuclear applications has begun to focus on the medium- and high-entropy MAX phases and current results indicate that the entropy increase may be beneficial in enhancing the mechanical properties, stability, and resistance to irradiation of materials. It is not true that the higher the entropy value, the better; rather, there are limits to this growth. This suggests that under the same solid solution element system, there may be a specific entropy value of the MAX phase to optimize its irradiation resistance. A similar trend has been observed in pyrochlores and carbides [193-199], yet relevant research on MAX phases remains scarce.
The fundamental mechanisms underlying the enhanced irradiation resistance of medium- and high-entropy MAX phases involve the restriction of defect migration and formation by heterogeneous lattice distortion, the retardation of damage via chemical complexity, and the improvement of intrinsic defect self-healing capabilities. Prioritizing entropy elevation in the M and A layers is advisable, with the core impact being the modulation of A-layer properties-such as the pressure exerted on the A layer by M-layer distortion and the alteration of M-A bonding strength. On one hand, the A layer of MAX phases is the primary site for cascade collisions and Frenkel defect generation, and disordering within the A layer is the main driver of phase transitions. On the other hand, the A layer's capacity to accommodate defects constitutes a critical mechanism for resisting amorphization, while the metallic bonding and slip properties between the A layer and M-X layers are key to the toughness, thermal conductivity, and processability of MAX phases. The compressive stress induced by M-layer lattice distortion on the A layer constrains defect migration along the C-axis while enhancing in-plane mobility within the A layer, facilitating the recombination of Frenkel defects and enabling dynamic defect recovery [118]. Increasing entropy in either the M or A layer can also strengthen M-A bonding and elevate the energy barriers for phase transitions and decomposition. For instance, (TiZrVNbTa) 2AlC exhibits significantly higher phase stability than its single-component counterparts [121]. Thus, when the A layer is less stable, an appropriate solid solution in the A or M layers can moderately enhance M-A bonding and create distortions that confine A-layer defects.
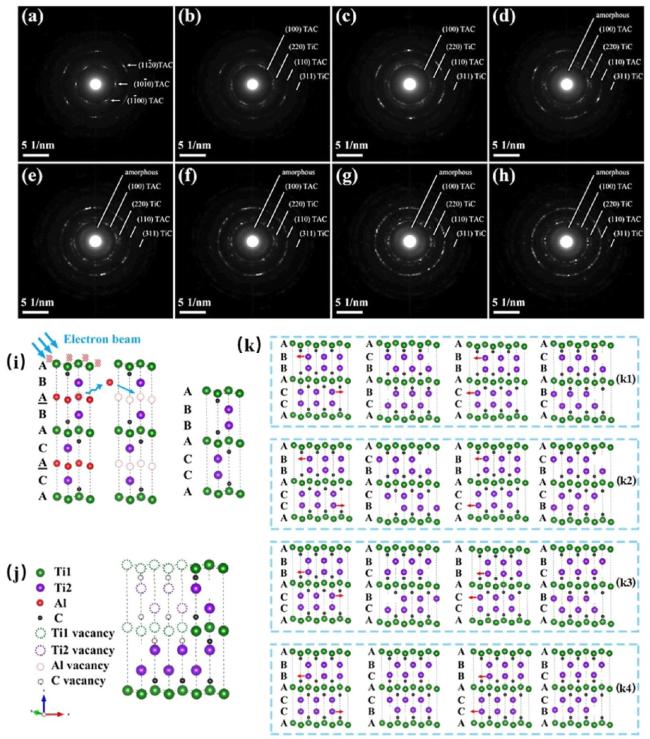
Fig. 18. Structural evolution by electron irradiation: (a-h) SAED maps taken with the electron beam parallel to [0 001] for Ti3AlC2 after irradiation times of 0 s, $150\text{ }\mathrm{s},300\text{ }\mathrm{s},600\text{ }\mathrm{s},1010\text{ }\mathrm{s},1370\text{ }\mathrm{s},1730\text{ }\mathrm{s}$, and 2090 s, in that order; (i-k) Schematic diagrams of defect generation and atomic rearrangement. Reproduced with permission from Ref. [188]. Copyright 2020 Elsevier. |
However, excessive solutes in M or A layers may cause entropy-driven short-range ordering (i.e., phase decomposition) under irradiation and thermal activation due to solute supersaturation. Moreover, overly strong M-A bonding reduces the A layer's point defect accommodation capacity, increasing atomic displacement in M and X layers. If complex M-layer atoms jointly pin A-layer defects into vacancy-multi-M-atom complexes, their annihilation becomes impeded. This explains why (TiVNbZrHf)2SnC has lower defect tolerance than (TiVNb)2SnC-excessive M-Sn bonding induced by Zr and Hf addition [122]. Furthermore, complex solutes in M or A layers may trigger unexpected phenomena, such as diffusion of high-entropy M-layer elements into the A layer, causing M-A bond imbalance or excessive antisite defects. Special attention should be paid to highly diffusible Cr atoms. Solute selection must be purposeful: elements with high neutron activation (e.g., Mo, W, Hf) should be avoided in non-shielding materials for fusion reactors.
Based on research speculation, the optimal entropy range for the Msite or A-site is 1.1R-1.6R (corresponding to 3-5 solutes). For example, by using 2-4 elements from Ta,Nb,V, and Zr as equimolar solid solution elements at the M-site of Ti3AlC3 to appropriately enhance the entropy value and M-A bonding strength, more excellent nuclear-grade MAX phase materials can be obtained. By systematically eliminating elemental differences, gradually increasing MAX phase entropy, and comparing irradiation resistance, the best-performing multicomponent MAX structure for a given system can be identified. This may serve as a key strategy to overcome conventional MAX phase bottlenecks and develop advanced nuclear materials.
6.2. Structural design of components
One is the difference in radius between different atoms. Due to the same or similar molar ratios of the selected elements, each atom randomly occupies the position of the dot lattice, at which time the difference in atomic radii will directly affect the degree of lattice distortion. Lattice distortion is too small to weaken the chemical complexity at this entropy value, while the lattice distortion is too large to affect the structural stability and improve the defect migration barrier, which is not conducive to the annihilation of defects and damage recovery. Therefore, for the selection of solid solution elements, the key lies in the appropriate radius difference to regulate the lattice distortion. For example, smaller-radius elements like Fe and Cr may not be suitable as M site solutes simultaneously with larger-radius elements such as Zr and Hf. In contrast, elements such as Ti,Ta, and Nb, with moderate atomic radii, can be combined with various elements as M-site solutes.
The second is the atomic electronegativity, that is, the ability to attract electrons, which is manifested in the strength of bonding, especially the bonding strength of the M-A layer. A material with strong M-A bonding allows it to remain stable under low-dose irradiation but may become amorphous in high-dose irradiation because of difficult-to accommodate point defects. The M-A bonding is too weak, so atoms in the A layer are easily sputtered off-site to further produce inversion defects and phase transitions, which are difficult to recover. When the A-layer stability is weak, electronegative elements like Mo and W can be selected as M-site solutes to strengthen M-A bonding, such as (TiMoW)2AlC; when the A-layer's defect accommodation capacity is poor, Zr and Hf can be chosen as M-site solutes to weaken M-A bonding, such as (TiHfZr)3SiC2.
Third is the neutron properties of atoms. For neutron shielding materials, elements with large neutron absorption cross-sections such as W and B are selected. While for non-neutron shielding materials, elements with very small neutron absorption cross-sections such as Zr are chosen. In our recent research [48] on the two-component MAX phase with M/A-site solid solution based on Ti3SiC2, we found that different solid-solution elements and sites change the properties of the electron cloud and the degree of distortion. This change, in turn, affects the strength and type of chemical bonds, ultimately altering the properties of the MAX phase. This finding indicates that it is feasible to conduct structural design for multi-component MAX phases to obtain the desired properties.
6.3. Composite material
The MAX/MAB phases can be used as both matrix and doped reinforcing phase in composites. For example, MAX-phase materials such as ${\mathrm{T}\mathrm{i}}_{3}{\mathrm{S}\mathrm{i}\mathrm{C}}_{2},(\mathrm{T}\mathrm{i}\mathrm{N}\mathrm{b}{)}_{3}{\mathrm{S}\mathrm{i}\mathrm{C}}_{2},(\mathrm{T}\mathrm{i}\mathrm{T}\mathrm{a}{)}_{3}{\mathrm{S}\mathrm{i}\mathrm{C}}_{2},(\mathrm{T}\mathrm{i}\mathrm{N}\mathrm{b}\mathrm{T}\mathrm{a}\mathrm{W}{)}_{3}{\mathrm{S}\mathrm{i}\mathrm{C}}_{2},{\mathrm{T}\mathrm{i}}_{3}(\mathrm{S}\mathrm{i}\mathrm{A}\mathrm{l}){\mathrm{C}}_{2}$, etc. are used as the reinforcing phases and composites with Al2O3,SiO2, and AlN ceramics, which are optimized in terms of strength, toughness, oxidation resistance, thermal shock resistance, and friction and wear properties [200-205]. The MAX phase materials can also be compounded with matrices such as CoCrFeNi high-entropy alloy and Ti6Al4 V alloy, and their friction and wear properties and electrochemical corrosion resistance are improved [206,207]. When MAXphase materials such as Ti3SiC2 and Cr2AlC are used as the matrix, reinforcing phases such as Mg,Al, and TiC can be doped to improve the mechanical properties [208,209]. Although the irradiation resistance of MAX-phase materials deposited on Zr substrates [156] and SiC [210] materials has been investigated, there are almost no irradiation studies on MAX/MAB-phase composites. Therefore, composites can be considered a new idea for future research, which have excellent mechanical properties to meet the needs of nuclear energy systems and can also be expected to be resistant to irradiation damage.
6.4. Systematic irradiation studies
Existing studies on MAX/MAB phase irradiation have focused on He-ion irradiation and heavy-ion irradiation, while neutron irradiation, proton irradiation, and electron irradiation have been less studied, which may be due to the consideration of economic and time costs. However, even He-ion irradiation and heavy-ion irradiation are far from achieving the goal of elucidating the irradiation performance and mechanism of MAX/MAB phase structure in nuclear energy systems, which stems from the fragmentation and narrow scope of the research. To realize the application of MAX/MAB phases in nuclear energy systems, the selection and design of target materials and irradiation conditions need to be the key to the research.
First, relative to the large MAX/MAB phase family, the irradiation studies of Ti-based MAX phases are relatively extensive, and the irradiation studies of other MAX/MAB phase materials are scarce. On this basis, the conclusions drawn for MAX/MAB phase materials are one sided. This requires the research team to make full use of experimental characterization and theoretical calculations, to continuously explore the performance characteristics of each system of materials, and to expand the nuclear MAX/MAB phase irradiation performance database. To simulate the real service environment, the use of heavy ions, protons, He ions, and other irradiations should be considered in the larger irradiation dose and high temperature, especially up to 1000∘C irradiation experiments, which is a great test of the material's anti-irradiation properties and thermal stability. In addition, neutron irradiation caused by ex-situ damage and nuclear transmutation reaction products on the material of the impact of almost simultaneous existence, how to carry out a synergistic effect between the two remains to be clarified. To date, there are few experimental studies of simultaneous (or sequential) irradiation of MAX/MAB phases by H and He ions [184], and the synergistic effect between the two in terms of damage macroscopic properties has not been considered, while there is a gap in the study of synergistic effects of other particles. Materials in nuclear reactors are also subject to coolant corrosion, so the changes in the irradiation properties of the MAX/MAB phase after corrosion resistance also need to be considered.
CRediT authorship contribution statement
Min Liu: Writing - review & editing, Visualization, Resources. Yulin Wei: Writing - original draft, Resources, Data curation. Junxiong Liu: Formal analysis, Data curation. Chenhao Yang: Methodology.
Declaration of Competing Interest
The authors declare that they have no known competing financial interests or personal relationships that could have appeared to influence the work reported in this paper.