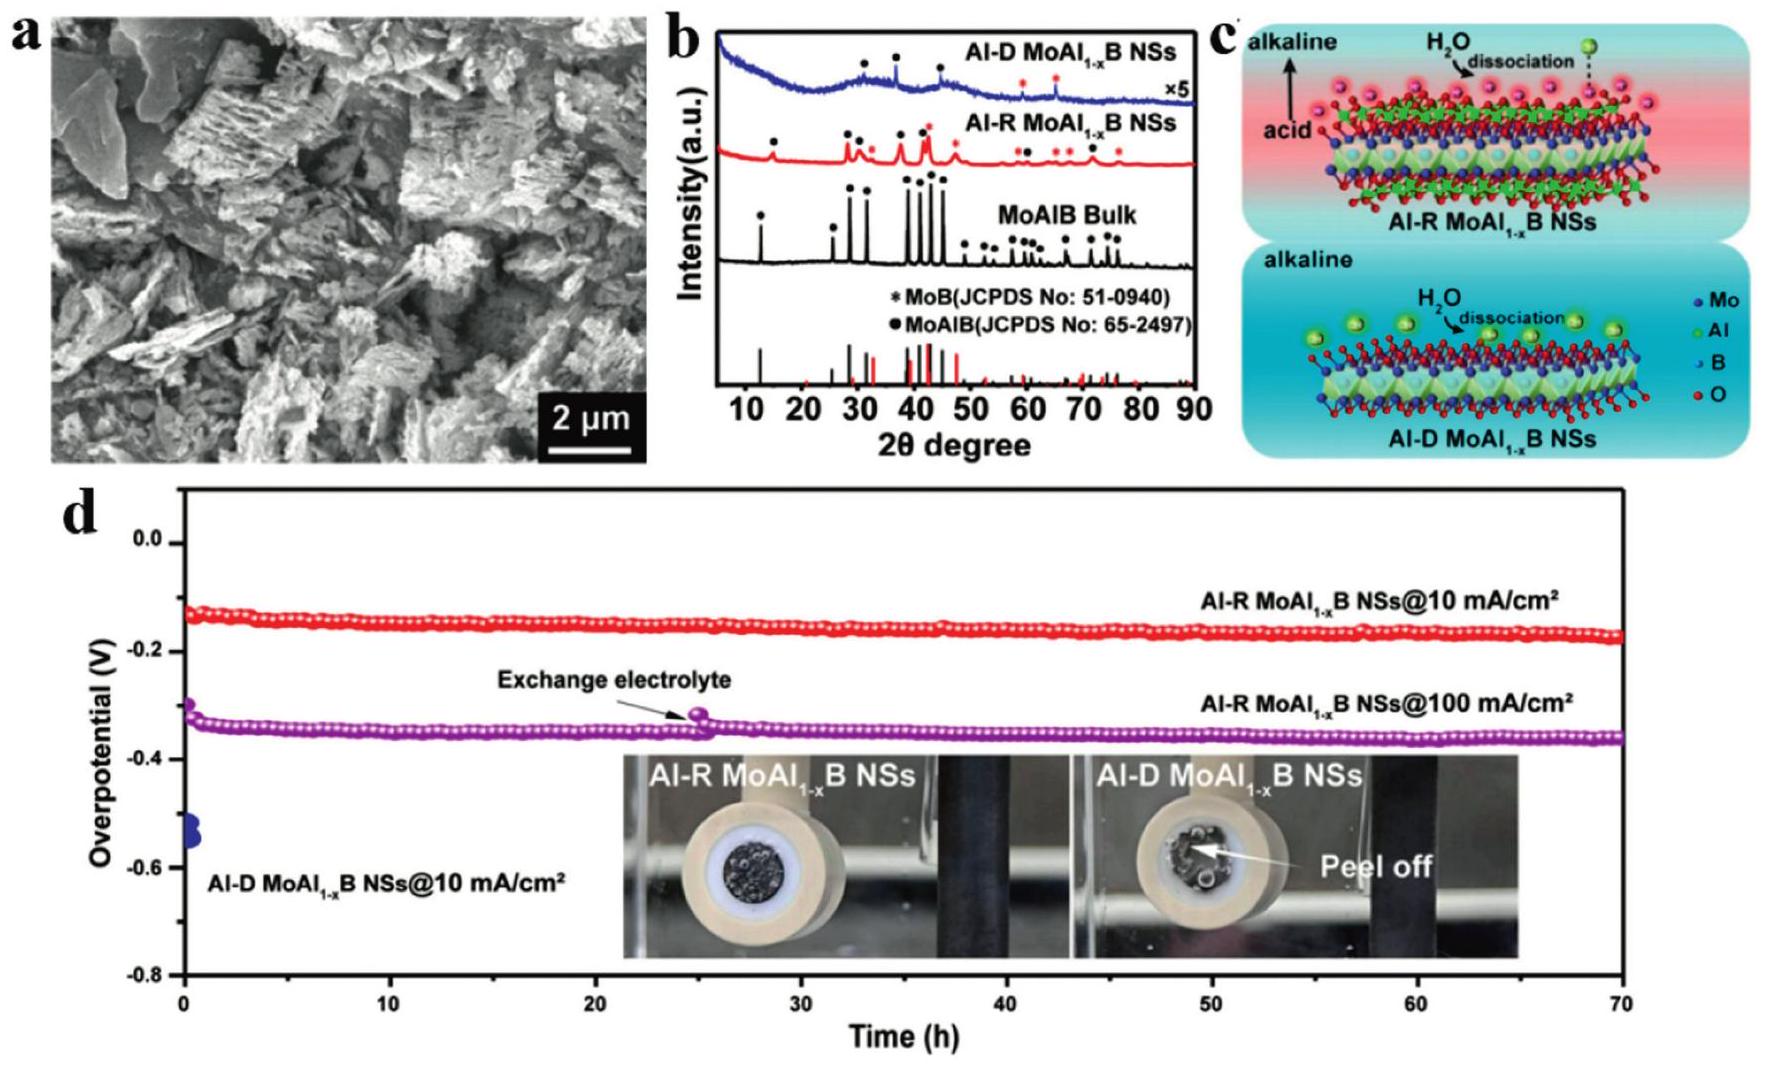
Fig. 10. (a) SEM image of the Al-R MoAl1-xB, (b) XRD patterns of the etched samples of Al-R and Al-DMoAl 1-xB, (c) schematic illustration of the microenvironment between Al-R and Al-D MoAl 1-x B samples, (d) chronopotentiometry test of Al-RMoAl1-x B recorded at the current densities of 10 and 100 mA cm -2, the inset image illustrates the hydrogen gas bubbles on the surface of Al-R and Al-DMoAl1-xB electrodes. Reproduced with permission from Ref [106] Copyright 2025 American Chemical Society.
本文的其它图/表