×
模态框(Modal)标题
在这里添加一些文本
关闭
关闭
提交更改
取消
确定并提交
×
模态框(Modal)标题
×
ISSN 2096-2827 CN 31-2118/G2
Toggle navigation
首页
期刊简介
编委会
在线期刊
最新录用
当期目录
过刊浏览
阅读排行
下载排行
引用排行
E-mail Alert
投稿指南
征稿简则
期刊订阅
出版道德声明
联系我们
English
图/表 详细信息
An emerging two-dimensional transition metal boride (MBene) material: Recent experimental progress and prospects
Wei Xiong, Zhijun Dong
Extreme Materials, 2025, 1(
2
): 11-26. DOI:
10.1016/j.exm.2025.04.001
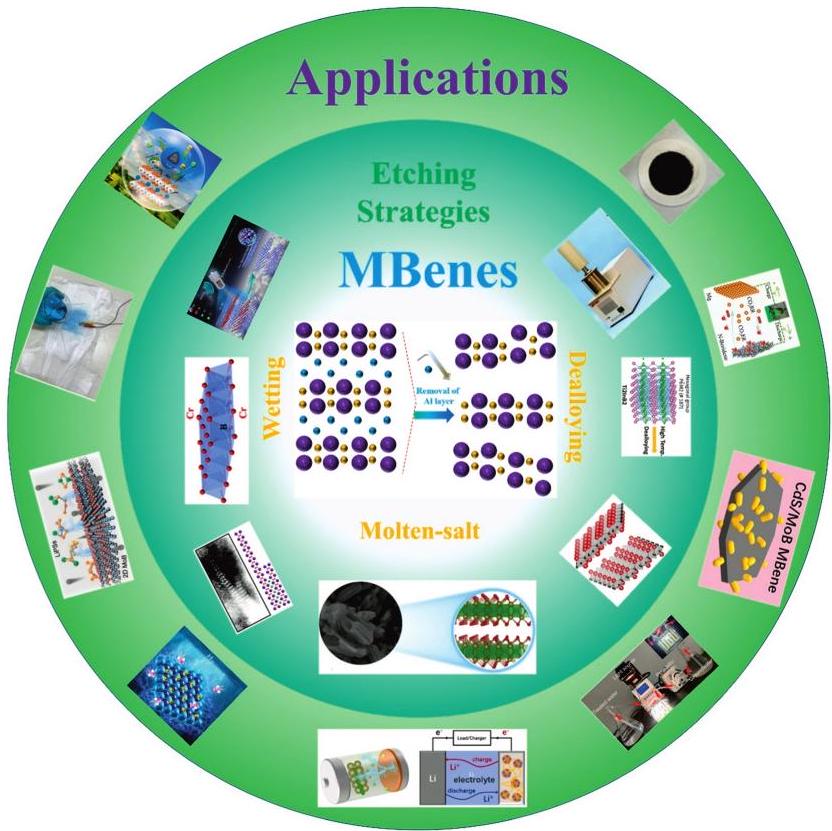
Fig. 14.
Schematic illustration of the etching strategies and applications of MBenes.
本文的其它图/表
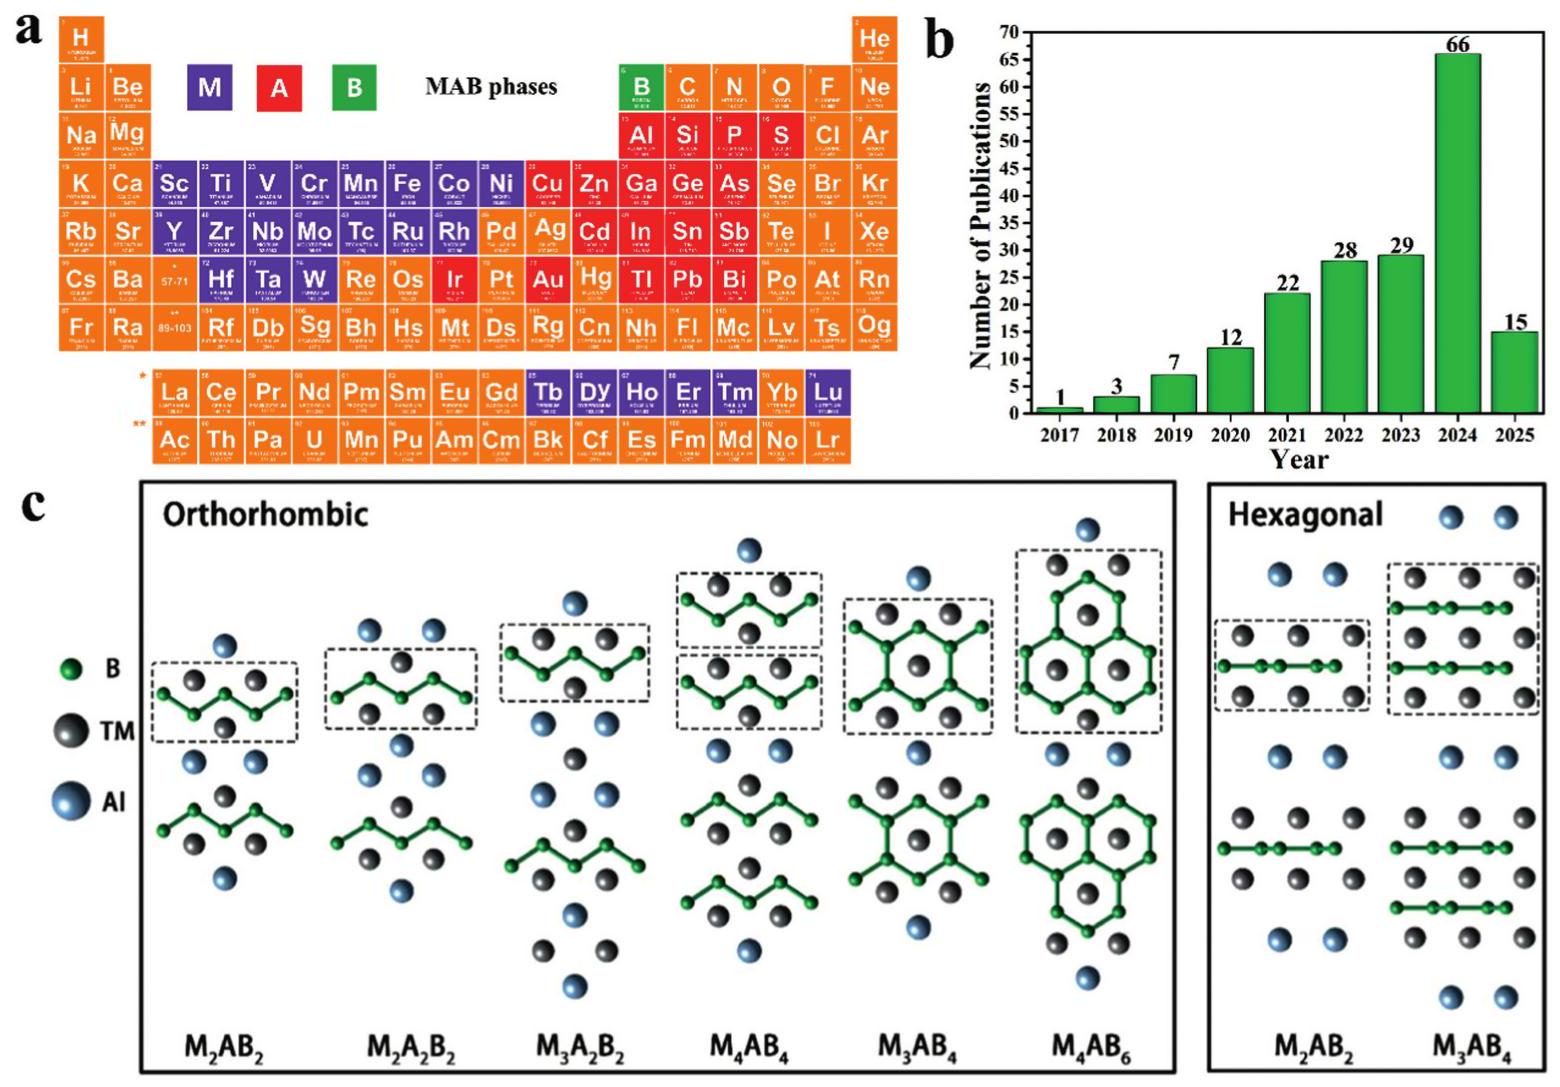
Fig. 1.
(a) The elements from a periodic table in reported MAB phases. (b) Publication trends about MBenes based on Web of Science. (c) The structure of MAB phases with orthorhombic and hexagonal crystal systems.
Reproduced with permission from R.[
30
] Copyright 2022, Royal Society of Chemistry.
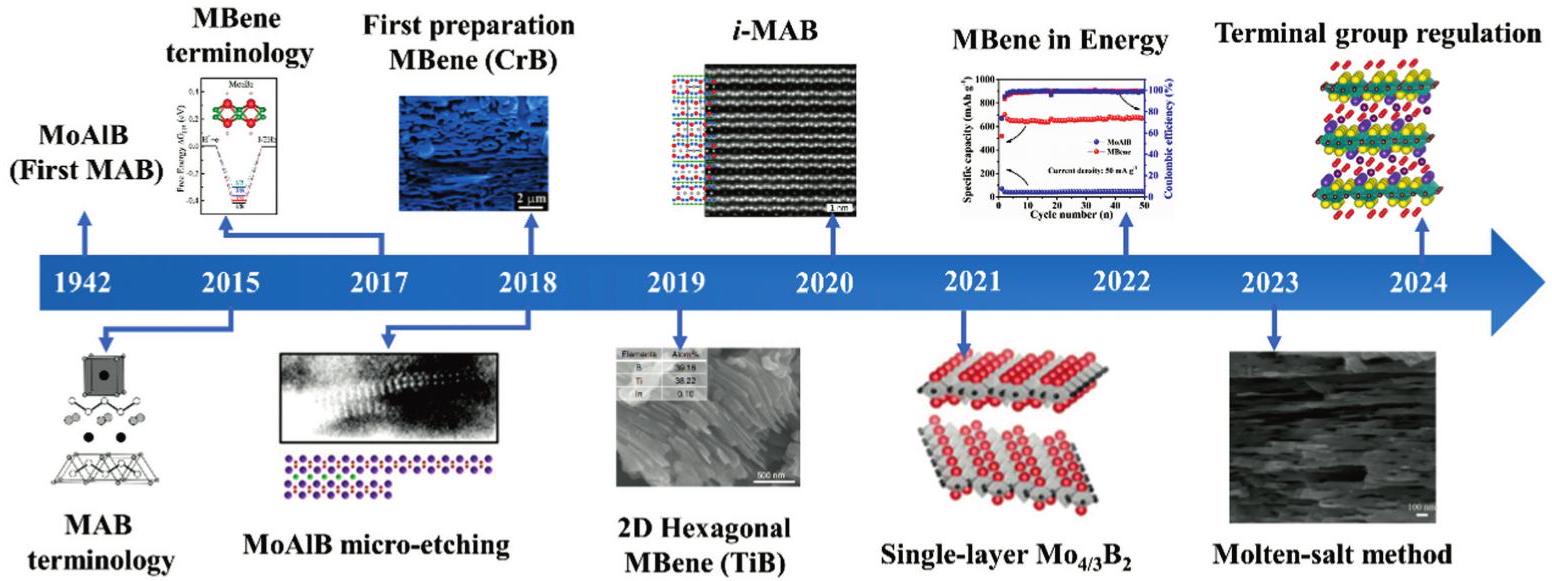
Fig. 2.
The representative historical timeline of MBenes.
Copyright 2015 [
18
], 2018 [
34
], 2020 [
33
], American Chemical Society. Copyright 2017 [
17
], Royal Society of Chemistry. Copyright 2018 [
35
], 2022 [
36
], Elsevier. Copyright 2019 [
37
], Springer Nature. Copyright 2021 [
38
], Science. Copyright 2023 [
39
], SciOpen. Copyright 2024 [
40
], Wiley.
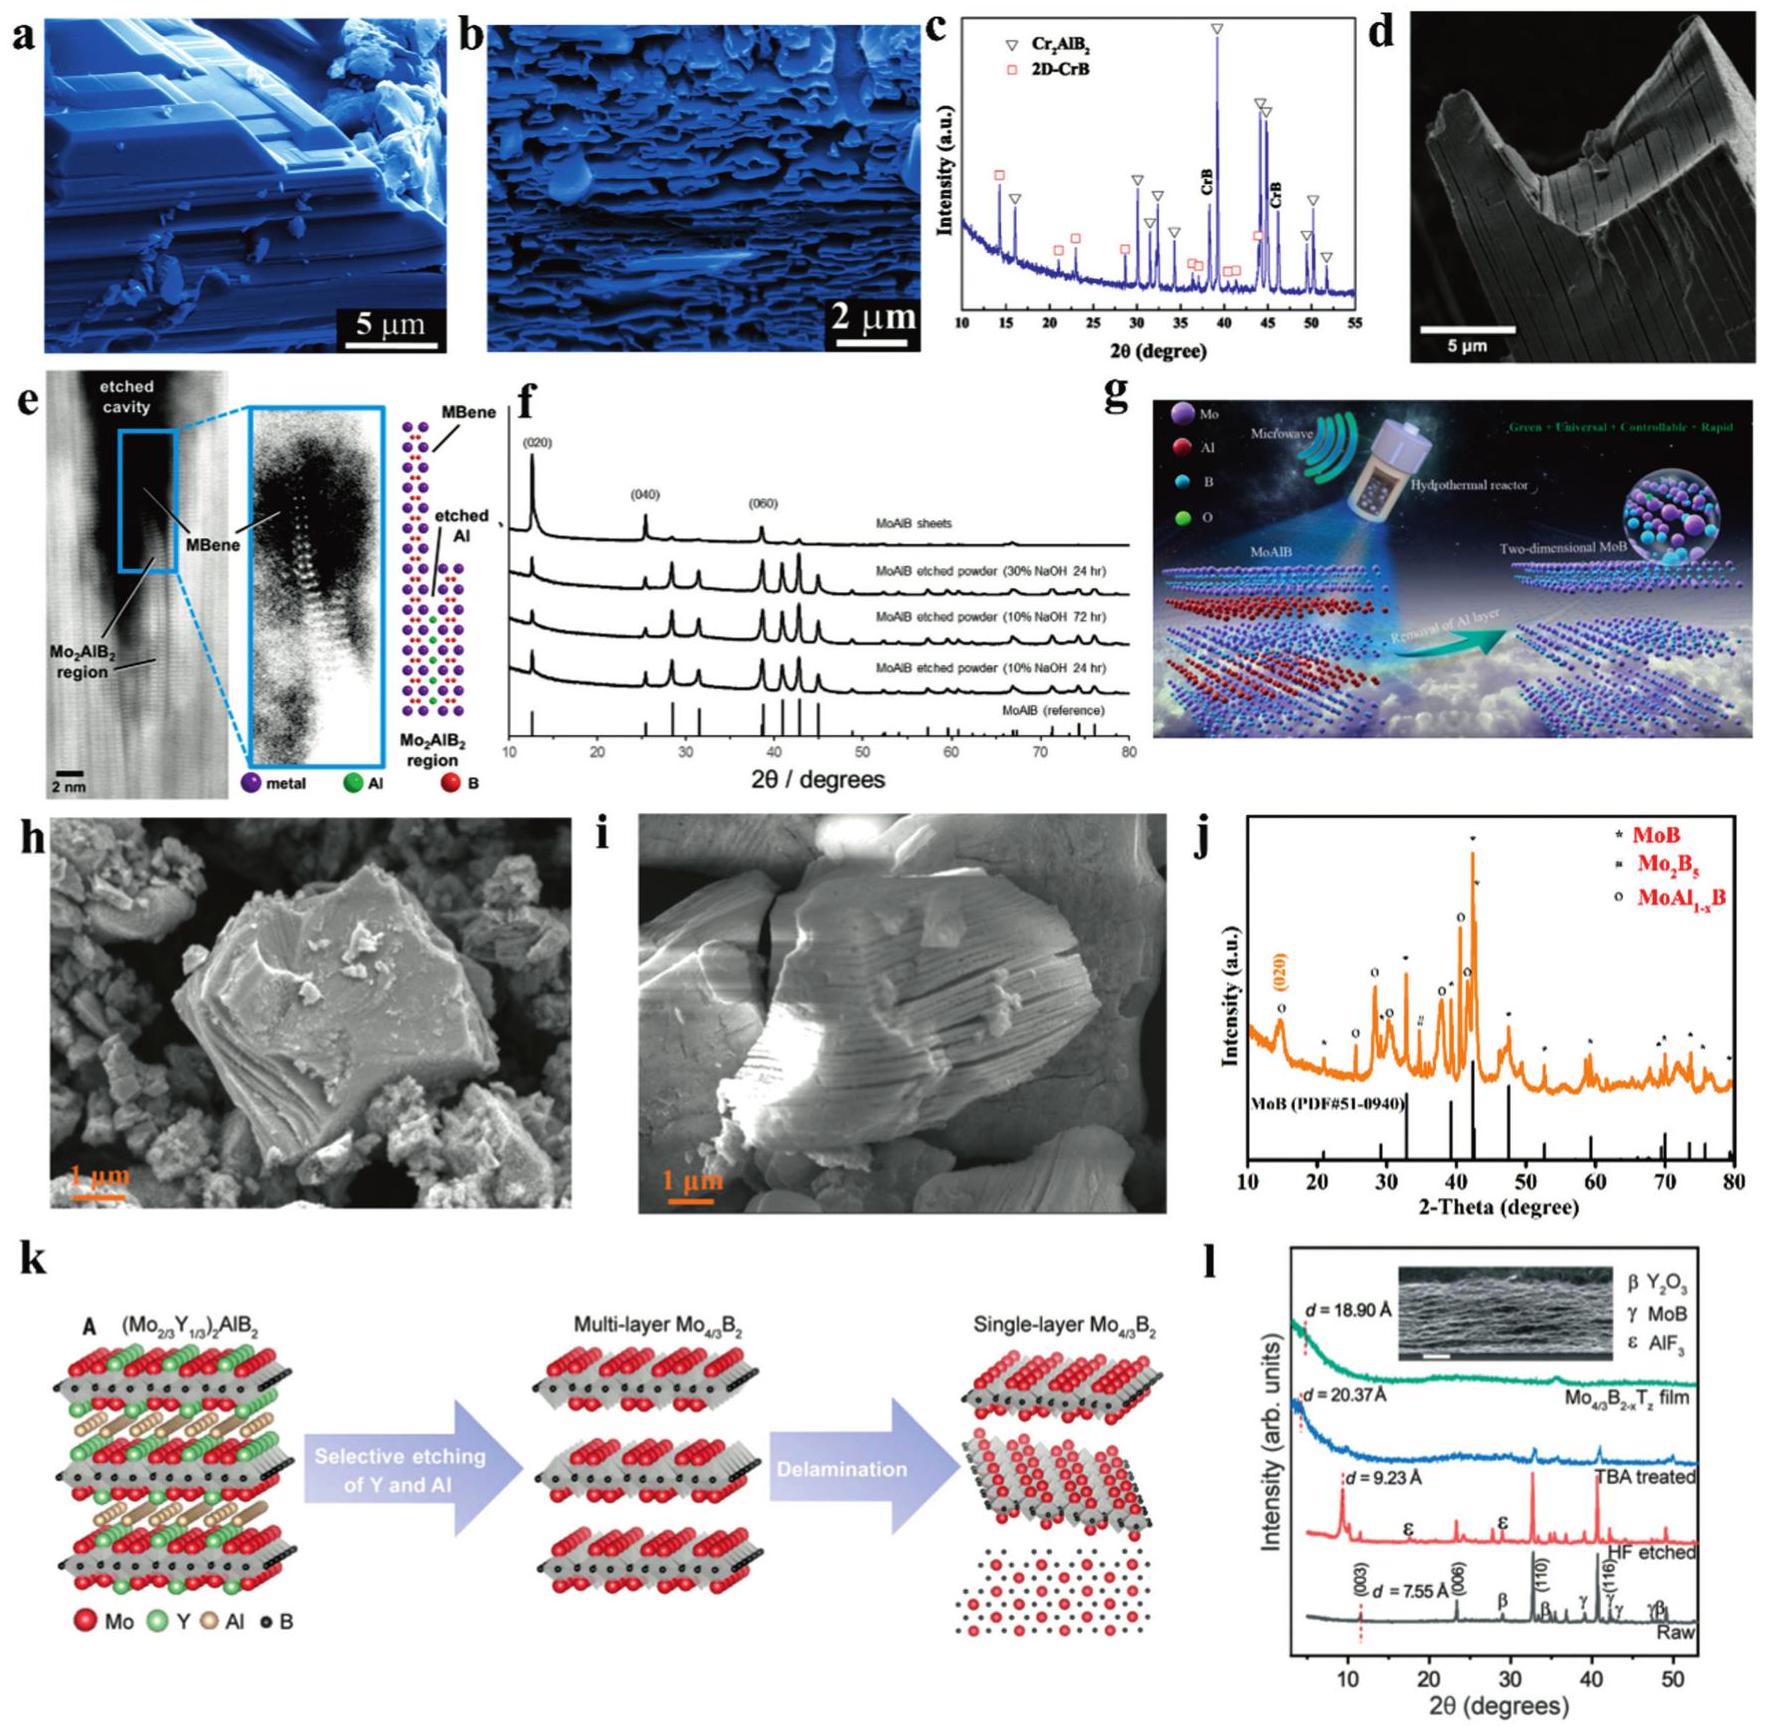
Fig. 3.
SEM images of (a)
Cr
2
AlB
2
, (b) CrB MBene etched by diluted HCl, (c) XRD patterns of CrB MBene and
Cr
2
AlB
2
. (d) SEM image of etched MoAlB soaked into
10%NaOH
for 24 h, (e) ADF-STEM image of delaminated MoB sheets in an etched area, (f) XRD patterns bulk MoAlB and etched MoAlB soaked into NaOH solutions. (g) The illustration of the MoB MBene prepared by the microwave-assisted hydrothermal alkaline solution method.
Reproduced with permission from Ref. [
34
-
36
,
38
,
41
]. Copyright 2018, 2022 Elsevier, 2017, 2018 AmericanChemical Society, 2021 Science, respectively.
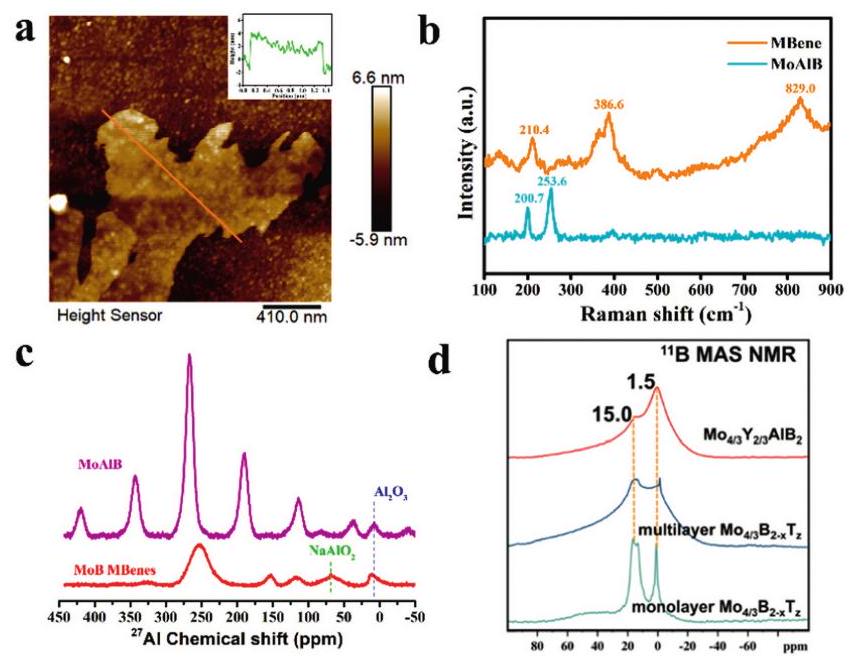
Fig. 4.
(a) AFM image of MoB MBenes, (b) Raman spectra (c)
27
Al
solid-state NMR (d)
11
B
solid-state spectra NMR of MAB phase and corresponding MoB MBenes.
Reproduced with permission from Ref [
45
,
51
] Copyright 2022 Elsevier, 2025 Royal Society of Chemistry, respectively.
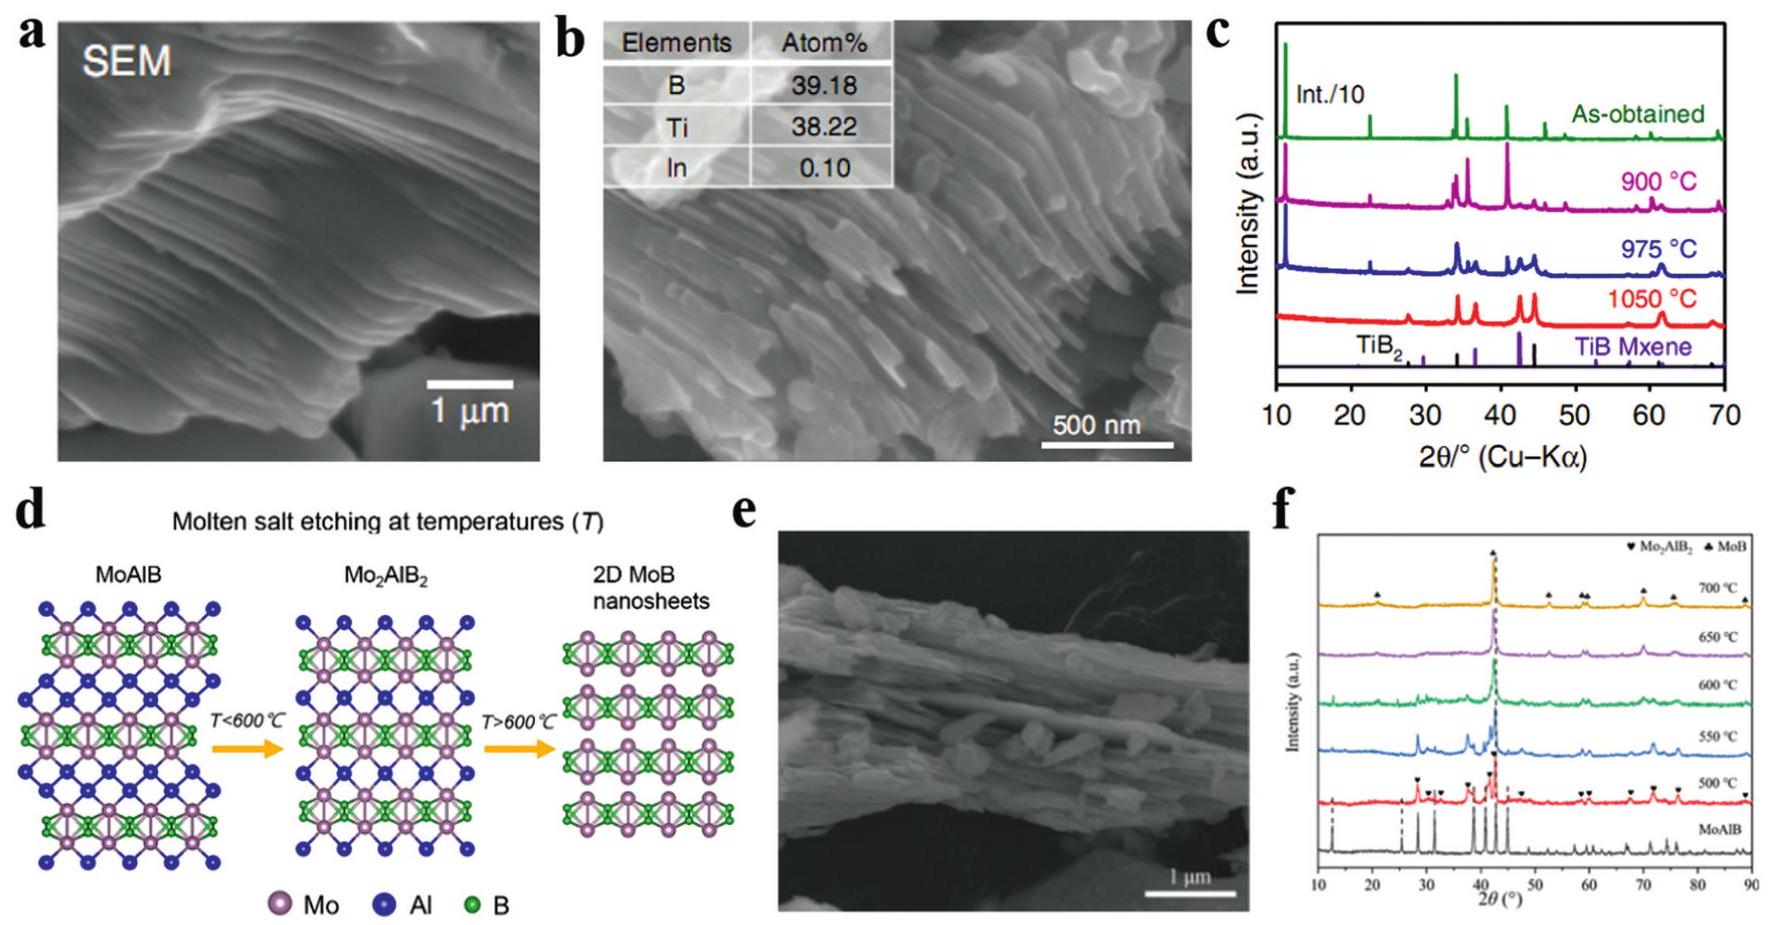
Fig. 5.
SEM images of (a)
Ti
2
InB
2
, (b) layered TiB and its atomic ratio. (c) XRD patterns of layered TiB etched at different temperature. (d) The shematic illustration of MoB MBene etched at different temperature, (e) SEM image of as-prepared MoB MBene, (f) XRD patterns of MoAlB etched by
ZnCl
2
at different temperature.
Reproduced with permission from Ref [
37
] Copyright 2019 Springer Nature.
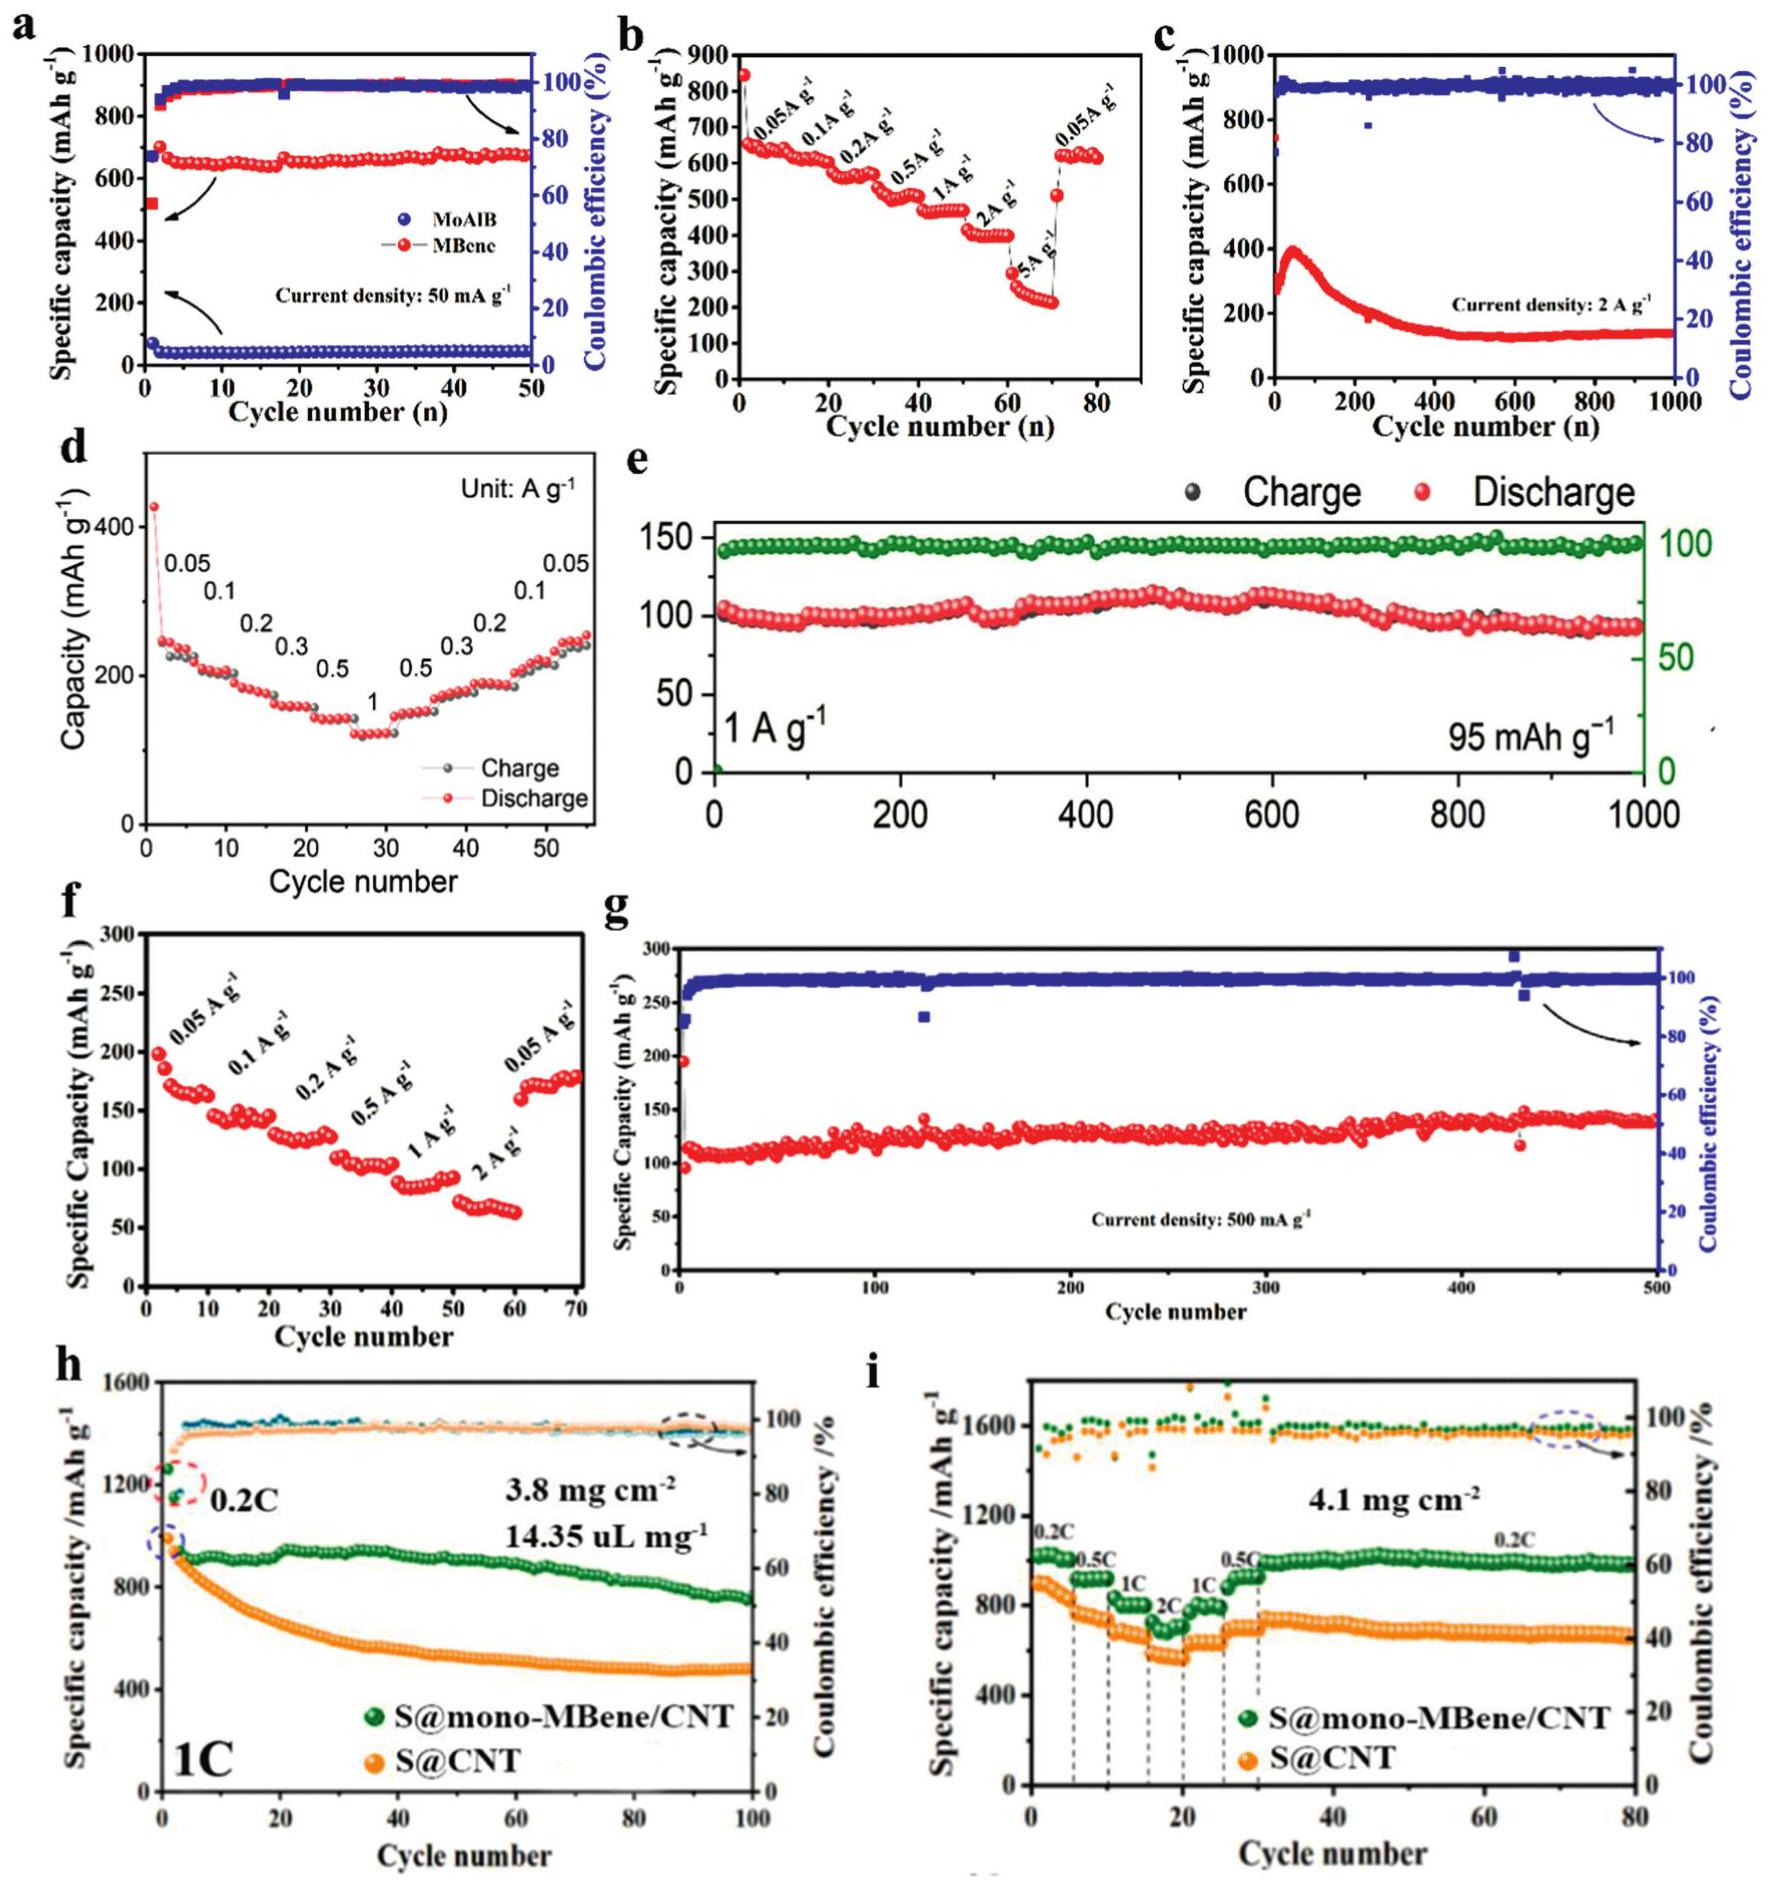
Fig. 6.
(a) The cycle performance of MoAlB and MoB MBene at
50mAg
-1
in LIBs, (b) rate capability and (c) long cycle performance at
2Ag
-1
of MoB MBene. (d) Rate capability and (e) long cycle performance of the HfB MBene anode in LIBs. (e) Rate capability and (f) long cycle performance of the MoB MBene anode in SIBs. (h) Comparison of the cyclic capacity at 1 C and (i) the cyclic capacities at variant rates ranging from 0.2 C to 2 C of S@mono-MBene/CNT and S@CNT cathodes.
Reproduced with permission from Ref [
36
,
45
,
62
,
81
] Copyright 2022, 2025, 2023 Elsevier, 2023 Wiley, respectively.
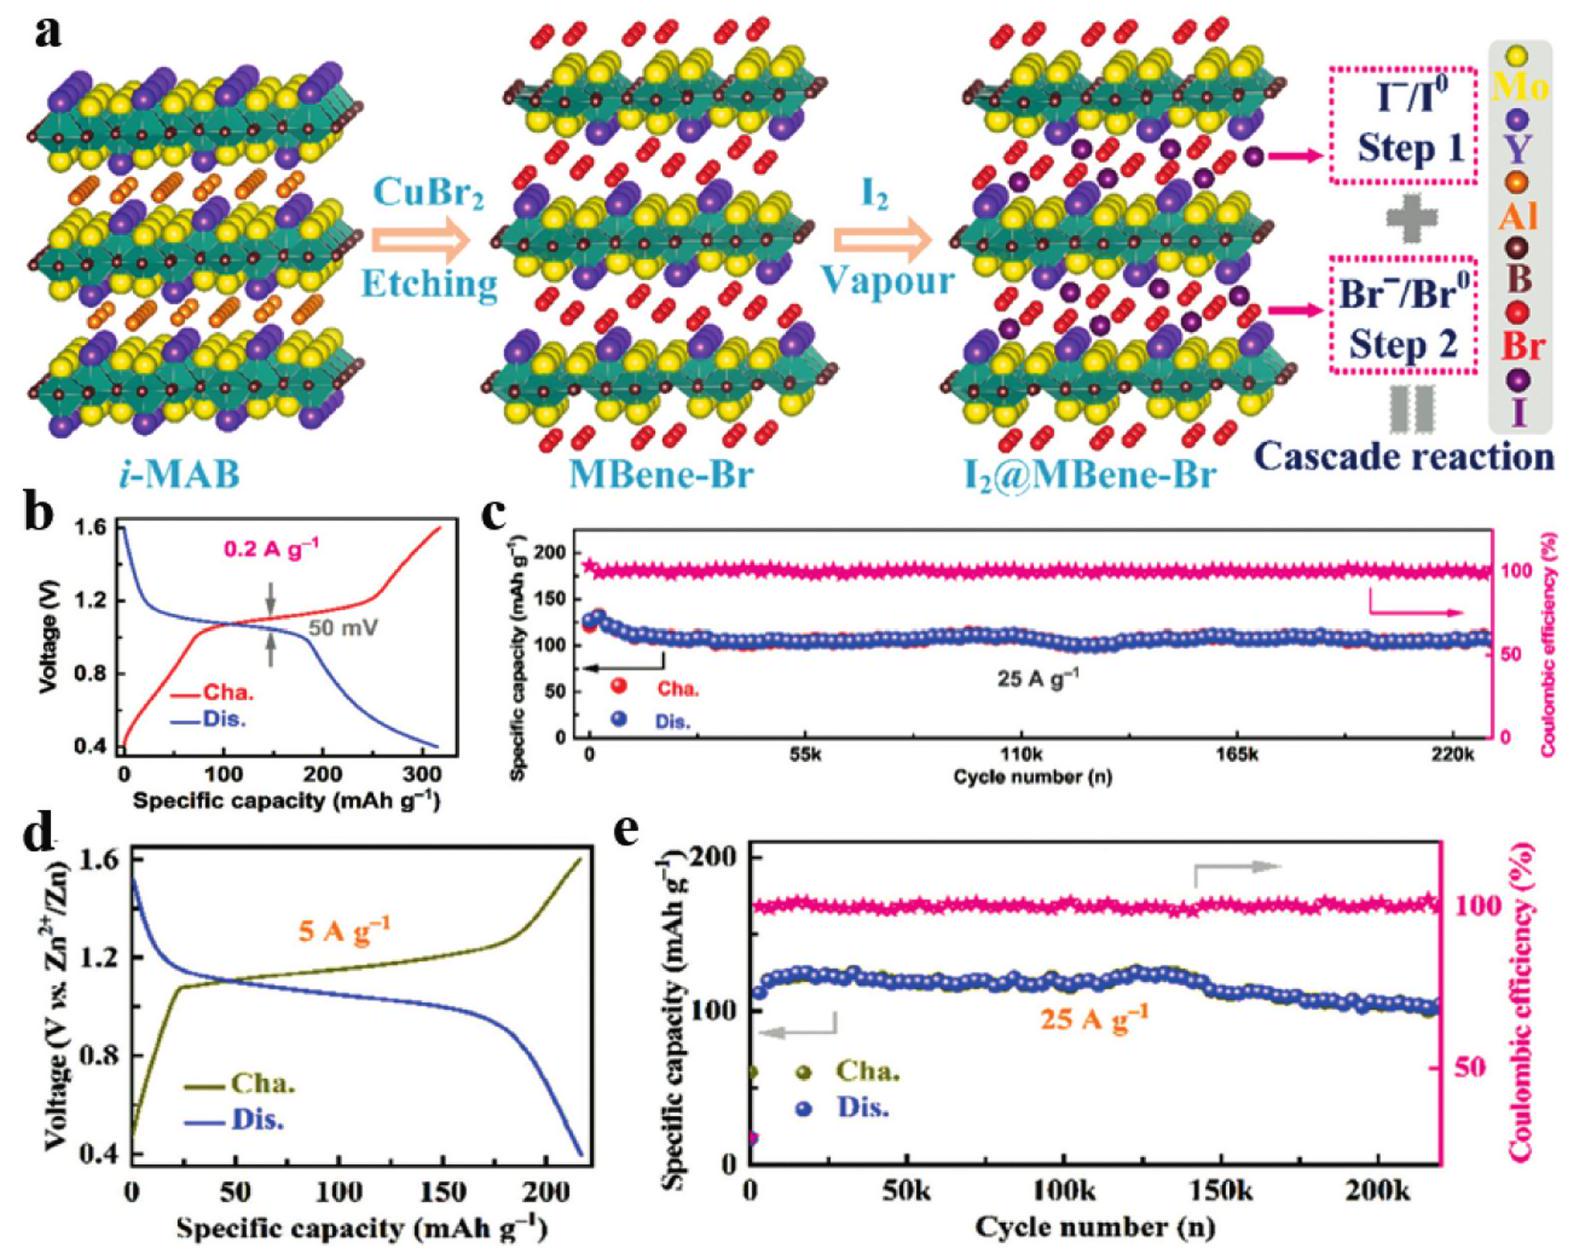
Fig. 7.
(a) Schematic illustration of the preparation of the
I
2
@MBene-Br
electrode and the cascade reaction. (b) The charge and discharge profile at
0.2Ag
-1
and (c) the long-cycle performance at
25Ag
-1
of
Zn-I
2
batteries. (d) The charge and discharge profile at
5Ag
-1
and (e) the cycling performance of the
I
2
@MBene-Br
electrode.
Reproduced with permission from Ref [
40
,
84
] Copyright 2024 Wiley.
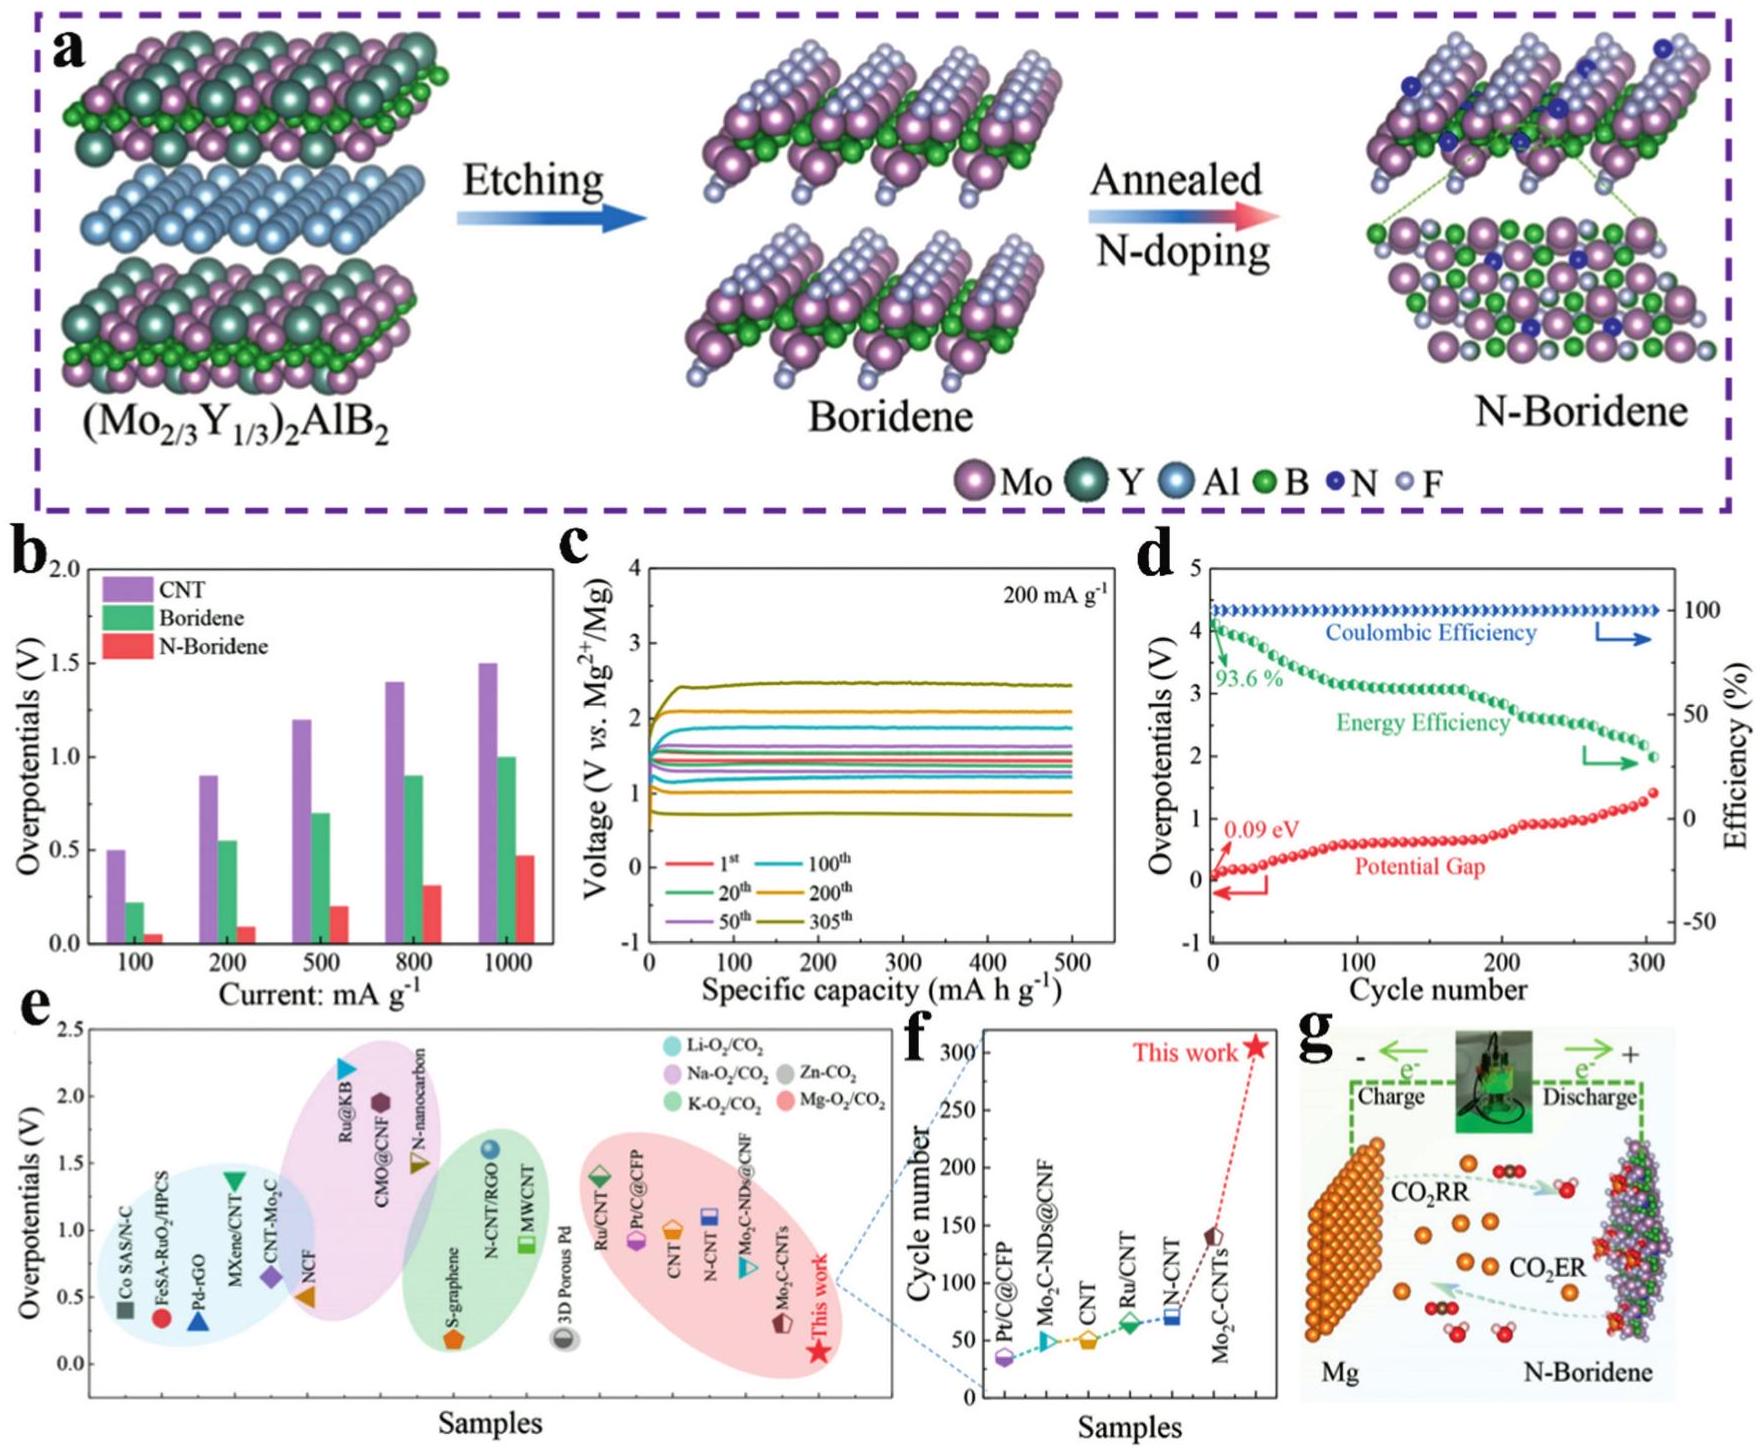
Fig. 8.
(a) Schematic illustration for the synthesis of N -boridene. (b) The initial-circle overpotentials for the three catalysts at different current densities. (c) The electrochemical performance of N -boridene batteries at a current density of
200mAhg
-1
with a discharge and charge depth of
500mAhg
-1
. (d) Overpotentials, Coulombic efficiency and energy efficiency during the 305 cycles. (e, f) Comparison of the overpotentials and cycle numbers between N-boridene batteries and reported work. (g) Photo figure of LED lighted by the N-boridene-based Mg-CO2 batteries.
Reproduced with permission from Ref. [
86
] Copyright 2024 American Chemical Society.
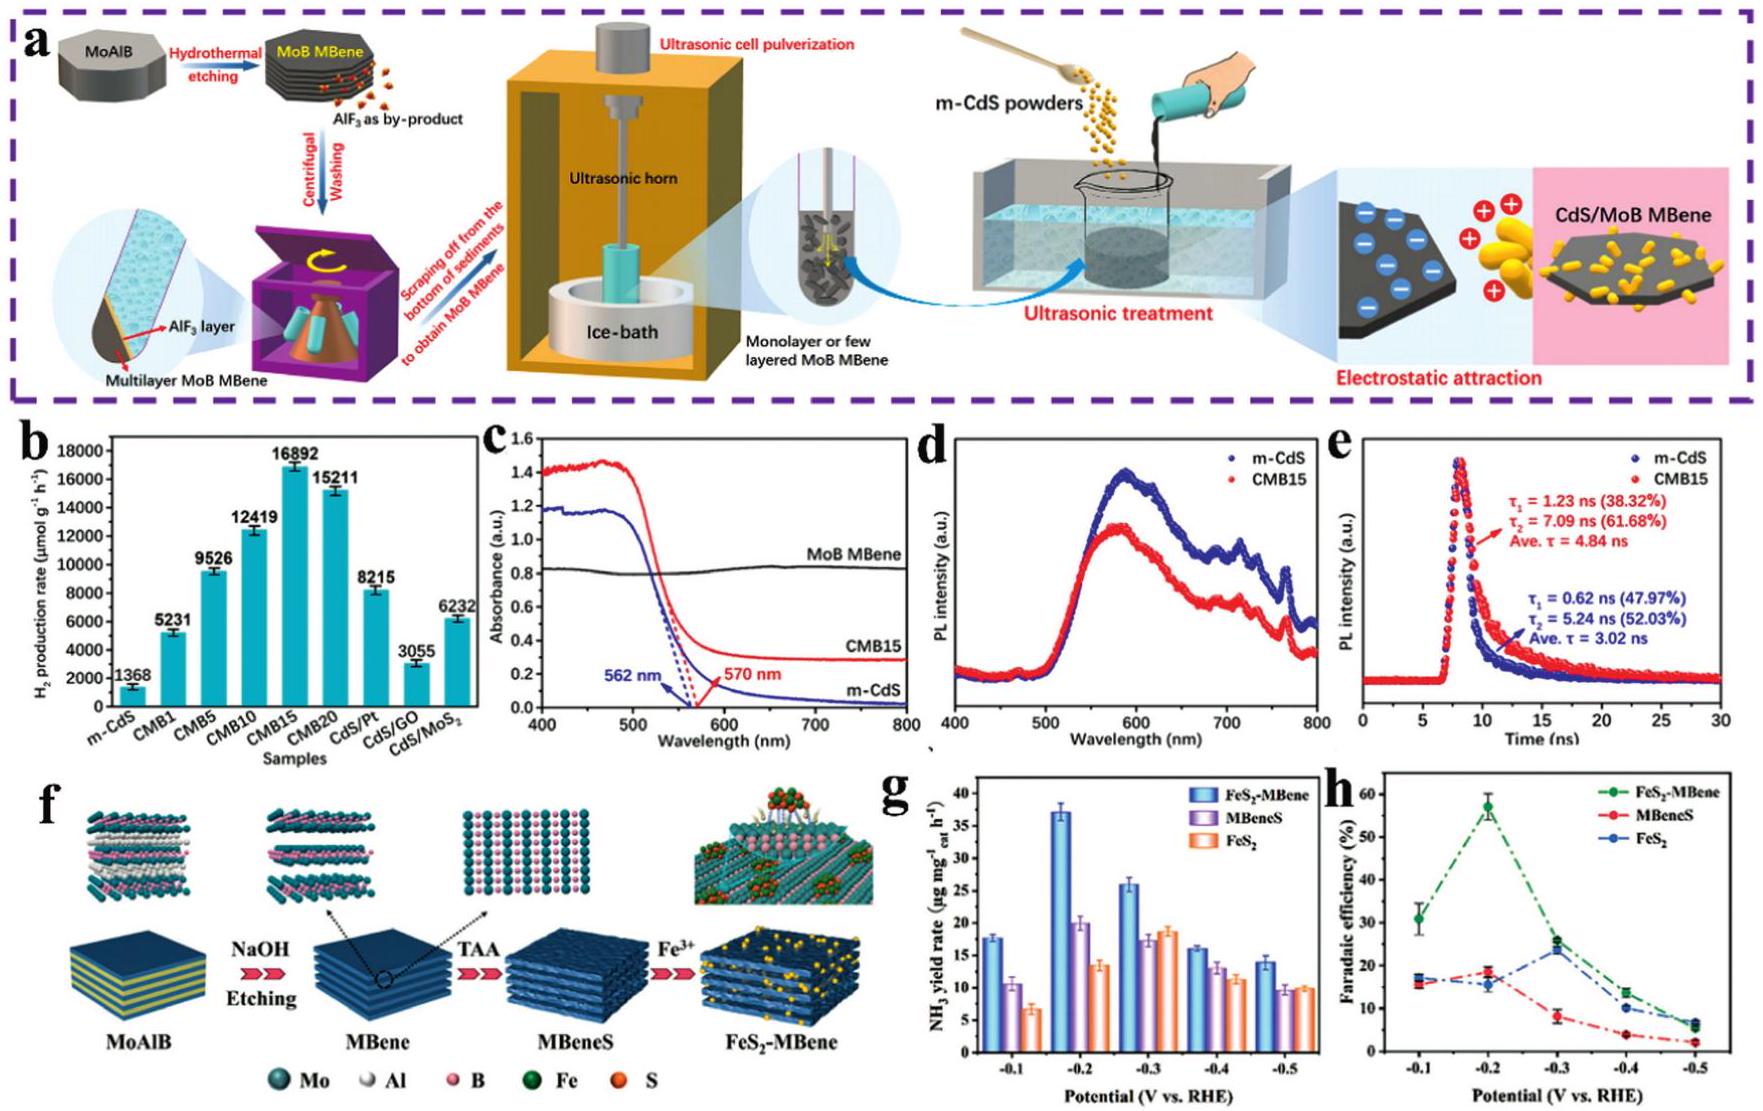
Fig. 9.
(a) Schematic procedure of the preparation of MoB MBene and the composite of CdS/MoB MBene. (b) The hydrogen production rate of CMBx, m-CdS, CdS/Pt, CdS/GO and CdS/MoS
2
. (c) Ultraviolet-visible diffuse reflectance spectra of m-CdS. (d) Steady-state and (e) time-resolved PL spectra of m-CdS and CMB15 in photocatalysis. (f) Synthetic illustration of
FeS
2
-MBene. (g) The yield rates of
NH
3
. (h) Faradaic efficiency of
FeS
2
, MBeneS and FeS2-MBene in electrochemical catalysis.
Reproduced with permission from Ref [
95
,
99
] Copyright 2024 American Chemical Society and 2024 Wiley.
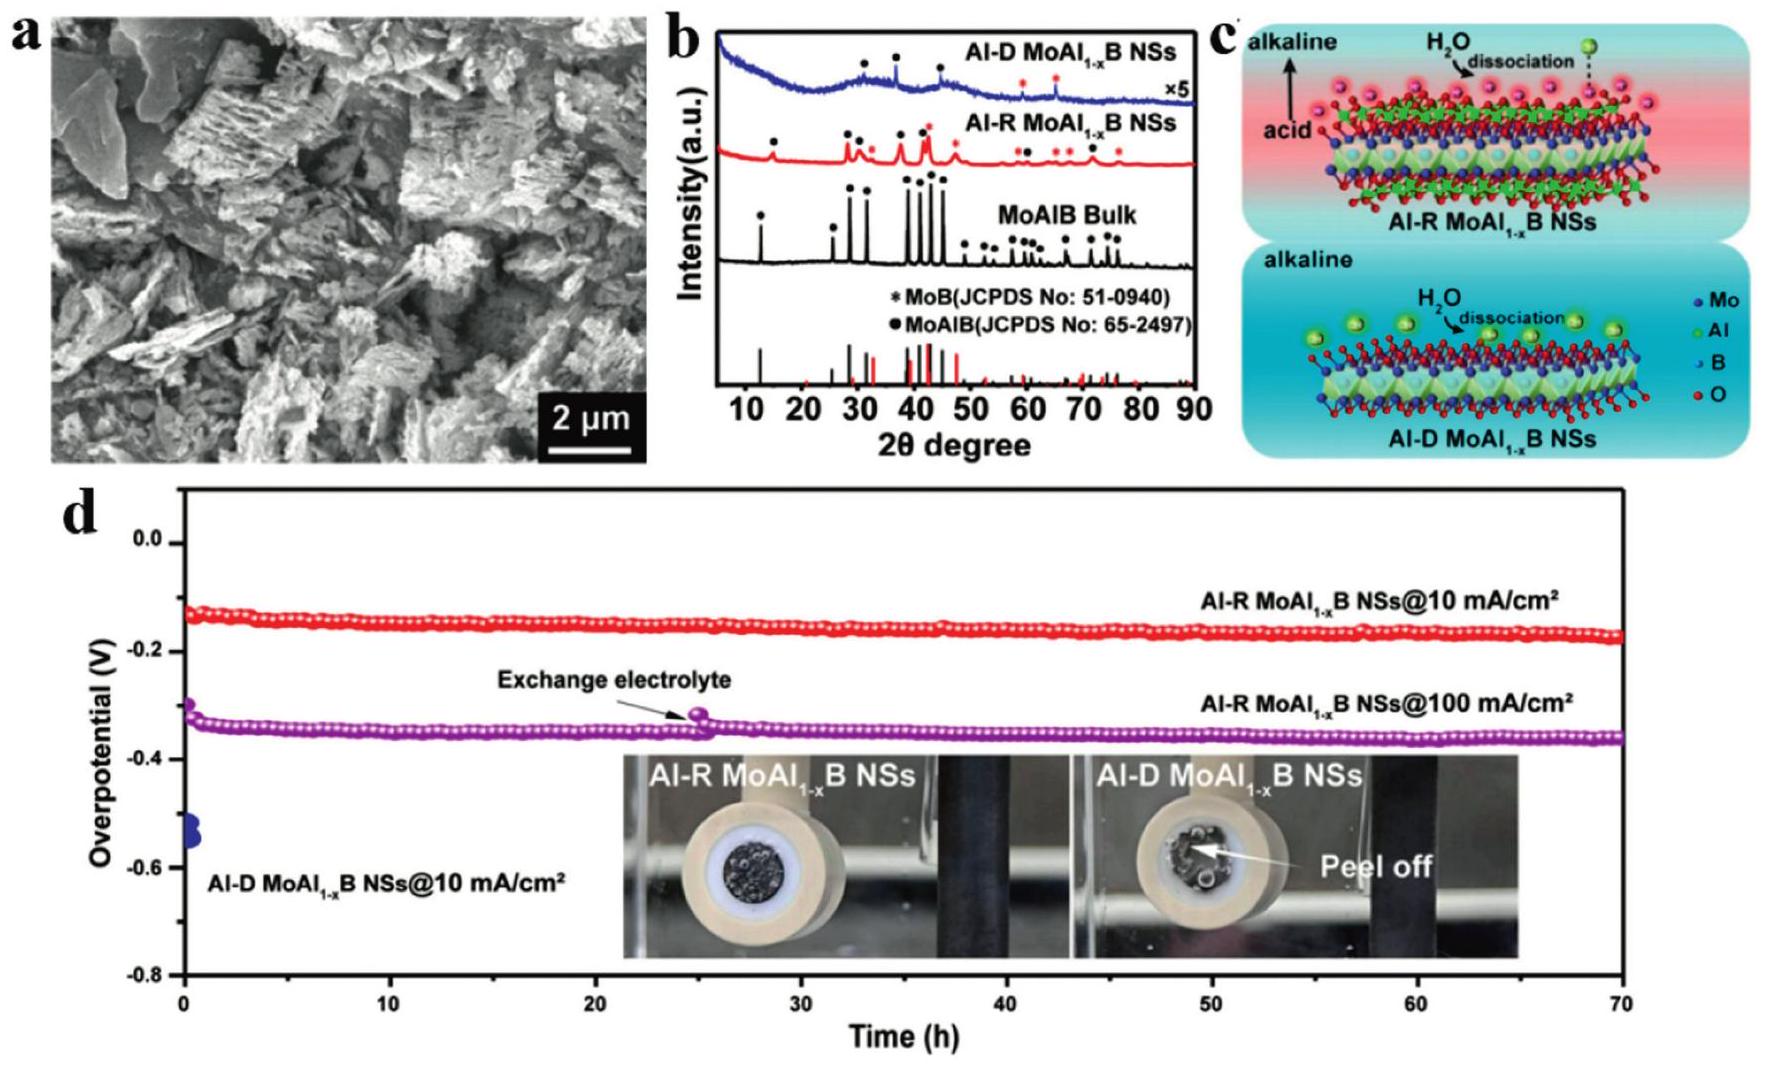
Fig. 10.
(a) SEM image of the Al-R
MoAl
1-x
B
, (b) XRD patterns of the etched samples of
Al-R
and
Al-DMoAl
1-x
B
, (c) schematic illustration of the microenvironment between Al-R and Al-D MoAl
1-x
B
samples, (d) chronopotentiometry test of
Al-RMoAl
1-x
B
recorded at the current densities of 10 and
100 mA cm
-2
, the inset image illustrates the hydrogen gas bubbles on the surface of
Al-R
and
Al-DMoAl
1-x
B
electrodes.
Reproduced with permission from Ref [
106
] Copyright 2025 American Chemical Society.
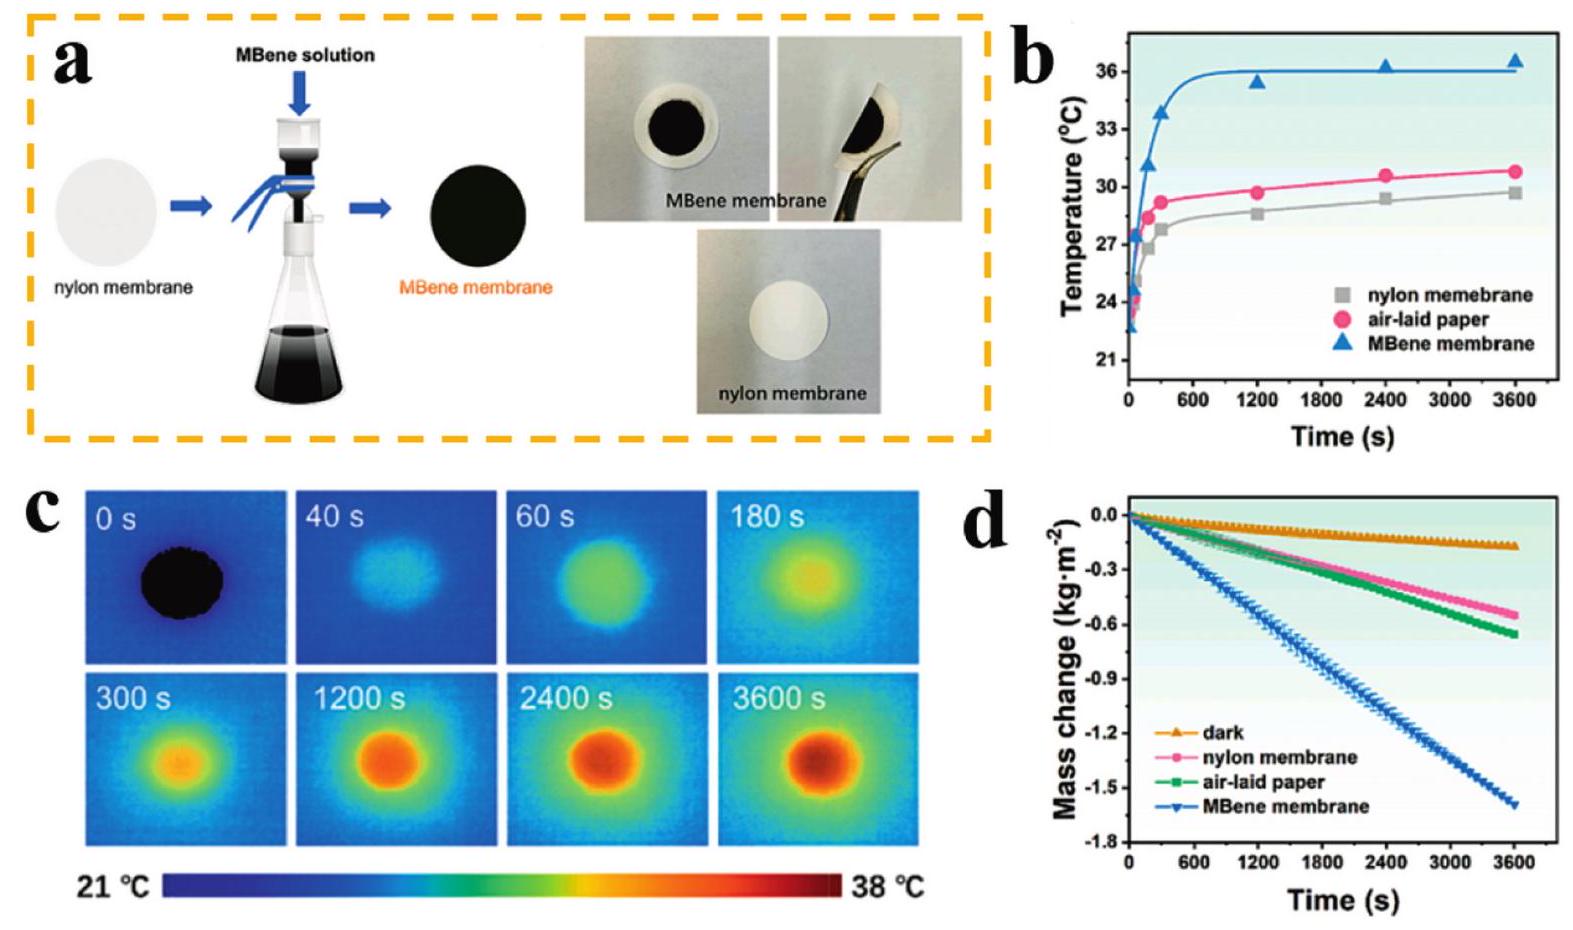
Fig. 11.
(a) Schematic illustration and photographs of MBene membrane and nylon membrane. (b) The temporal variation of the surface temperature, (c) Infrared thermal figures of MBene membrane, (d) The temporal variation of water mass change of the three evaporation models under 1 sun irradiation.
Reproduced with permission from Ref. [
107
] Copyright 2024 Elsevier.
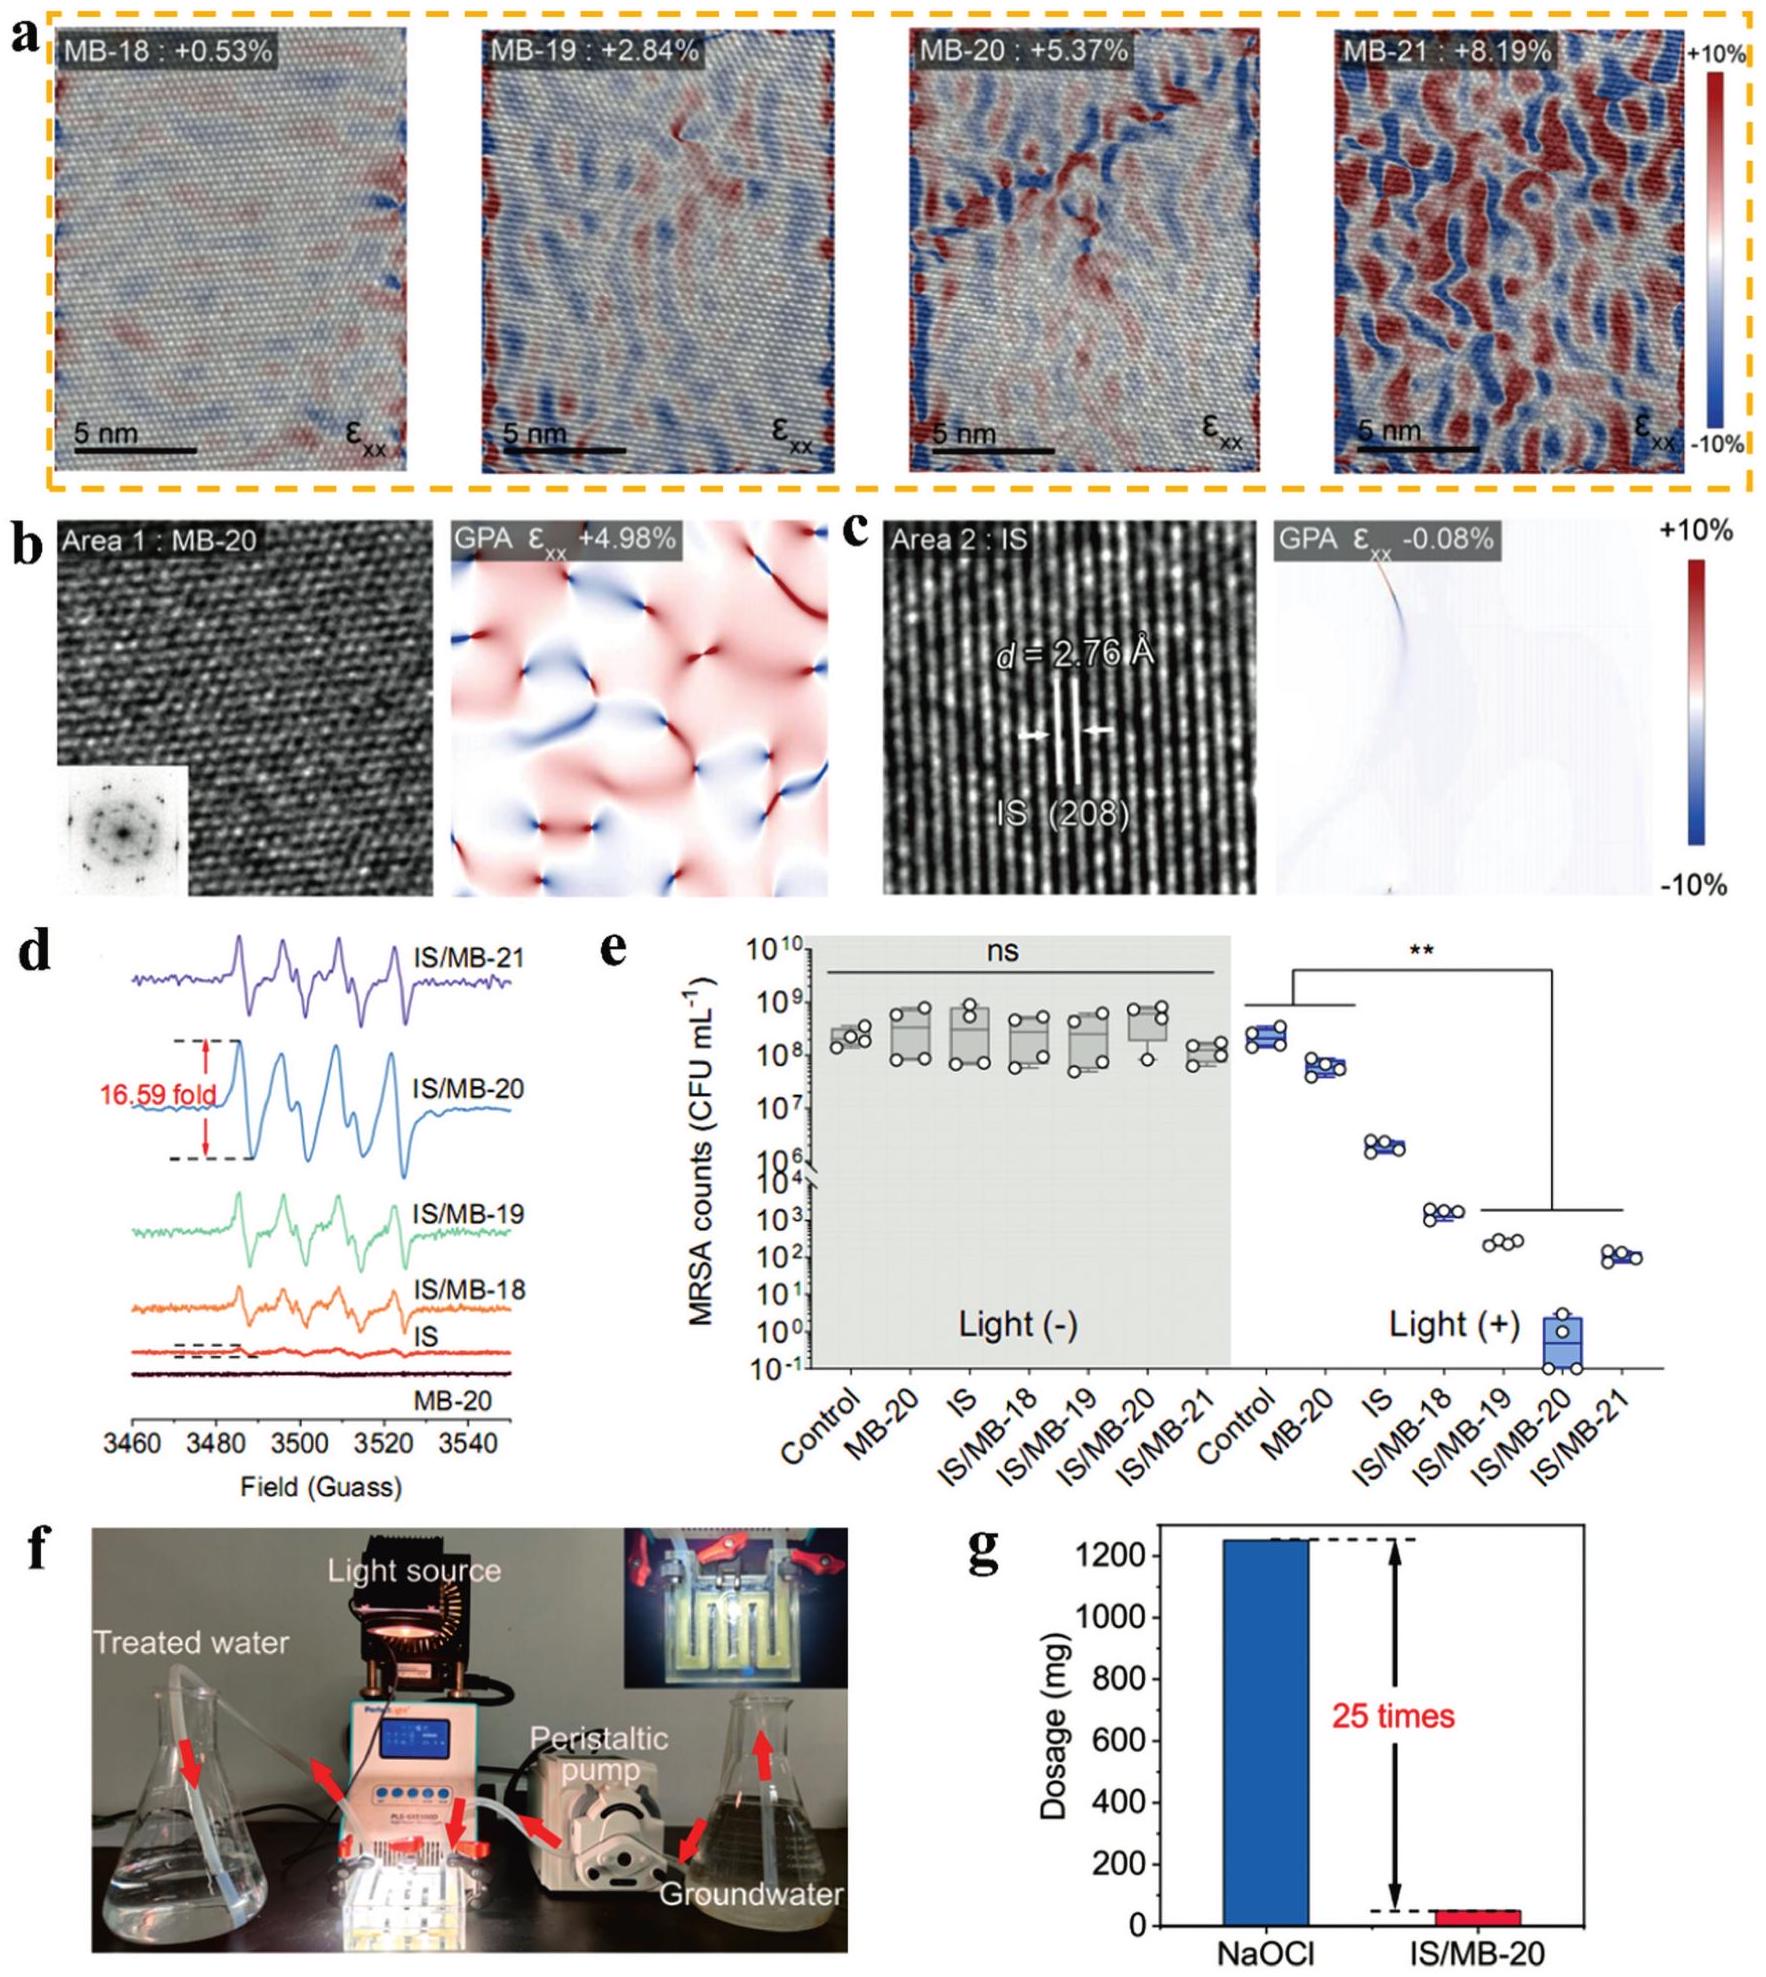
Fig. 12.
(a) AC-STEM and GPA images of
Mo
4/3
B
2-x
T
z
MBene (MB) etched by HF at different time (18-21 h) (b) and (c) HRTEM images and corresponding strain mapping images based on GPA of MB-20 and IS. (d) In-situ EPR spectra of
O
2
-
generated by different samples in low dissolved oxygen condition under visible light irradiation. (e) Quantitative analysis of antibacterial effect (MRSA) at visible light irradiation. (f) The digital image of the continuous flow photocatalytic disinfection device. (g) The dosage of NaClO and IS/MB-20 for producing 37.2 L of clean water.
Reproduced with permission from Ref. [
115
] Copyright 2025 Springer Nature.
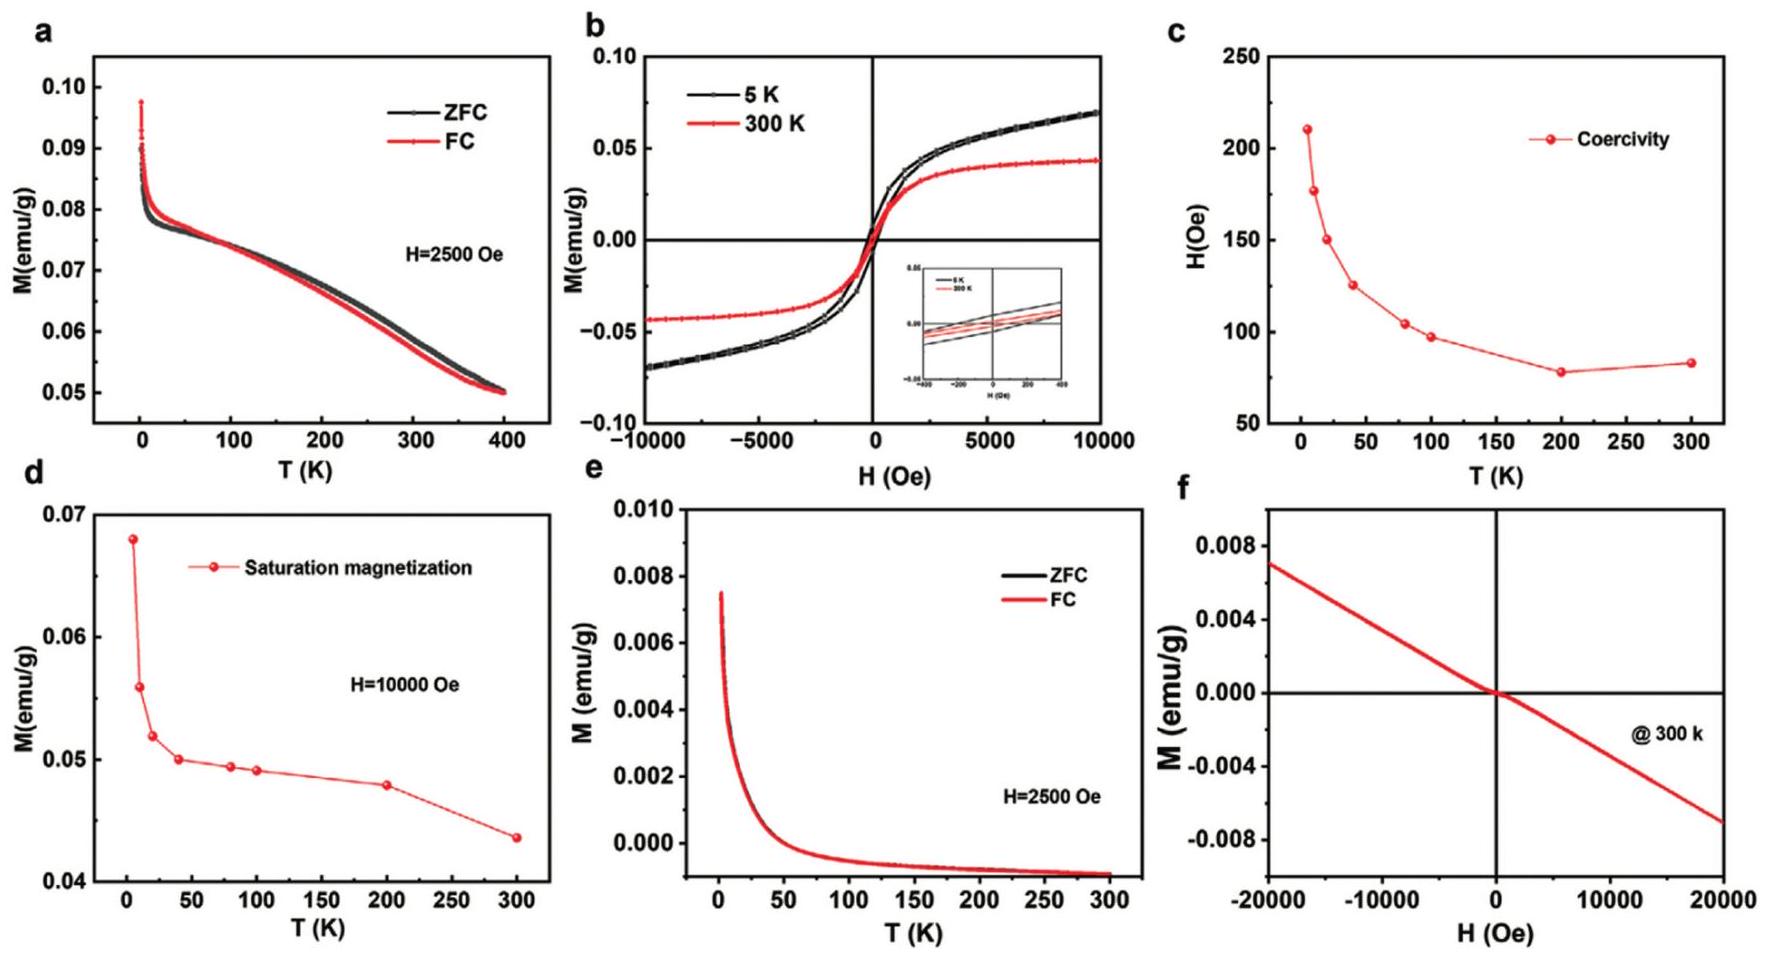
Fig. 13.
(a,e) ZFC and FC magnetization plots of
Mo
4/3
B
2
nanosheets and pristine MoB characterized under external field of 2500 Oe at different temperature, respectively. (b,f) Magnetization loops of
Mo
4/3
B
2
at 5 and 300 K and MoB MBene at 300 K, respectively. (The enlarged view of the hysteresis loop in the inset). (c) Coercivity of
Mo
4/3
B
2
at different temperatures. (d) Saturation magnetization plot of
Mo
4/3
B
2
.
Reproduced with permission from Ref. [
130
] Copyright 2025 Wiley.