

1. Introduction
Carbon-based composites, including C/C composites and graphite, possess the characteristics of light-weight, high-strength, and high-temperature resistance, which demonstrate critical significance in the aerospace sector [1,2]. These materials exhibit several exceptional properties, including low density, high strength, excellent thermal and chemical stability, and superior retention of mechanical properties at elevated temperatures [3,4]. When integrated into aerospace components, carbon-based composites enable critical weight reduction, increased operational temperature, reduced cooling requirements, and enhanced engine efficiency, making them indispensable candidates for applications in extreme high-temperature environments. However, the carbon-based composites are highly susceptible to be oxidized in various environments containing oxygen at temperatures above 400∘C, which significantly impedes their applications in advanced aerospace equipment [5]. It has come to light that enhancing the oxidation resistance of carbon-based composites through silicon-based coatings is considered the most effective approach for achieving oxidation protection, thereby facilitating the application of the advanced materials in extreme aerospace conditions [6,7].
With the intensification of global competition in the aerospace industry, the strategic applications of carbon-based composites are facing increasingly stringent demands. The service environment imposes progressively rigorous standards on the performance of surface coatings in terms of oxidation resistance, high-temperature durability, erosion resistance, and service life [8]. Among various coating materials, ultra-high temperature ceramic (UHTC) borides (including ZrB2, HfB2,TaB2 ) and so on, have attracted significant attention, attributing to the high melting points (>3000∘C ), excellent mechanical properties, and enhanced oxidation resistance. These borides ceramics have been extensively employed to modify silicon-based coatings, demonstrating significant potential for high-temperature aerospace applications [9,10].
However, boride-silicon coatings are prone to develop critical defects such as spallation, oxidation-induced pores, and penetrating cracks when exposed to severe environments, including ultra-high temperatures, alternating high and low temperatures, and high-speed gas erosion at elevated temperatures. These defects significantly compromise the capability of the coatings to provide long-term, high-stability protection for carbon-based composites [11]. The primary challenges contributing to the above limitation are twofold: a) The high-content boride-silicon composite coatings used for broad-temperature-range protection of carbon-based materials face significant difficulties in achieving strong interfacial bonding and densified growth. Additionally, the oxidation-induced consumption of the carbon matrix leads to a "distortion" in the oxidation resistance characteristics of the coating, thereby impeding the precise compositional design and the sophisticated development of oxygen-blocking structures; b) The progressive evolution of oxidation-induced degradation during service disrupts the dynamic and high stability of the coating in oxidation protection performance. The development of highly stable boride-silicon coatings capable of withstanding extreme environments across broad temperature ranges remains urgent to accelerate the implementation of carbon-based composites in advanced aerospace systems.
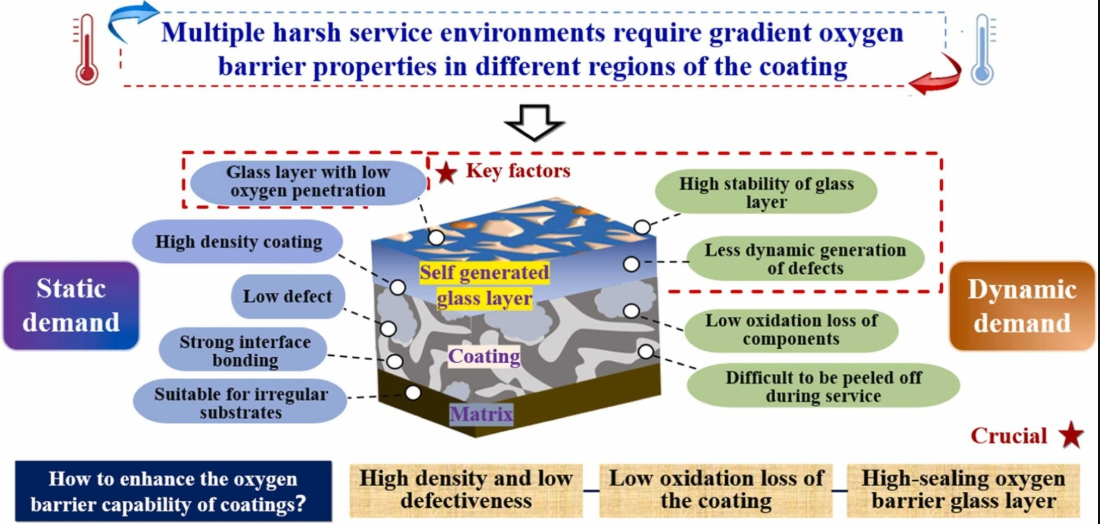
It is widely recognized that the oxidation-resistant coating on the surface of carbon-based composites functions as an oxygen-blocking barrier, preventing the diffusion of oxygen and corrosion of the carbon matrix. The protective effectiveness of the coating is primarily derived from the coating itself and the oxidation-induced self-generated glass layer [12]. Fig. 1 illustrates the concept of gradient high oxygen blocking in UHTC coatings [13]. Under multiple complex and severe service conditions, including ultra-high temperature, scouring, thermal shock, and ablation, the coating requires gradient oxygen-blocking properties across different regions. These properties are essential to meet both static and dynamic demands. For instance, the coating necessitates multiple static requirements, including high density, minimal defects, strong interfacial bonding, compatibility with dissimilar substrates, and low oxygen permeability of the oxidation glass layer. On the other hand, additional dynamic requirements involve low oxygen consumption of the components, resistance to coating spalling during service, high stability of the glass layer, and minimal dynamic defects while maintaining structural integrity. To enhance the static and dynamic stability under complex service environments while improving the high oxygen-blocking performance of the coating, the coating is required to possess characteristics including high density, low defect levels, and minimal oxidation-induced loss. Furthermore, the oxidation-resistant coating should generate a self-healing glass layer featuring low oxygen permeability and high stability to provide long-term oxidation protection. The development of coating systems and preparation technologies faces significant challenges, such as fabricating high-oxygen blocking coatings for irregularly shaped carbon substrates, achieving strong bonding growth of ultra-high temperature coating components on the carbon matrix, and ensuring effective oxidation resistance across broad temperature ranges [14]. Additionally, the conflicting oxidation behaviors between mass loss of carbon matrix and mass gain of ceramic coating oxidation complicate the analysis of oxidation behavior of the coating, making it difficult to accurately evaluate the ability of the coating to inhibit oxidation of carbon matrix [15]. The interference caused by the oxidation mass loss of carbon matrix limits the precise analysis of oxygen-blocking behavior and the sophisticated development of oxygen-blocking structures. Consequently, such limitation significantly impedes progress in the refined design of boride-silicon coatings. To respond to these technical challenges and the analytical limitations in current literature, this review not only provides a systematic summary of coating systems, structures, and preparation technologies, but also emphasizes several distinctive mechanisms that have received limited discussion in previous reviews. Specifically, we highlight the active role of self-generated glassy phases in oxidation protection, offering a design-oriented understanding from the perspectives of compositional tailoring, structural evolution, and sealing/self-healing dynamics. Furthermore, the concept of micro-zone self-healing is introduced to elucidate localized interactions between flowing glass phases and ceramic matrices during high-temperature exposure, which enriches the mesoscopic understanding of damage tolerance. A relative evaluation system for high oxygen resistance is also included to enable quantitative differentiation of structural oxygen-blocking capacity and glass-phase inert sealing, thus providing a more accurate assessment method for advanced coating design. These perspectives collectively differentiate this work from conventional summaries and offer valuable guidance for future material screening and system-level optimization.
Fig. 1. Gradient high oxygen barrier concept of UHTC coatings. Reproduced with permission from Ref. [13], © Elsevier 2024. |
In this review, a comprehensive analysis is presented on recent research advances in the preparation of ultra-high temperature boride silicon composite coatings on carbon-based composites. The structure of this review is organized as follows:
Section 2 examines coating structures, encompassing single-layer, double-layer, gradient, and nano-toughened coatings. Section 3 elaborates on the various coating fabrication techniques, including pack cementation, brushing, spraying, in-situ reactions, and spark plasma sintering. Section 4 discusses the current ultra-high temperature coating systems, which comprise single-component boride composite coatings, multi-component boride composite coatings, silicide-modified composite coatings, and rare-earth-modified composite coatings. Section 5 explores the design of oxidation glass films, categorized into three types: single transition metal modified silicon-based glass films, dual transition metal modified silicon-based glass films, and silicon-based glass films synergistically modified by transition metals and rare-earth elements. Section 6 reviews coating treatment processes developed in recent years, including chemical vapor deposition/impregnation, pre-oxidation, and micro-area repair techniques. Section 7 presents the evaluation methods for the oxygen-blocking performance of coatings, covering static oxidation evaluation, dynamic oxidation evaluation, and high-oxygen barrier evaluation. Section 8 addresses the existing challenges in coating technology, the future obstacles, and potential solutions to advance the development of highly stable and efficient coating systems.
2. Coating structures
Oxidation-resistant coatings represent an important barrier to ensuring the sustained service performance of carbon-based composites in high-temperature environments. The structural design of these coatings determines their oxygen-blocking capabilities and significantly influences their thermal stability and durability. However, under extreme service conditions, these coatings are expected to withstand both high-temperature oxidation and the accumulation of interfacial stresses while confronting failure mechanisms such as crack propagation, which leads to a reduced interfacial stability and a shortened service life [16]. Consequently, optimizing coating structures to enhance oxidation stability, interfacial bonding strength, and crack propagation resistance, has emerged as a fundamental challenge in this research field. In recent years, extensive studies have been conducted to investigate the multi-scale structural optimization strategies for coatings, aiming to improve their long-term stability and adaptability to harsh environmental conditions [17].
2.1. Single-layer coatings
The single-step preparation of UHTC coatings on the surface of carbon-based composites offers dual advantages, including simplifying the fabrication process along with facilitating industrial production while enabling systematic coating design and component selection [18]. As a result, extensive research has been conducted globally to explore the relationships between the preparation processes, composition design, service environments, and the performance variations of coatings fabricated via a single-step process for carbon-based composites [19]. Patra et al. [20] developed well-adhered single-layer ZrB2 coatings using a precursor pyrolysis technique, which demonstrated a reduction in mass loss from 0.17% to 0.12% at 1500∘C compared to unprotected samples, highlighting improved oxidation resistance. Huang et al. [21] applied laser cladding to fabricate ZrB2-ZrC-SiC coatings on C/C composites and evaluated their performance under oxidation and ablation environments. The coatings exhibited a mass gain of only 0.51 g/cm2 during oxidation at 1600∘C for 40 min, while demonstrating an approximate 75% reduction in mass ablation rate under oxy-acetylene ablation at 2400 kW/m2 thermal flux for 300 s. Zhang et al. [22] investigated SiC coatings prepared through embedding and infiltration techniques, examining the influence of process parameters on performance. At an optimized Si/C weight ratio of 6:0.5, the coating provided oxidation protection for the C/C composites for 100 h at 1500∘C, with a minimal mass gain of 7.75 g/cm2. The surface and cross-sectional microstructural morphology after oxidation is presented in Fig. 2. Wang et al. [23] employed an in-situ synthesis method to prepare B4C-modified HfB2-SiC coatings on C/C composites and evaluated their oxidation resistance at 800∘C,1000∘C and 1200∘C respectively. The HfB2-SiC-B4C coatings demonstrated superior oxidation protection at 1200∘C and exhibited only 5.45% mass loss after 104 h of oxidation, representing an over 20% improvement compared to unmodified coatings. Niu et al. [24] utilized low-pressure plasma spraying (LPPS) technology to fabricate ZrB2-based composite coatings with varying MoSi2 content (i.e., 20vol\% and 40vol\% ), studying their oxidation behavior at 1200∘C and 1500∘C. The results indicated that the thickness of the oxidation layer decreased with increasing MoSi2 content at both temperatures, demonstrating enhanced oxidation resistance through MoSi2 addition. Ren et al. [25] examined the effect of ZrB2 content on the oxidation resistance of ZrB2-SiC coatings across a broad temperature range, from room temperature to 1500∘C, using li-quid-phase sintering. As the ZrB2 content increased from 20wt\% to 80wt\%, the mass change of the samples shifted from a weight loss of 10.04% to a weight gain of 0.14%. Additionally, the relative oxygen permeability decreased from 40%-60% to -10%-5%, demonstrating significantly enhanced oxidation resistance across the temperature range.
In summary, the single-layer coating system has significant advantages in process simplification, which achieved good protective effects in different oxidation environments. From an economic perspective, it shows great potential to improve the oxidation resistance of carbon-based composites coatings. However, the thermal shock resistance and adaptability to complex oxidation environments of single-layer coatings still need further research.
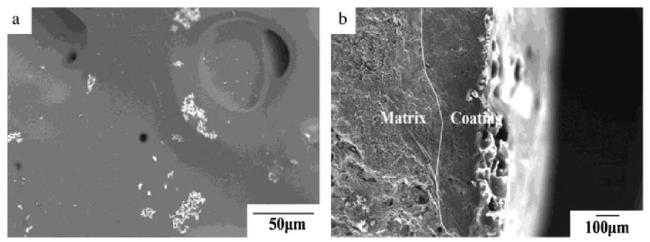
Fig. 2. SEM images of SiC coatings with a Si/C weight ratio of 6:0.5 after 100 h of oxidation in air at 1500∘C : (a) surface; (b) cross-section. Reproduced with permission from Ref. [22], © Elsevier 2015. |
2.2. Double-layer coatings
The significant thermal expansion coefficient mismatch between ultra-high-temperature ceramic coating components (e.g., borides, carbides, silicides) and C/C composites caused thermal mismatch-induced cracking during service, which have prompted researchers to address the degradation of oxidation resistance [26]. To mitigate this issue, one effective approach involves introducing an inner transition layer on the surface of C/C composite to enhance compatibility between UHTC coatings and carbon-based matrices [27]. Li et al. [28] fabricated a ZrB2-rich compact transition layer on C/C composites via slurry painting followed by heating carbonization, serving as an effective barrier to prevent silicon penetration during the subsequent formation of SiC-Si composite coatings by pack cementation. The resulting coated C/C sample exhibited markedly improved performance, achieving 93.4% bending strength retention and only 0.09% mass loss after 50 thermal cycles between room temperature and 1773 K. These improvements were attributed to the suppression of siliconization corrosion and the formation of oxidation-resistant ZrO2 and ZrSiO4 phases. Li et al. [29] prepared ZrB2-CrSi2-SiC-Si/SiC double-layer coating on C/C composites using a two-step embedding and infiltration process, achieving 1.74% mass loss and 79.0% residual bending strength after 30 thermal cycles between room temperature and 1500∘C. Wang et al. [30] synthesized HfB2-SiC/SiC coatings through in-situ reaction at 1900∘C and 2100∘C. The coatings exhibited minimal weight loss of 0.487% after 753 h of static oxidation at 1500∘C and only 0.78% mass loss following 40 thermal cycles between room temperature and 1500∘C. Wang et al. [31] incorporated ferrocene into ZrB2-SiC outer coatings on SiC inner-coated C/C composites, which effectively relieved thermal shock stresses, and improved thermal shock resistance. Zhang et al. [32] prepared HfB2-SiC-MoSi2-Si/SiC-Si double-layer coatings on C/C composites with varying geometries using a combination of embedding and infiltration, slurry impregnation, and gas-phase silicon infiltration. The coating demonstrated a 57.9% reduction in mass loss after oxidation at 1650∘C for 618 h. In our previous work [33], we utilized an in-situ reaction method to develop an HfB2-SiC outer coating on a SiC inner coating (as shown in Fig. 3). These coatings provided oxidation protection for C/C matrix at 1500∘C for up to 265 h with minimal loss of 0.41×10⁻² g/cm2.
In summary, the double-layer coating has improved the physical and chemical compatibility between the coating and the substrate through transition layer design and multi-component synergistic strengthening strategy, effectively alleviated thermal stress, reduced substrate damage, and demonstrated significant advantages in the field of high-temperature protection of carbon-based composite materials. However, further research is needed on the long-term stability, multi field coupling failure mechanism, and adaptability to complex working conditions of the double-layer coating.
2.3. Gradient coatings
While incorporating an inner transition layer on the surface of carbon-based composites effectively improve oxidation resistance in dynamic environments, researchers have advanced toward gradient coating designs. Due to variations in oxygen partial pressure, thermal gradients, and oxidation modes from outer to inner coating layers, gradient coating approach aims to meet demanding oxidation protection requirements for C/C composites in severe service environments [34]. A critical design challenge for gradient coatings lies in ensuring strong bonding between different layers, where physical and chemical properties of each layer should be compatible between adjacent layers to maintain overall performance of the coating [35]. Wang et al. [36] employed supersonic plasma spraying to fabricate a gradient SiC-ZrB2-MoSi2 (SZM) coating on C/C composites (as shown in Fig. 4). The gradient structure effectively alleviated the interfacial stresses between the MoSi2 coating and the inner silicon carbide layer. Specifically, the residual tensile stress of the SZM gradient coating was 48.5 MPa, compared to 490.8 MPa for a single-layer MoSi2 coating. Zou et al. [37] designed a ${\mathrm{Z}\mathrm{r}\mathrm{B}}_{2}-\mathrm{S}\mathrm{i}\mathrm{C}-\mathrm{S}\mathrm{i}/{\mathrm{Y}\mathrm{b}}_{2}{\mathrm{S}\mathrm{i}\mathrm{O}}_{5}/{\mathrm{L}\mathrm{a}\mathrm{M}\mathrm{g}\mathrm{A}\mathrm{l}}_{11}{\mathrm{O}}_{19}$ (ZSS/YSO/LMA) gradient coating and investigated its oxidation protection behavior using a gas flame thermal cycling test at approximately 2000∘C. The ZSS/YSO/ LMA gradient coating exhibited significantly enhanced thermal stability and oxidation resistance compared to the YSO/LMA coating, with mass loss rate decreasing from 4.8% to 0.3% after 10 cycles at 2000∘C. Yang et al. [38] developed a $\mathrm{S}\mathrm{i}\mathrm{C}/{\mathrm{S}\mathrm{i}}^{-}{\mathrm{Z}\mathrm{r}\mathrm{S}\mathrm{i}}_{2}-{\mathrm{Z}\mathrm{r}\mathrm{B}}_{2}-{\mathrm{H}\mathrm{f}\mathrm{B}}_{2}/\mathrm{S}\mathrm{i}\mathrm{C}$ gradient coating, exhibiting excellent oxidation resistance due to the dense structure of the middle self-healing layer and the synergistic effects among the three layers. After oxidation at 1100∘C for 210 h,1200∘C for 165 h, and 1300∘C for 120 h, the weight loss of the composite coating was 0.76%, 0.84% and 1.25%, respectively.
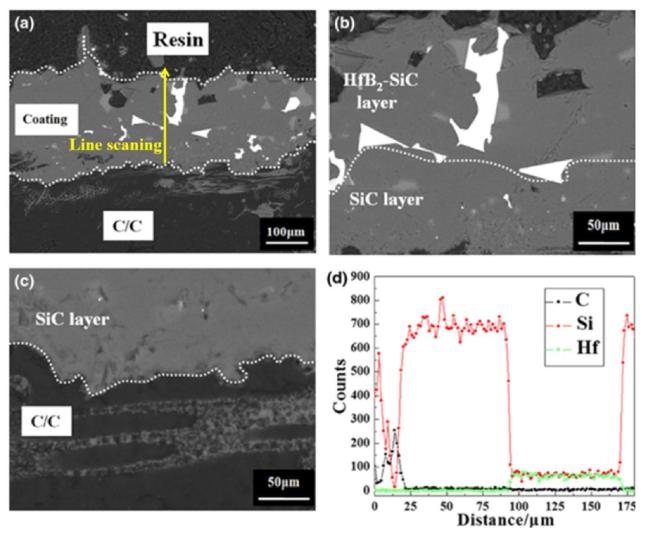
Fig. 3. (a) Backscattering cross-section micrographs of coated C/C composites; High-magnification backscattered electron micrograph of the (b) coating and (c) interface between the C/C composite and the internal SiC layer; (d) Energy dispersive spectroscopy elemental line analysis of the coating in (a), with the yellow arrow representing the scanning direction. Reproduced with permission from Ref. [33], © Wiley-Blackwell 2014. |
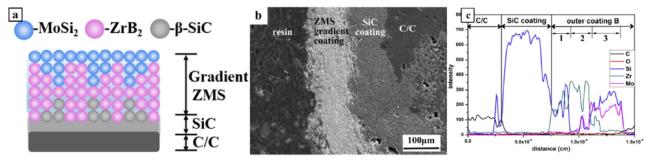
Fig. 4. (a) Schematic diagram of the sprayed gradient SZM coating on SiC-coated C/C composites, (b) cross-sectional morphology, and (c) elemental line scan. Reproduced with permission from Ref. [36], © Elsevier 2017. |
In conclusion, the core advantage of the gradient coatings lies in their multi-layer collaborative design, which not only alleviates interface stress but also enhances the thermal gradient adaptability of materials. However, the interlayer compatibility optimization, process refinement and coating reconstruction behavior of gradient coatings in ultra-high temperature environments still need further research.
2.4. Nano toughened coating
UHTC coatings often develop inevitable defects and cracks during service attributed to their inherent brittleness, allowing oxygen penetration and subsequent carbon matrix oxidation, which accelerates the degradation of carbon-based composites. To address such challenges, researchers have attempted to incorporate nanomaterials (such as nanoparticles, nanowires, and whiskers) into the coatings to improve the toughness of the ceramic materials, facilitate stress distribution, and mitigate crack propagation [39,40]. Chu et al. [41] employed chemical vapor deposition and embedding techniques to prepare bamboo-like SiC nanowire-toughened silicon carbide coatings, with the morphology of the bamboo-like SiC nanowires shown in Fig. 5. The incorporation of bamboo-like SiC nanowires reduced the microcrack density of the coatings by 84.04%, achieving minimal mass loss of 0.5% after 72 h of isothermal oxidation at 1500∘C. Yan et al. [42] fabricated a ZrB2-SiC/ SiC double-layer coating on a C/CA matrix using low-temperature reaction sintering, featuring in-situ SiC@SiO2 nanowires in the ZrB2-SiC outer layer (as shown in Fig. 6). The coating exhibited excellent fracture toughness (4.36MPam1/2 ) and demonstrated a low linear ablation rate of 0.1μ m/s after 1500 s of cyclic ablation at 1650∘C. Xie et al. [43] coated an in-situ grown SiC-SiC w layer on a C/C matrix as a transition layer to provide thermal stress buffering and bonding, preventing cracking and delamination of the coating. The resulting SiC-SiC w/ZrB2-ZrSiO4-aluminosilicate glass three-layer gradient coating exhibited superior high-temperature oxidation resistance, with a mass gain of 120.17 g/m2 after 20 h of oxidation at 1500∘C. Fu et al. [44] integrated SiC nanowires grown by chemical vapor deposition with a SiC-MoSi2-ZrB2 coating prepared through embedding and infiltration. Compared to the conventional SiC-MoSi2-ZrB2 coating prepared by direct methods, the nanowire-toughened transition layer exhibited reduced coefficient of thermal expansion (CTE) between 900∘C and 1600∘C, with minimal mass loss of 1.1mg/cm2 after 124 h at 1500∘C. Xu et al. [45] synthesized a ZrB2-SiCw-borosilicate glass /ZrB2-MoSi2-SiCw-borosilicate glass double-layer coating through rapid sintering under micro-oxygen conditions. The combination of matched thermal expansion coefficients and SiCw toughening resulted in excellent oxidation resistance, with only 0.44% mass loss after 100 min at 1500∘C. Wang et al. [46] investigated the effect of SiCw toughening on the oxidation resistance and thermal shock resistance of HfB2-SiC-Si/SiC coatings. Compared to coatings without SiCw toughening, the enhanced coatings demonstrated significantly improved performance, with mass loss decreasing from 4.88% to 0.88% after 468 h at 1500∘C. The superior oxidation resistance improvements were attributed to SiCw, alleviating CTE mismatch and suppressing crack propagation through pull-out and bridging mechanisms (as shown in Fig. 7). To address the impact of high-temperature-induced phase transformations on the toughening effect of SiC whiskers, Zhuang et al. [47] deposited pyrolytic carbon (PyC) on SiC whiskers using chemical vapor deposition to form SiC@PyC nanowires. The PyC coating protected nanowires from phase transformation up to 2100∘C, enhancing the interfacial bonding between TaB2-SiC coatings and C/C composites. After 20 thermal cycles between room temperature and 1600∘C, the average mass loss was only 2.1%.
Coatings toughened with nano phase have achieved crack suppression and toughness enhancement, thermal stress coordination, and improved dynamic self-healing ability through the synergistic design of "structure-performance", inhibiting the brittle bottleneck of traditional UHTC coatings. However, in order to achieve long-term and reliable application in aerospace thermal protection systems, further research is needed to address issues such as high-temperature phase transition stability, interface durability, adaptability to complex environments, and controllable preparation processes.
Methods such as nanowire toughening can reduce the likelihood of crack formation in coatings. Wang et al. [48] prepared a SiC nanowire-toughened LaB6-MoSi2-SiC/SiC (SiCnws-LMS/SiC) coating on the surface of C/C composite materials using a multi-process synergy (CVD, PC, SAPS). Studies have shown that nanowires consume fracture energy through the pull-out effect and bridging effect, causing crack paths to deflect and inhibiting the formation of through cracks, as shown in Fig. 8. Hu et al. [49] used finite element analysis (FEA) simulation and experimental characterization to reveal the crack propagation behavior of thermally sprayed MoSi2 anti-oxidation coatings under repeated thermal-oxygen coupling conditions (1500∘C↔RT ), as shown in Fig. 9. The results indicate that introducing weak interfaces or establishing a reasonable microporous distribution through crack propagation simulation (ANSYS Intelligent Crack Propagation Module) can alter the propagation path of vertical cracks and even cause them to transform into horizontal A-type cracks with much lower stress levels (when the crack direction angle θ decreases from 90∘ to 0∘, the maximum stress can be reduced by 95% ). Table 1 shows the high temperature oxidation resistance of single layer, double layer, gradient and nanomaterial coating.
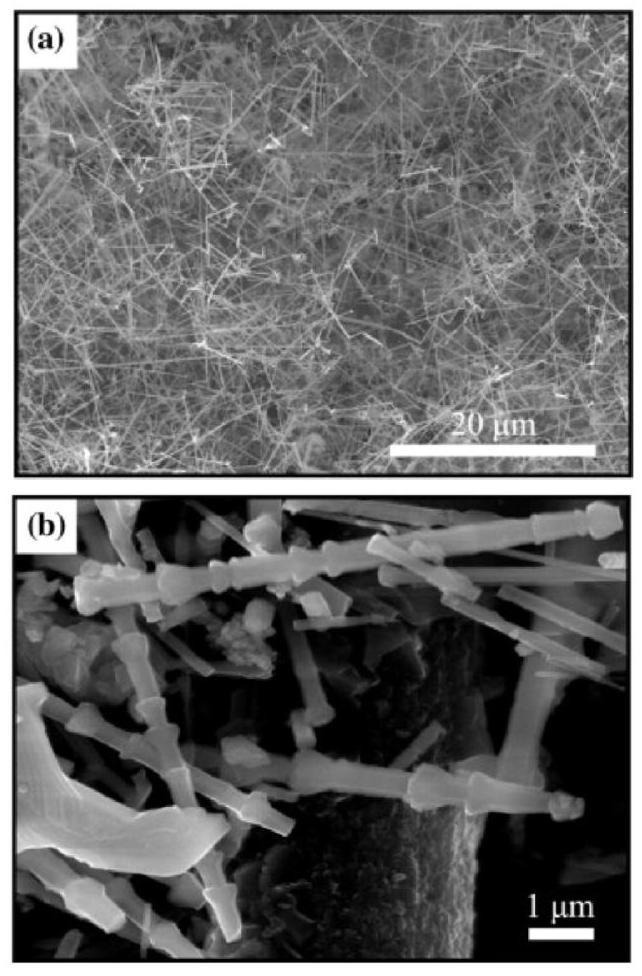
Fig. 5. SEM images of the bamboo-like SiC nanowires with a porous network on the surface of C/C samples: (a) low magnification; (b) high magnification.Reproduced with permission from Ref. [41], © Elsevier 2013. |
SiCw and BSG represent SiC nanowires and borosilicate glass, respectively. PIP, CVD, ISR, LC, PEM, CVI, LPS, SCC, IMP and so on represent precursor pyrolysis technology, chemical vapor deposition technology, in situ synthesis reaction, laser cladding technology, embedding technology, chemical vapor infiltration technology, liquid phase sintering technology, slurry spraying technology and impregnation technology respectively.
3. Preparation methods of the coatings
The service stability of coatings for hypersonic vehicles, aerospace engines, and other advanced aerospace equipment requires exceptional performance under extreme conditions, such as ultrahigh temperatures, broad temperature ranges, and high-speed airflow erosion. Considering the ultra-high melting points of borides, their poor adhesion to C/C composites, and the challenges in growing boride coatings on C/C surfaces, the development of advanced coating preparation techniques has become a critical research focus. These processes and systems are supposed to simultaneously achieve multiple objectives, including wide-range control of boride components, high density, low defect concentration, strong substrate bonding, formation of stable self-healing glass layers during oxidation, and resistance to ultra-high temperature and highspeed erosion [50].
3.1. Pack cementation method
Strong adhesion between the coating and carbon matrix is essential for achieving resistance to ultra-high temperature and high-speed erosion. The pack cementation process involves applying penetrant material (either elemental or compound powder) on the surface of the substrate to diffuse into the carbon matrix at elevated temperatures. Chemical bonding is formed between the penetrant material and the carbon matrix through chemical reactions, facilitating the growth of the coating [51], and the embedding process is illustrated in Fig. 10 [52]. The pack cementation technique is simple, versatile, and particularly effective for preparing gradient coatings.
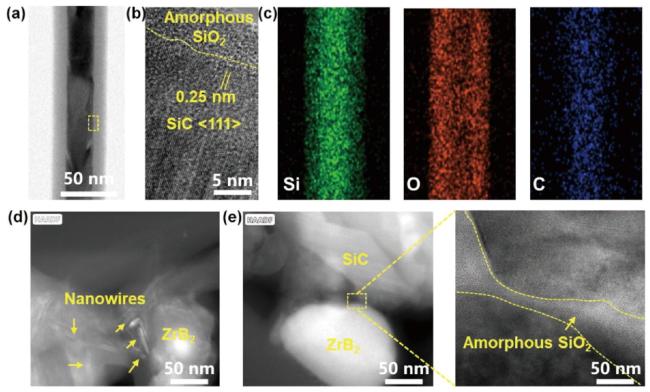
Fig. 6. (a) TEM image of a single SiC nanowire; (b) HRTEM image of the core-shell interface; (c) Elemental mapping of the nanowire; HADDF image of (d) nanowires surrounding ZrB2 and (e) the interface between ZrB2 and SiC. Reproduced with permission from Ref. [42], © Tsinghua University Press 2024. |
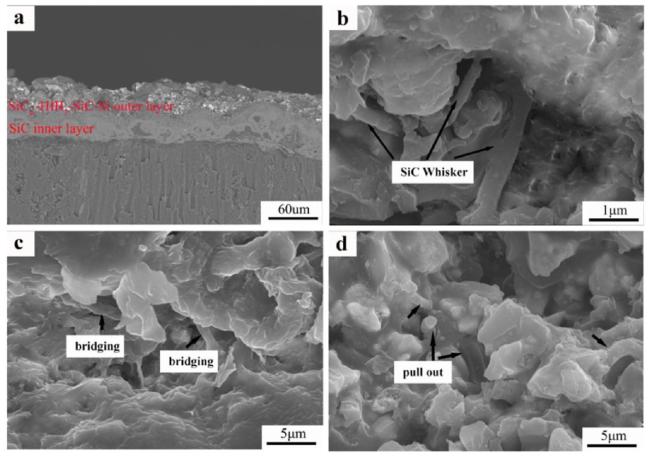
Fig. 7. SEM microstructure of SiCw-HfB2-SiC-Si/SiC coating: (a) cross-section; (b-c) cross-sectional SiCw bridging; (d) cross-sectional SiCw pull-out and debonding.Reproduced with permission from Ref. [46], © Elsevier 2018. |
Wang et al. [53] conducted comprehensive research on the effects of the silicon-to-carbon ratio and heat treatment temperature on the thermal shock resistance and oxidation resistance of ZrB2-SiC coatings during the pack cementation process. SiC/ZrB2-SiC coatings prepared at 2000∘C with a silicon-to-carbon molar ratio of 2 demonstrated superior oxidation protection, exhibiting mass loss of 6.5% after 15 thermal cycles between room temperature and 1500∘C. The pack cementation technique minimizes substrate dimensional changes while establishing strong interfacial bonding, making it particularly suitable for gradient coating preparation. Zhou et al. [54] employed pack cementation and slurry methods to prepare ZrB2-SiC-Ta4HfC5/Ta4HfC5 double-layer coatings, whose weight losses were only 3.3% and 9.5% after 20 h of oxidation at 1500∘C and 10 thermal shock cycles between room temperature and 1500∘C, respectively. Pourasad et al. [55] fabricated functionally graded SiC layers on graphite substrates using pack cementation with Si,C and Al2O3 powders, followed by in-situ reaction synthesis of SiC-ZrB2 outer coatings. These coatings exhibited a mass gain of 1.1% after 10 h of oxidation at 1500∘C. Fu et al. [56] applied the embedding method to create a SiC-MoSi2-ZrB2 coating on pre-oxidized C/C composites, achieving a 30.6% reduction in mass loss after 18 thermal cycles between room temperature and 1500∘C compared to untreated samples. Feng et al. [57] developed Fe2O3-modified ZrB2-SiC-Si coating using a two-step embedding method, providing effective oxidation protection for carbon/carbon composites for 150 h at 1500∘C and 60 s at 2300∘C. Li et al. [58] employed a three-step process combining embedding, electrophoretic deposition, and embedding again to prepare SiC nanowire-toughened SiC-ZrB2-ZrC coating on SiC-Si coating for C/C composites. This approach significantly enhanced oxidation resistance, reducing mass loss from 4.49% to 0.27% during isothermal oxidation at 1500∘C, and from 11.13% to 0.52% after 30 thermal cycles between 1500∘C and room temperature.
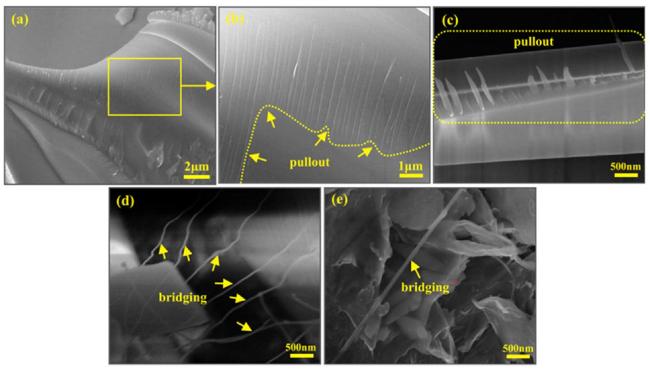
Fig. 8. Fracture surface SEM images of the SiCnws-LMS/SiC coating: (a-c) the representative nanowire pull-out feature; (d, e) the representative nanowire bridging feature. Reproduced with permission from Ref. [48], © Elsevier 2018. |
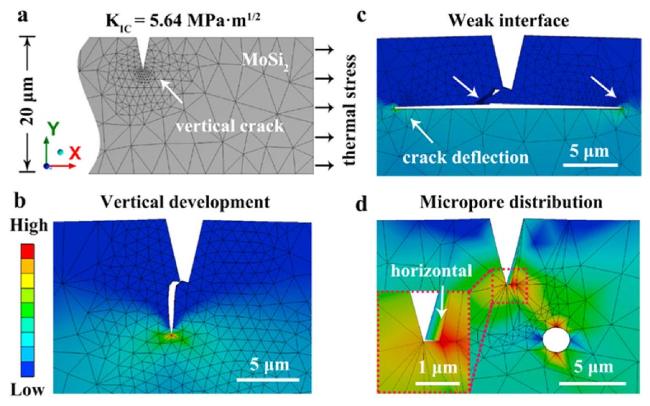
Fig. 9. Vertical crack development behavior under different conditions calculated by the smart crack growth modules of ANSYS: (a) the vertical crack development model; (b) the vertical development behavior in MoSi2 under the action of thermal stress; (c) the crack deflection behavior with weak interface; (d) the crack steering induced by micropore distribution. Reproduced with permission from Ref. [49], © Elsevier 2021. [49], © Elsevier 2021. |
Table 1 High temperature oxidation resistance of single layer coating, double layer coating, gradient coating and nanomaterial coating. |
| Coating materials | Fabrication methods | Temperature ( ∘C ) | Time (h) | Mass loss (wt%) | Refs. |
|---|---|---|---|---|---|
| ZrB2-ZrC-SiC | LC | 1500 | 0.8 | 0.51 g/cm2 | [21] |
| SiC | PEM + CVI | 1500 | 100 | 7.75 g/cm2 | [22] |
| B4C-HfB2-SiC | ISR | 1200 | 104 | 5.45 % | [23] |
| ZrB2-SiC | LPS | 1500 | 200 | 0.14 % | [25] |
| ZrB2 | SCC | 1500 | 342 | 1.03 % | [28] |
| ZrB2-CrSi2-SiC-Si/SiC | IMP | 1500 | 1.74 % | [29] | |
| HfB2-SiC/SiC | ISR | 1500 | 753 | 0.487 % | [30] |
| HfB2-SiC-MoSi2-Si/SiC- | - | 1650 | 618 | 57.9 % | [32] |
| Si | |||||
| | 2000 | 0.3 % | [33] | ||
| | PIP | 1300 | 120 | 1.25 % | [38] |
| SiCw | CVD | 1500 | 72 | 0.5 % | [41] |
| SiCw-/ZrB2-ZrSiO4 | 1500 | 20 | 120.17 g/cm2 | [43] | |
| SiCw-SiC-MoSi2-ZrB2 | CVD | 1500 | 124 | 1.1mg/cm2 | [44] |
| ZrB2-SiCw-BSG/ZrB2 | - | 1500 | 1.5 | 0.44 % | [45] |
| -MoSi2-SiCw-BSG | |||||
| SiCw-HfB2-SiC-Si/SiC | - | 1500 | 468 | 0.88 % | [46] |
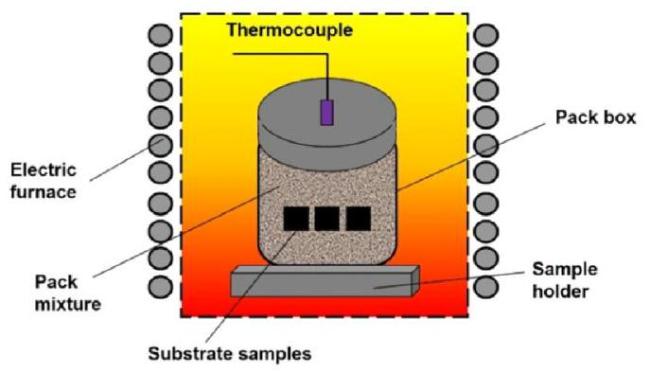
Fig. 10. Schematic diagram of the embedding process. Reproduced with permission from Ref. [52], © MPDI 2022. |
In general, the coating prepared by pack cementation process is prone to form a certain composition gradient with the substrate, which has good bonding with the substrate. However, the reaction temperature, time, powder ratio, and mixing uniformity all affect the diffusion and reaction of the powder, thus resulting in difficulty in controlling the density, uniformity, and thickness of the coating.
3.2. Brushing method
Brushing method involves applying a uniform pre-coating of the coating material on the carbon matrix surface, followed by high-temperature heat treatment to achieve coating infiltration, reaction and growth on the carbon matrix [59]. This method is widely studied and attracted considerable research attention due to the advantages including operational simplicity, cost-effectiveness, and minimal equipment investment [60]. Ji et al. [61] improved the density of ZrB2-SiC coatings prepared using the slurry method by incorporating expandable anatase materials during the sintering process. The coating exhibited excellent interfacial bonding strength (19.2 MPa) and demonstrated weight changes of 1.7%,-0.6%, and -1.7% after 40 h of oxidation at 800∘C,1000∘C, and 1200∘C, respectively. Li et al. [62] developed TaSi2-MoSi2-ZrB2-borosilicate glass coating on C/SiCO nanoporous ceramic composites through combined slurry brushing and pack cementation. With an increasing number of brushing cycles, the ablation rate of the coatings gradually decreased after 200 s of ablation at 1600∘C. After 24 brush cycles, the mass ablation rate and linear ablation rate of the coating were reduced to 2.5×10⁻⁴ g/s and 1.3×10⁻⁴mm/s, respectively. Duan et al. [63] employed the slurry brushing method to prepare ZrB2-SiC coatings on a graphite matrix surface (as shown in Fig. 11), examining the effects of ZrB2 content and binder concentration on the static oxidation behavior of ZrB2-SiC coating at 1200∘C. An increase in ZrB2 content from 30wt\% to 45wt\% led to a decrease in weight loss rate of the coating samples from -0.92% to -1.67%. after 120 min of oxidation at 1200∘C. Ren et al. [64] applied the slurry brushing method to prepare La2O3-modified ZrB2-SiC coating on a graphite matrix coated with a SiC layer. The ZrB2-SiC-La2O3 coating exhibited improved oxidation resistance compared to unmodified ZrB2-SiC coating, with a weight increase of 3.85×10⁻³ g/cm2 after 30 min of isothermal oxidation at 1800∘C and 6.49×10⁻³ g/cm2 after 30 short oxidation cycles at 1500∘C. Zhu et al. [65] utilized a combination of slurry impregnation and pre-oxidation to prepare HfSi2 -HfB2-SiC coating on SiC-coated C/C composites. After oxidation at 1473 K(516 h), at 1773 K(744 h), and at 1973 K(64 h), respectively, these coatings provided effective oxidation protection with mass gains of 0.63%,1.41%, and 1.91%. Similarly, Ding et al. [66] fabricated MoSi2-doped Si-HfB2-SiC/Si-SiC coatings through combined slurry impregnation and gas-phase silicon infiltration, which demonstrated exceptional oxidation protection for Cf/C composites at 1700∘C for 276 h, exhibiting a minimal mass loss rate of 0.99%.
The brushing method is a simple and feasible method, which can be used to prepare coatings on surface of carbon substrate with controllable coating thickness and structure. However, the low density of the coating prepared by the brushing method, as well as its poor adhesion with the carbon substrate, have limited its application as a high-performance oxidation protective coating.
3.3. Spraying method
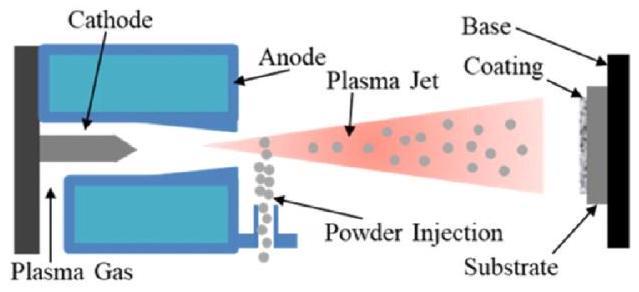
Plasma spraying technology involves the use of a plasma arc, driven by direct current, as a heat source. This method employs a high-temperature flame to heat powder particles to a molten or semi-molten state, which are subsequently sprayed onto the substrate surface to form a coating [67]. Plasma spraying gained widespread industrial adoption in various industries for ceramic coating fabrication owing to the advantages of operational simplicity, high efficiency, uniform coating thickness, minimal dimensional constraints, and low substrate damage.
Shi et al. [68] prepared a La-Mo-Si-O-C coating on porous SiC coated C/C composites using supersonic atmospheric plasma spraying. The coating exhibited a dense, crack-free microstructure with glassy La2O3,La2SiO5, and SiO2 phases after oxidation at 1773 K for 85 h in air, effectively blocking oxygen diffusion. Hao et al. [69] applied atmospheric plasma spraying to prepare ZrB2-SiC-Al2O3(ZSA) and ZrB2-SiC-Si (ZSS) coatings on C/C composites. The addition of alumina reduced the viscosity of the glass phase and promoted the healing of surface cracks and voids in the ceramic coating at high temperatures. Wang et al. [70] fabricated a plasma-sprayed ZrO2-modified LaB6 MoSi2 coating on SiC-coated C/C composites. The coating exhibited a crack-free structure with strong interlayer adhesion. After oxidation at 1773 K for 140 h, the mass loss was only 0.96%, and after 30 thermal cycles between 1773 K and room temperature, it was 0.61%. The excellent oxidation and spallation resistance were attributed to the formation of a continuous Zr-La-Si-O glass layer and inlaid phases that suppressed oxygen diffusion and crack propagation. Ma et al. [71] developed Y2O3-modified ZrB2-SiC coating on C/C composites through atmospheric plasma spraying (as shown in Fig. 12). The ZSY10 coating exhibited a mass loss rate of 5.77% after 10 h of oxidation at 1450∘C. Plasma spraying technology is also suitable for fabricating multilayer coatings. For instance, Ariharan et al. [72] deposited a double-layer coating composed of SiC-ZrB2/Al2O3-carbon nanotube (CNT) on graphite substrate using atmospheric plasma spraying, where the alumina outer layer provided additional oxidation protection for the SiC-ZrB2 inner coating.
Plasma spraying method has high production efficiency, wide range of sprayed materials, and short processing time. However, due to the physical and mechanical bonding between the coating and carbon substrate, the weak bonding force and porous feature of the coatings weakens its inhibitory effect on oxygen permeation and gas flushing.
3.4. In-situ reaction method
The development of in-situ reaction method addresses limitations of conventional embedding techniques, particularly the challenge of chemical bonding between borides and carbon matrices or inner coatings. Such limitation affects the regulation of boride content and bonding strength with the carbon substrate, hindering further improvements in oxidation resistance [73]. This approach overcomes structural barriers associated with the elevated melting points (∼3000∘C ) of UHTC components by utilizing cost-effective compound precursors. Through carbothermal reduction and solid-phase reactions, borides and siliconbased components are synthesized and distributed uniformly on the carbon matrix surface. To further regulate composition and thickness uniformity of the coating, the liquid-phase in-situ reaction sintering method was developed by integrating the slurry method with the in-situ reaction approach. This method enables composition and thickness regulation through brushing precursor material, while enhancing densification and substrate bonding through liquid-phase sintering. The in-situ reaction method encompasses multiple techniques, including embedding, slurry brushing, and liquid-phase sintering [73], which are employed to achieve high-performance coatings with strong substrate adhesion. A schematic diagram illustrating the preparation of HfB2-MoSi2/SiC-Si coatings on C/C surfaces via in-situ reaction sintering using embedding and brushing techniques is shown in Fig. 13 [73]. Insitu reaction methods based on carbothermal reduction are commonly used for the fabrication of SiC coatings on C/C composites.
Li et al. [74] synthesized SiC- ZrB2-ZrC coatings through in-situ reaction synthesis, achieving effective oxidation protection for C/C composites at 1673 K for over 221 h through synergistic effects among the components. Wang et al. [75] fabricated HfB2-modified SiC coatings via in-situ reaction synthesis. The optimal oxidation resistance was observed at 18.2wt\%HfB2 modification, which reduced the mass loss rate by 76.8% compared to unmodified SiC coatings after 200 h of oxidation. Ren et al. [76] prepared HfB2-SiC coatings using liquidphase sintering, where the formation of an Hf-O-Si compound glass layer during oxidation suppressed microcracks and reduced oxidationinduced mass loss of the carbon matrix. This glass layer enhanced the stability of the SiO2 glass phase at ultra-high temperatures, minimizing oxygen penetration and carbon substrate degradation. The insitu reaction methods are versatile and can be used to create carbide, boride, and silicide coatings, or to enrich the coating composition by adding oxides. Krishnarao et al. [77] introduced yttria-aluminasilicate (YAG) into a slurry coating to in-situ synthesize ZrB2-SiC-B4C- YAG coating, achieving excellent oxidation resistance at 1700∘C through the formation of ZrB2/ZrO2-containing YAG glass phases. Additionally, silicon-based in-situ coatings often serve as intermediate or transition layers between the substrate and the top coating. Pourasad et al. [78] fabricated SiC/SiC-ZrB2 double-layer coatings via insitu reaction synthesis, effectively protecting graphite at 1500∘C for 10 h with minimal mass gain of 1.7%. Ren et al. [79] combined embedding and liquid-phase sintering to create TaB2-SiC/SiC coatings, where tantalum oxides dissolved into the silicate glass phase formed Ta-Si-O dendritic microcrystalline structures, enhancing glass layer toughness and stability.
Based on in-situ reaction synthesis method, a series of high-performance antioxidant coating systems have been developed. However, as the coating system evolves towards multi-component, high entropy, and composite trends, the shortcomings of this method in accurately controlling the precise content of phases and coating structure during the in-situ synthesis process still need to be improved urgently.
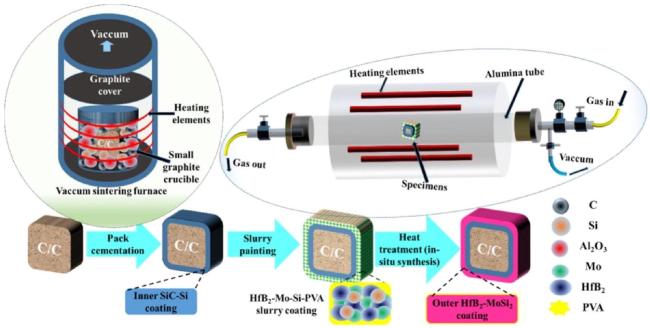
Fig. 13. Schematic diagram of the in-situ reaction sintering process for preparing HfB2-MoSi2/SiC-Si coatings on the surface of C/C composites. Reproduced with permission from Ref. [73], © Elsevier 2020. |
3.5. Spark plasma sintering
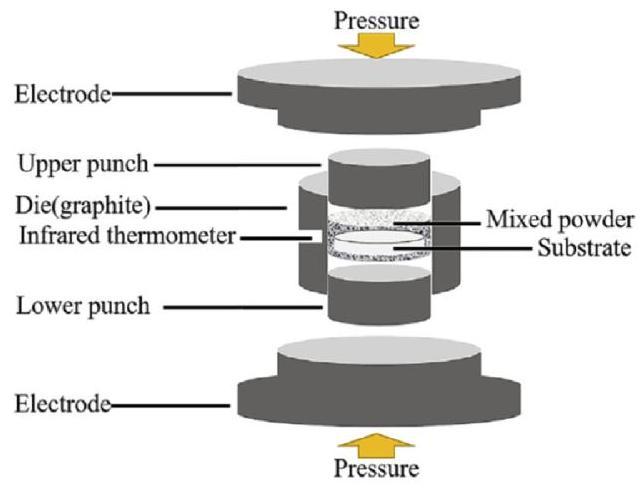
Spark plasma sintering (SPS) utilizes pulsed electric currents to generate discharge effects between particles, achieving rapid densification at relatively lower temperatures through hot pressing. This technique produces ceramic coatings with uniform and fine ceramic grains while effectively reducing porosity and defects in the coating, thus enhancing coating density. Through precise control of temperature, pressure, and current parameters during the SPS process, high-quality regulation of oxidation-resistant coating composition, thickness, mechanical interlocking and chemical bonding with the carbon substrate can be achieved [80].
Yang et al. [81] incorporated HfB2 into the ZrB2-SiC system using SPS method. The specimen containing 8vol\%HfB2 demonstrated a flexural strength of 717.1 MPa, representing a 162.6% increase compared to specimens without HfB2(273.1MPa). Chen et al. [82] developed MoSi2 - SiC coating on graphite substrate through single-step SPS processing (as shown in Fig. 14), which exhibited an adhesion strength of approximately 41.25 N and formed a smooth, defect-free SiO2 surface film approximately 40μ m thickness after oxidation. Furthermore, the coating showed minimal mass gain of 9.932mg/cm2 after 90 h of oxidation at 1400∘C in air. Liu et al. [83] fabricated MoSi2-SiB6 oxidationresistant coatings on the surface of graphite using the SPS method, which exhibited minimal micro porosity and microcracking during oxidation, with an oxygen permeability of 1.39% and a carbon loss rate of $0.109\pm 0.022\times {10}^{-6}\text{ }\mathrm{g}\cdot {\text{ }\mathrm{c}\mathrm{m}}^{-2}\cdot {\text{ }\mathrm{s}}^{-1}$ . Additionally, SPS method can also be utilized to fabricate multi-layer gradient coatings. Zhou et al. [54] prepared ZrB2-SiC-Ta4HfC5/Ta4HfC5 dual-layer oxidation-resistant coatings on C/C composites via SPS. Upon oxidation, the coating formed a dense, continuous silicate glass layer comprising ZrO2,SiO2, ZrSiO4,Ta2O5 and HfO2 particles, providing effective oxidation protection.
SPS has shown great potential in the rapid evaluation of coating composition, however, this technology urgently needs to be improved in engineering applications to meet the preparation requirements of coatings on irregular substrates.
3.6. Other methods
In addition to spray coating, in-situ synthesis and electric spark plasma sintering, additional techniques including chemical vapor deposition (CVD), sol-gel and magnetron sputtering have been employed for coating preparation [84,85]. Li et al. [86] developed dense ZrB2/SiO2 coatings reinforced with ZrB2 particles on SiC-coated C/C composites using sol-gel dipping. The coating provided effective oxidation protection at 1773 K for 160 h, with a weight loss of 6.9mg/cm2. Ouyang et al. [12] prepared ZrB2-SiO2 coatings on SiC-coated carbon/ carbon composites by infiltrating silicon sol into porous ZrB2 layers through the sol-gel method. After 330 h of oxidation at 1500∘C, the ZrB2-SiO2 composite coating exhibited a weight loss of 158 g/m2. Gai et al. [87] performed thermodynamic calculations and verification experiments on HfB2 coatings prepared by chemical vapor deposition (CVD) (as shown in Fig. 15). The dense and uniform HfB2 coating prepared at 1150∘C demonstrated effective ablation protection for C/C composites during 30 -second oxygen-acetylene combustion, with mass and linear ablation rates of 15.61mg/s and 15.58μ m/s, respectively. Kiryukhantsev-Korneev et al. [88] deposited Zr-Si-B-N coatings through magnetron sputtering at varying nitrogen partial pressures. Appropriate doped nitrogen reduced the grain size of the coatings and induced an amorphous structure, resulting in a dense and defect-free coating with enhanced properties.
In summary, the corresponding coating preparation method should be selected according to different thermal protection requirements. In practical applications, a single preparation method is often difficult to meet the requirements for achieving coatings for a specific purpose. Compared with a single preparation method, the coatings prepared by the combined methods have significant improvements in structural composition, density, bonding strength with the substrate, and oxidation resistance, which are widely used in coating preparation.
4. Coating components
Silicon-based ceramic coatings are widely recognized as ideal candidates for C/C composites due to their excellent physicochemical compatibility, high chemical inertness, superior thermal stability, and ability to form continuous, uniform, and dense silicate protective films during high-temperature oxidation [89]. However, the SiO2 glass formed through the oxidation of these silicon-based ceramic coatings becomes volatile above 1500∘C, which leads to the generation of voids and bubbles in the glass layer, thus resulting in failure of the coating. To extend service life of such coating, a feasible approach involves incorporating high-melting-point oxides or ultra-high-temperature ceramics that can produce even higher-melting-point oxides. Examples include rare earth oxides with exceptional thermal and physicochemical properties, borides, carbides and silicides of transition metals such as Ti,Zr and Hf, which can significantly improve the oxidation resistance of silicon-based ceramic coatings [90].
4.1. Boride composite coatings
Ultra-high-temperature ceramic borides, including HfB2,ZrB2 and TaB2, exhibit exceptional properties, such as high melting points, substantial hardness, low thermal expansion coefficients, reduced oxygen diffusion coefficients and outstanding chemical stability. These characteristics enable such materials to maintain structural integrity and excellent performance in high-temperature environments, making them suitable for aerospace thermal protection systems and aircraft engine components exposed to ultra-high temperatures and intense aerodynamic thermal loads. The oxides generated from the oxidation of transition metal borides possess high melting points and relatively low vapor pressures [38]. During oxidation, the composite coatings formed by these oxides and silicon-based components melt and combine to form a transition metal-B-Si-O composite glass layer with excellent self-healing properties.
In recent years, researchers have explored composite coatings combined with SiC and with borides, resulting in a series of high-performance oxidation-resistant coatings [91]. For instance, Zhou et al. [92] designed SiC-ZrB2-ZrSi 2 oxidation-resistant coating with mosaic structure, which combined with hydrothermal electrophoretic deposition and stacked binding methods. The dense, crack-free coating exhibited a weight gain of 15.2 g⋅ m-2 after 50 thermal cycles between 1773 K and room temperature, and minimal weight loss of 15.6 g⋅ m-2 after 580 h of oxidation at 1773 K in air. Zhu et al. [93] prepared HfB2 SiC coatings with 30-60wt\%HfB2 through slurry impregnation on SiCcoated C/C composites (as shown in Fig. 16). The 50wt\%HfB2-SiC coating formed a highly thermally stable and dense borosilicate glass layer during oxidation, effectively protecting the C/C composites from oxidation for 494 h. Similarly, Jiang et al. [94] fabricated single-layer TaB2-SiC-Si protective coatings on the graphite surface through impregnation and in-situ reaction methods. During oxidation, a Ta2O5 protective layer gradually formed on the coating surface. This coating protected graphite substrates for 168 h at 1550∘C and 120 s under a thermal flux of 2.38MW/m2. Monoboride coatings also show excellent performance in enhancing structural integrity. Cheng et al. [95] employed heat treatment, Chemical Vapor Deposition (CVD), and coating techniques to prepare a novel ZrB2-SiC ceramic coating on C/C composites with a Si-SiC coating. The coating, featuring well-dispersed SiC nanowire/pyrolytic carbon (SiCnw/PyC ) core-shell structures, exhibited minimal mass loss of 0.30% after 40 thermal shock cycles between room temperature and 1673 K.
In conclusion, due to the addition of borides, the self-healing glass layer formed on the surface of the SiC coating after oxidation changes from silicate glass to transition metal-B-Si-O glass layer, and the latter has better wide-temperature range protection ability. Therefore, boride-modified silicon-based coatings have demonstrated excellent oxidation protection potential in ultra-high temperature oxidation environments.
4.2. Multi-component boride composite coatings
Compared to silicon-based coatings that form SiO2 glass during oxidation, the boride-silicon-based coatings generate transition metal-B-Si-O composite glass layers through surface oxidation, exhibiting superior oxygen-blocking capabilities and self-healing characteristics [96]. With increasingly demanding operational environments for carbon-based composites, researchers have focused on enhancing the oxygen-blocking performance of these coatings by combining monoborides with other transition metals to develop multi-component boride coatings.
Ren et al. [97] utilized ZrO2,Ta2O5, B2O3,Si and C powders as raw materials, employing B2O3 and C to reduce ZrO2 and Ta2O5 during heat treatment at 2373 K to obtain the ZrxTa1-xB2 phase. The boride ZrxTa1-xB2-SiC coatings form a "mosaic structure" of Zr-Ta-Si-O composite glass on the surface during oxidation (as shown in Fig. 17). These coatings achieved extended protection at 1773 K for 1412 h with minimal mass loss of 0.1wt\%. Zhang et al. [98] investigated the effect of the volume ratio of HfB2 and TaB2 on the oxidation resistance of HfB2-MoSi2-TaB2 coatings. The addition of 15vol\%TaB2 delayed the initial oxidation temperature of the 60HfB2-40MoSi2 sample from
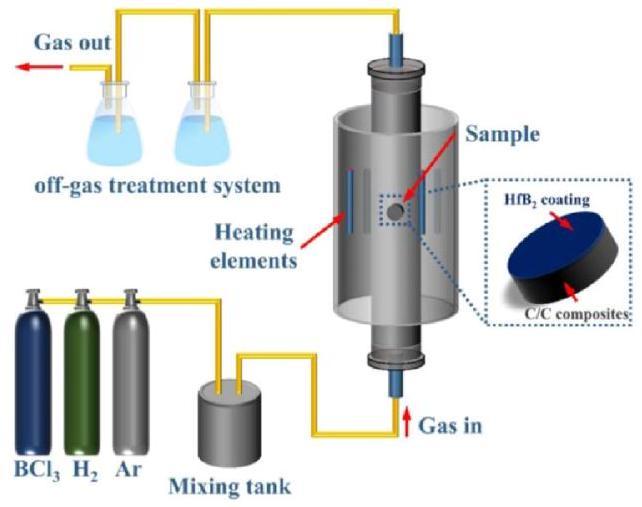
300∘C to 500∘C. Appropriate Ta5+ content promoted homogenization and dispersion of Hf/Ta oxides, forming coral-like Hf/Ta oxide frameworks within the glass layer that enhanced oxygen-blocking performance. Ren et al. [99] prepared Hf0.2Ta0.8 B2-x-SiC coatings on SiCcoated C/C composites through in-situ reactions using B2O3 and graphite to reduce HfO2 and Ta2O5. These multi-component boride coatings provided oxidation protection for the C/C composite at 1773 K for 1220 h. The dual protection mechanism consisting of the "mosaic phase" and the composite glass layer was identified as the primary reason for the excellent oxidation resistance of the Hf0.2Ta0.8 B2-x-SiC/ SiC coatings. Wang et al. [100] utilized spark plasma sintering to fabricate ZrB2-LaB6-modified SiC coatings on a graphite substrate. Evaluation of coatings with varying LaB6 content (0,3,5,8 and 10wt\% ) at 1700∘C for 100 min revealed optimal oxidation protection at 3wt\%LaB6, achieving 98.0% oxidation efficiency. However, excessive La content disrupted the SiO2 structure within the oxide layer, reducing oxidation efficiency.
Overall, the application of multi-component borides in composite coatings demonstrates the potential to enhance the oxidation resistance, service life and structural stability of coatings in extreme thermal environments by leveraging the synergistic effect among multiple transition metal elements. However, the component design of the boride phase and the silicon-based components in the multi-component system on the long-term protection mechanism of the coating still need to be analyzed in depth.
4.3. Boride-silicide composite coatings
The release of gaseous B2O3 during oxidation of borides induces porosity of the internal coating, generating multiple oxygen diffusion channels that significantly weaken the stability of oxygen-blocking structures. To enhance the dynamic stability of boride-SiC coatings during service, researchers have incorporated silicides into the coatings, leveraging the rapid film-forming capabilities of silicides to reinforce the internal self-healing effect of the coaing [101,102].
Wang et al. [103] developed ZrB2-SiC-HfB2-TaSi2 coatings on C/C composite surfaces using atmospheric pressure plasma spraying (APS). Within these coatings, the ZrB2 and HfB2 existed as unmelted particles and formed intermediate solid solutions of (Zr,Hf)B2.TaSi2 combined with Zr and Hf elements to form dense Zr-Ta-O and Hf-Ta-O oxides during oxidation. Under oxygen-acetylene thermal flux conditions of 1.8MW/m2, the coating demonstrated linear and mass ablation rates of -1.513×10⁻⁴ mm/s and 2.842×10⁻⁴ g/s respectively after 180 s. Wang et al. [104] employed in-situ reaction sintering to prepare WSi2-HfB2-SiC coatings on C/C substrates. During oxidation in an air environment at 1700∘C, the coating formed a flowing multiphase glass layer with embedded structures on the surface. The WSi 2-HfB2- SiC coating containing 25wt\% silicide provided protection for 100 h under these conditions, demonstrating optimal oxidation resistance. Ji et al. [13] enhanced the oxidation resistance of ZrB2-MoSi2 coatings by modifying MoSi2-TaSi2 bimetallic alloys using self-propagating high-temperature synthesis (SHS) and spark plasma sintering (SPS). The resulting Zr-B-Ta-Si-O glass exhibited excellent oxygen-blocking properties, reducing oxygen permeability to 0.29% and achieving an average oxidation protection efficiency to 99.71%. Mao et al. [105] used spark plasma sintering to prepare MoSi2-modified ZrB2-SiC-MoSi2 coatings on a carbon substrate. Optimal oxygen resistance was achieved with 20vol\%MoSi2, resulting in dense, uniform glass layers with minimal defects. Zhang et al. [106] investigated TaSi2-modified HfB2-SiC coatings as shown in Fig. 18, and the researchers observed that the oxidation-induced self-forming glass layer of silicides acted as an exogenous peeling agent, accelerating the diffusion of transition metal oxides within the glass. Additionally, the volumetric expansion during oxidation of silicide enhanced internal defect repair through film formation, thereby improving the oxygen resistance of the coating structure.
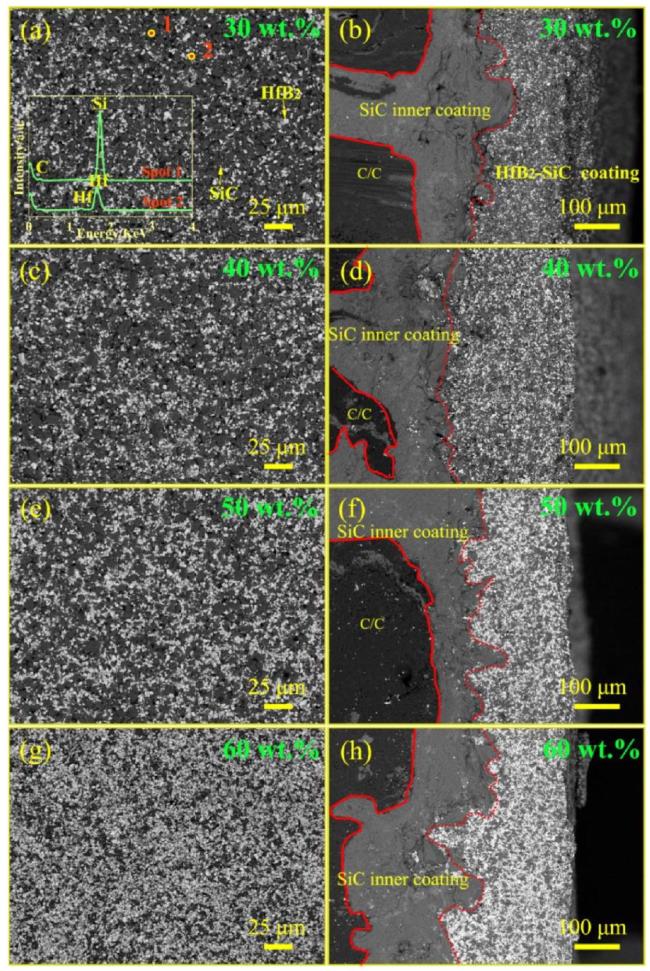
Fig. 16. Microstructure SEM images of HfB2-SiC coatings with different HfB2 contents: (a) and (b) Surface and cross-section of the 30wt\%HfB2-SiC coating; (c) and (d) Surface and cross-section of the 40wt\%HfB2-SiC coating; (e) and (f) Surface and cross-section of the 50wt\%HfB2-SiC coating; (g) and (h) Surface and crosssection of the 60wt\%HfB2-SiC coating. Reproduced with permission from Ref. [93], © Elsevier 2022. |
Overall, as a dual supply source for self-healing glass layers and transition metal oxides, silicide combined with borides can enhance the generation and healing speed of the self-healing glass, as well as exert the synergistic effect of multiple transition metal oxides. The dual oxygen barrier enhancement enriches the design scheme of oxidation
resistant coatings. However, the composition design and matching rules of silicide and borides in composite coatings are still the core bottleneck that restricts the self-healing efficiency and structural integrity balance optimization of the self-generated glass layer of the coating, and its internal mechanism urgently needs further systematic research.
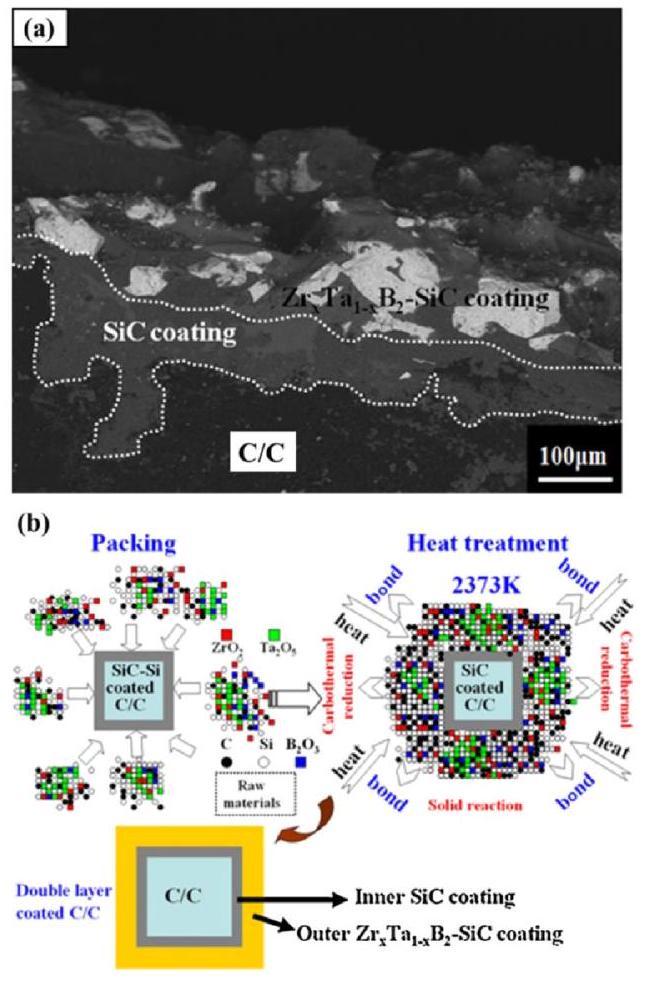
Fig. 17. w(a) Backscattered electron image of the cross-section of the double-layer coating on C/C composites; (b) Schematic of the preparation of the ZrxTa1-xB2-SiC outer coating. Reproduced with permission from Ref. [97], © Elsevier 2015. |
4.4. Boride composite coatings modified with rare earth oxides
Rare earth oxides doping has been shown to promote the formation of more stable and dense oxide films on boride composite coating surfaces at elevated temperatures, decelerating oxidation processes and enhancing oxidation resistance. Consequently, researchers have focused on investigating modification effect of rare earth oxide on boride-silicon-based coatings [107]. Pan et al. [108] incorporated various concentrations of Yb2O3 into ZrB2-MoSi2 coatings and evaluated their oxidation resistance and ablation performance under high-temperature conditions, including air furnaces, plasma flames, and lasers. The results revealed that the introduction of 5 mol\%Yb2O3 significantly enhanced the oxidation resistance of the ZrB2-MoSi2 coating. Similarly, Madhura et al. [109] prepared SiC-ZrB2 composite films on high-density graphite through plasma spraying and conducted thermal cycling tests at 1450∘C and 1550∘C. The results indicated that the inclusion of an intermediate Y2O3 coating layer substantially improved the durability of the composite films under these conditions. Chen et al. [110] developed La2O3-modified ZrB2-SiC (ZSL) coatings on SiC-coated C/C composites using encapsulation synthesis. Fig. 19 illustrates the surface morphologies, cross-sectional characteristics, and corresponding EDS analyses of ZrB2-SiC(ZS) and ZrB2-SiC-La2O3(ZSL) coatings after 550 h of oxidation at 1500∘C. The ZSL coating exhibited minimal mass loss of 0.6% after static oxidation at 1500∘C for 550 h. The synergistic effect and thermal stability of the La-Si-O compound glass layer formed during oxidation provided excellent oxidation protection and thermal shock resistance. Xie et al. [111] synthesized Lu2O3-SiC-ZrB2 composite coatings that demonstrated minimal mass gain of 0.62mg/cm2 after oxidation at 1500∘C for 836 h. Therefore, the incorporation of Lu2O3 enhanced coating density. Furthermore, first-principles calculations revealed that the Zr and Lu atoms within the glass network strengthened the O-Si bond, enhancing the structural stability of SiO2 and improving the oxidation resistance of the coating.
Based on the charge compensation effect of rare earth cations, the stability of the self-generated glass layer on the coating surface can be controlled by optimizing the content of rare earth cations in the rare earth modified composite coating to modify the network structure of silicate glass through "mesh filling and mesh breaking modification". However, the dynamic coordination behavior of rare earth cations and their cross-scale regulation mechanism on the multi-component structure still need to be further analyzed to enhance the oxygen barrier ability of the coating over a wide temperature range.
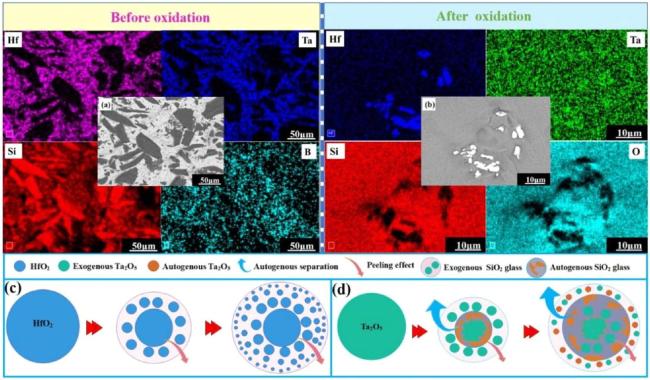
Fig. 18. (a)-(b) Surface EDS images of the 40HfB2-40TaSi2-20SiC coating samples before and after oxidation; (c)-(d) Schematic of Hf/Ta oxide peeling after oxidation. Reproduced with permission from Ref. [106], © Elsevier 2020. |
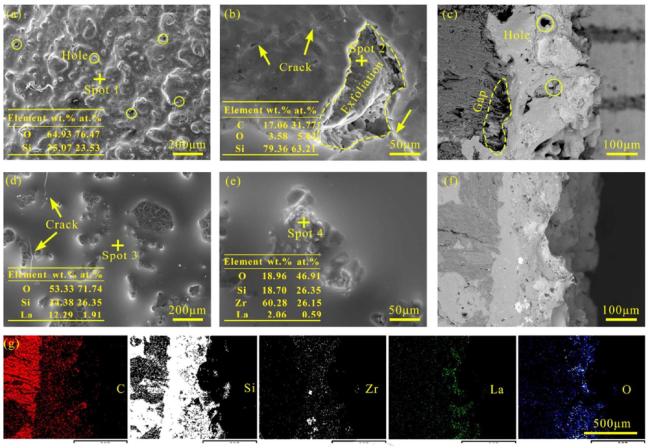
Fig. 19. Surface, cross-sectional morphology, and corresponding EDS analysis of ZS and ZSL coating samples after 550 h of oxidation at 1500∘C : (a) and (b) Secondary electron images of the surface of the ZS coating sample; (c) Backscattered electron image of the cross-section of the ZS coating sample; (d) and (e) Secondary electron images of the surface of the ZSL coating sample; (f) Backscattered electron image of the cross-section of the ZSL coating sample; (g) EDS area scan images of different elements corresponding to the cross-sectional morphology of the ZSL coating. Reproduced with permission from Ref. [110], © Elsevier 2018. |
5. Design of the self-generated glass film on the surface of coating
The carbon-based composites face multiple harsh service environments, including ultra-high temperatures, erosion, thermal shock, and ablation, necessitating gradient oxygen-blocking capabilities across different coating regions. These applications demand both static and dynamic performance characteristics. Specifically, static requirements include high density, minimal defects, strong interfacial bonding, and low oxygen permeability in oxide glass layers. Furthermore, dynamic requirements encompass minimal component oxidation loss, adhesion stability during service, stability of glass layer, and minimal dynamic defects. At the same time, SiO2 is the main phase in the glass layer, and its saturated vapor pressure and viscosity change curves with temperature are shown in Fig. 20 [112]. The softening temperature of SiO2 can be seen at 1669∘C. It is conducive to the flow and spread of SiO2 on the coating surface at high temperatures. The saturated vapor pressure of SiO2 at 1700∘C is 10-1.8 Pa. However, the critical value of vapor pressure for stable material properties is 10-2-10-1 Pa [113], so there is a certain volatilization of SiO2 at temperatures above 1700∘C. This causes the loss of Si elements. The loss of Si element has also become one of the important factors for oxidative weight loss of coatings. Therefore, to enhance coating stability and oxygen-blocking properties in complex environments, coatings should exhibit high density, minimal defects, low oxidation loss, and form glass layers with low oxygen permeability, high stability and superior self-healing capabilities.
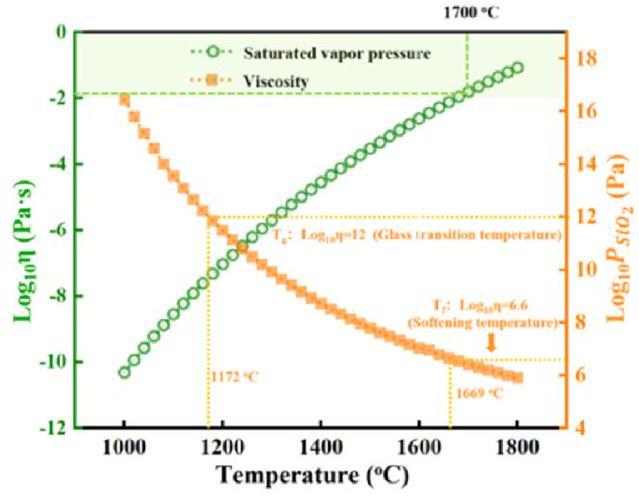
Fig. 20. Saturated vapor pressure and viscosity of SiO2 as a function of temperature. Reproduced with permission from Ref. [112], © Elsevier 2025. |
5.1. Transition metal-modified silicon-based glass film
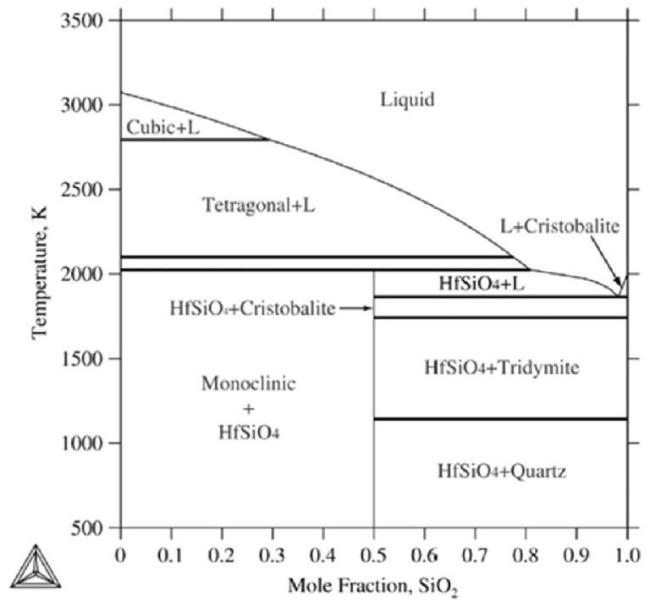
Recent researches have focused on incorporating transition metal borides, silicide, or carbides into silicon-based coatings to enhance the self-healing and oxygen-blocking capabilities of oxidation-formed silicate glass layers, leveraging the high melting points and thermal stability of transition metal oxides [114]. Lv et al. [115] utilized a typical encapsulation carburization method, slurry coating, and partial reaction sintering to fabricate HfB2-SiC/SiC coatings on C/C composites. During air oxidation at 1700∘C, the coating evolved from an initial SiO2/HfO2 oxide layer to a SiO2/HfSiO4/HfO2 protective layer through formation of HfSiO4, providing oxidation protection for 100 h. In the HfO2-SiO2 phase diagram shown in Fig. 21 [116], when the temperature is below ∼2023.15 K(1750∘C), the HfSiO4 phase remains stably in the system and becomes a refractory stable phase in the oxidized surface [117]. When the temperature is higher than ∼2023.15 K, the refractory phase changes from HfSiO4 to HfO2. At the same time, in most coating systems containing Si elements, Si-based components will continue to oxidize to form SiO2 to ensure a certain amount of SiO2 on the coating surface to form protection for the coating [118]. The vapor pressures of HfO2 at 2000 K and 2500 K in (PO2=20kPa ) air atmosphere are 1.479×10⁻¹⁴ and 6.099×10⁻⁹ Pa [119]. It is much lower than 10-1.8 Pa under SiO2 [112]. Therefore, refractory supergroup metal oxides exist in the complex glass layer with very low oxidative volatility, which provides a structural basis for improving thermal stability of the glass layer [120]. Ren et al. [121] employed liquid-phase sintering by combining in-situ reaction and slurry methods to prepare HfB2-MoSi2-SiC coatings with controllable composition and thickness. The experiments revealed that an increase in MoSi2 content (ranging from 20wt\% to 40wt\% ) raised the initial oxidation weight loss temperature of the samples in dynamic aerobic environments (room temperature to 1500∘C ) from 775∘C to 821∘C. The maximum weight loss rate decreased to 0.2×10⁻³mg⋅cm-2⋅ s-1, with the minimum relative oxygen permeability reaching 12.2%. Static oxidation at 1500 ∘C for 200 h showed reduced weight loss from 0.46% to 0.08%. Cheng et al. [122] incorporated nine transition metal oxides, including TiO2,ZrO2 and HfO2, into SiO2 glass via cold pressing and heat treatment to investigate the effects on the volatilization characteristics of SiO2 glass at 1700∘C. The mass loss curves of the SiO2-MexOy samples after heat treatment at 1700∘C for 30 h are illustrated in Fig. 22. The results demonstrated that metal atoms from TiO2,ZrO2 and HfO2 diffused into cSiO2, effectively reducing SiO2 volatilization, with SiO2-HfO2 demonstrating minimal volatilization. Zuo et al. [123] fabricated B4C-SiC-ZrC-ZrB2 coatings on C/C composites using impregnation and pyrolysis. Oxidation studies between 800∘C and 1550∘C revealed that precipitated B2O3,SiO2 and ZrO2 provided self-healing and oxidation resistance. The composite material with a density of 1.8 g⋅ cm-3 exhibited a mass loss of only 1.8% after oxidation. Li et al. [124] examined the oxidation behavior of SiC-ZrB2-ZrC coatings based on the microstructural evolution of the oxide layer at various oxygen partial pressures at 1773 K. The results indicated that higher oxygen partial pressures accelerated formation of SiO2 glass in a short time, effectively healing microcracks in the oxide skin. The ZrB2 and ZrC phases played a crucial role in inhibiting crack deflection and propagation during oxidation. After 6 h of isothermal oxidation at 80000 Pa oxygen partial pressure, the mass change was 1.34%.
The dispersed distribution of transition metal oxides in self-generated SiO2 glass helps to increase the viscosity of the glass film and reduce its oxygen permeability, through the complexation of high valence transition metal cations with silicon oxygen tetrahedra. However, the melting point and service temperature range of a single transition group metal oxide are limited, and it is difficult to deeply construct a high oxygen barrier coating on the surface of carbon-based structural materials solely relying on the modification of a single transition group metal.
5.2. Multi-transition-metal-modified silicon-based glass film
The incorporation of transition metal oxides into the self-generated glass layer on the coating surface has been shown to significantly enhance the oxidation resistance of the coating and extend its service life. To further improve the protective performance of coatings, researchers have focused on leveraging synergistic effects between multiple transition metal oxides through multicomponent borides and boride-silicide composites to strengthen the oxygen-blocking capabilities of multiphase glass layers [125].
Ren et al. [126] developed ZrB2-20SiC and ZrB2-20SiC-10TaSi2 coatings on graphite coated with SiC using the slurry coating method. Oxidation tests at 1700∘C for 30 min under induction heating revealed that TaSi2 addition significantly improved the oxidation resistance of the ZrB2-20SiC coating through the formation of a Ta-containing oxide dissolution layer with substantially reduced oxygen permeability. Li et al. [127] introduced WB into ZrB2-SiC coatings using vacuum plasma spraying and evaluated the oxidation resistance of the ZrB2-SiC-WB composite coating at 1500∘C. The results demonstrated that appropriate addition of WB significantly enhanced the oxidation resistance of the ZrB2-SiC coating, resulting in reduced oxidation mass gain and increased liquid phase layer thickness. Yang et al. [128] fabricated HfB2-MoSi2-SiC coatings through spark plasma sintering (SPS) and enhanced their oxidation resistance through pre-oxidation treatment. The effects of MoSi2 content and pre-oxidation processes on the oxygen-blocking performance of coatings at 1973 K were investigated, where increased MoSi2 content significantly improved protective efficiency during active oxidation. After pre-oxidation at 1773 K, the 40HfB2-40MoSi2-20 SiC coating formed a more stable glass layer with reduced defects, achieving 99.8% protection efficiency and 0.028% oxygen permeability. Li et al. [129] applied a three-step method to prepare SiC/SiC-MoSi2-ZrB2 composite ceramic coatings on C/C composites. The coating structure consisted of an 80μ m dense SiC inner layer and an approximately 200μ m uniform outer layer rich in MoSi2-ZrB2. The coated specimens demonstrated 21.5% higher bending strength compared to uncoated C/C composites and exhibited only 0.56% mass loss after 305 h of oxidation at 1773 K in air. Jiang et al. [130] synthesized dense ZrB2-MoSi2-SiC-Si coatings on graphite substrates using slurry impregnation and vapor-phase silicon infiltration processes. After 150 h of oxidation at 1600∘C, the coating exhibited minimal mass loss (0.21% ), attributed to its dense structure and formation of a glassy oxide layer containing insoluble ZrO2. Furthermore, the coating demonstrated excellent thermal shock resistance, showing 0.11 % mass gain after 100 thermal shock cycles between 1200∘C and room temperature. The excellent thermal shock resistance resulted from the combination of graduated thermal expansion coefficients throughout the composite structure and the presence of a C/SiC transitional interface between the substrate and coating. Zhang et al. [106] prepared TaSi2-modified HfB2 SiC coatings. Post-oxidation analysis revealed that double transition metal oxide nanocrystals, including Ta2O5,HfO2 and HfSiO4, were dispersed within the SiO2 glass layer to form an Hf-Ta-B-Si-O composite glass layer (as shown in Fig. 23). The composite glass layer reduced the oxygen permeability of the coating and improved its oxidation protection efficiency.
Fig. 23. TEM images of the composite glass layers: (a) Hf-B-Si-O and (d) Hf-Ta-B-Si-O; High-resolution TEM images of the composite glass layers: (b)-(c) Hf-B-Si-O and (e)-(f) Hf-Ta-B-Si-O. Reproduced with permission from Ref. [106], © Elsevier 2020. |
The coexistence of multiple transition metal oxides in the oxide layer can effectively utilize the differences in ion valence and radius, bond strength of transition metal-O, and oxide melting point of different transition metal elements, thereby controlling over the film-forming characteristics, protective mechanisms, and oxygen permeability of the composite glass layer. The future development direction lies in clarifying how to regulate the type and content of transition metal atoms, and the relationship between formation rate of the self-generated film and sealing oxygen barrier effect.
5.3. Synergistic modification of transition metals and rare earth elements
The synergistic modification of oxidation-resistant coatings through transition metals and rare earth elements leverages the unique properties of both element types, including high melting points and chemical reactivity. This approach demonstrates excellence in oxidation resistance, enhancement of coating density [131]. The appropriate incorporation of these elements generates synergistic effects that further enhance the oxidation resistance of the coating.
Lin et al. [132] investigated the influence of Y2O3 on the oxidation resistance of the ZrB2-SiC-Y2O3 coatings. The results revealed that addition of 10wt\%Y2O3 led to aggregation of yttrium-stabilized zirconia in the SiO2 liquid phase, forming a Zr-Si-Y-O glass blocking layer that inhibited oxygen diffusion and healed cracks. Kovaleva et al. [133] examined the formation process of airtight glass layers in ZrB2-xMoSi2-Y2O3-yAl coatings at 1400∘C. Their findings indicated that the formation of a dense and airtight coating depends on the single glass matrix development. With a constant aluminum content, the chemical reaction rate constant for airtight layer formation increased with higher MoSi2 content, accompanied by enhanced material transformation. Zhang et al. [134] explored the oxidation mechanism of CeO2-modified HfB2 -MoSi2-SiC coatings at 1700∘C. The addition of CeO2 resulted in the formation of a stable Hf-Ce-B-Si-O composite glass phase, significantly improving the viscosity, stability, and self-healing sealing properties of the glass layer. The inclusion of 0.75vol\%CeO2 effectively reduced the oxidation activity of the coating, increasing the average protection efficiency to 99.96 % and reducing the maximum oxygen permeability by 43.48%, thereby exhibiting excellent oxygen-blocking properties. Ren et al. [135] investigated the oxidation behavior of ZrB2-SiC-La2O3/SiC double-layer coatings on siliconized graphite substrates under extreme conditions (1800∘C, low-pressure environment). At 50 kPa oxygen partial pressure, a continuous protective oxide scale comprising lan-thanum-dispersed ZrO2 and SiO2 phases formed on the coating surface. Decreasing pressure led to significant SiO(g) volatilization, resulting in the formation of a porous ZrO2 oxide layer on the coating surface. Furthermore, Xie et al. [136] engineered Lu2O3-SiC-HfB2 coatings on C/ C composites, demonstrating exceptional oxidation resistance at 1700∘C. The enhanced protection mechanism was attributed to the high-temperature interdiffusion of lutetium and hafnium cations within the silica matrix, which significantly improved structural stability and extended oxidation protection duration. Ji et al. [137] fabricated LaB6-HfB2 synergistically modified HfB2-SiC coatings, revealing that La atoms diffuse into the Hf-Si-O glass phase to form a more stable Hf-La-Si-O composite glass layer. Additionally, refractory La oxides embedded within the glass layer inhibited crack propagation and effectively inhibited inward oxygen diffusion. Fig. 24 illustrates the high-magnification backscattered SEM morphology of the oxidized HfB2-SiC-LaB6 coating surface at 1700∘C and the evolution mechanism of the multiphase glass layer during oxidation.
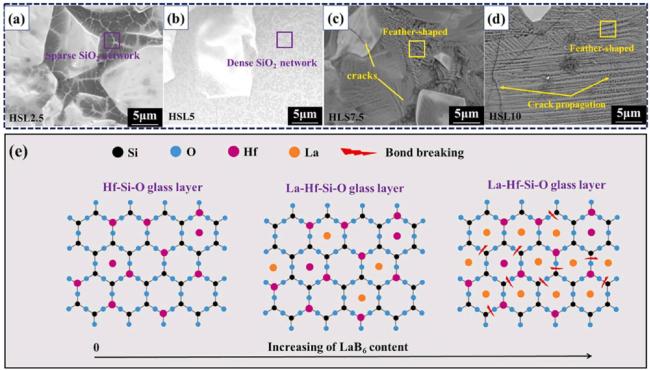
Fig. 24. (a)-(d) High-magnification backscattered SEM morphologies of the surface of the HfB2-SiC-LaB6 coating after oxidation at 1700∘C; (e) Evolution mechanism of the multiphase glass layer during the oxidation process. Reproduced with permission from Ref. [137], © Elsevier 2024. |
Based on the characteristics of high cation field strength of rare earth elements, they have a unique dynamic modification effect of "filling network - breaking network" in silicate glass, and can work synergistically with transition group metals to significantly improve the structural stability and oxygen barrier performance of the composite glass layer on the coating surface. Future work urgently needs to clarify the multi-source coexistence and oxygen blocking enhancement mechanism of rare earth oxides and transition group metals (such as Hf,Zr, Ta ) in Si-O networks, providing theoretical basis for the optimization design of rare earth doping strategies in complex service environments.
Machine Learning (ML) methods are increasingly becoming a powerful tool for optimizing coating chemistries to achieve specific performance goals (e.g., wear resistance, corrosion resistance, bond strength, optical properties, etc.). By analyzing complex datasets from experimental data, high-throughput calculations, or the literature, ML models are able to establish non-linear mapping relationships between coating composition, process parameters, and final properties. This goes beyond traditional trial-and-error methods to efficiently identify hidden patterns and optimal combinations in the composition space. The ML approach can be used to guide experimental design, predict the performance of new compositions, and reverse-engineer coating formulations to meet specific requirements, dramatically accelerating the development of high-performance coatings. This field represents an important frontier and future direction in coating material design. Zhang et al. [138] employed machine learning modeling (feature engineering and optimization of the random forest algorithm) supplemented by experimental validation to investigate the effects of coating composition and sputtering process parameters on the hardness of high-entropy nitride (HEN) coatings. The study found that using a specific subset of composition and process parameters to establish a machine learning model yielded the most accurate predictions (RMSE 3.38, R2 0.86), successfully designing multiple ultra-hard (>40GPa ) HEN coatings, with the AlCrNbSiTiN coating exhibiting the highest hardness value. Xu et al. [139] used machine learning (random forest algorithm) combined with active learning and high-throughput experimental methods to reveal the effects of composition and process parameters (particularly bias voltage and nitrogen content) on the hardness of highentropy ceramic coatings. The results showed that by introducing active learning combined with high-throughput preparation (obtaining 16 sets of gradient composition samples in a single sputtering process), three iterations successfully screened out a new type of five-component high-entropy nitride coating. Among these, the (AlCrNbTaTi)N coating achieved the optimal hardness and exhibited a single FCC solid solution phase structure. Hao et al. [140] investigated the influence of coating material properties and experimental parameters on the oxidation and ablation resistance of ultra-high-temperature ceramic (UHTC) coatings using machine learning (random forest regression algorithm) combined with feature engineering and SHAP interpretability analysis. The results showed that the random forest model optimized using feature recursive elimination (RFE) achieved the highest prediction accuracy (test set R2=0.87 ), with the lowest melting point component being the most critical influencing factor. This model provides a data-driven approach for the screening and design of high-performance ablation-resistant coatings under specific ablation environments.
Rare earth cations can inhibit oxygen diffusion by promoting liquid-phase sintering of SiO2 and forming a dense oxide film on the coating surface, as well as interacting with network oxygen. When the highly charged cations have a small cation radius, the field strength between the cation and oxygen bonds is higher, which significantly enhances the stability of SiO2. First-principle calculations and experimental verification were carried out by Xie et al. [141] to reveal the effects of rareearth oxides (La2O3,Nd2O3,Y2O3,Er2O3 and Yb2O3, and Lu2O3) on the stability of the SiO2 crystal structure. The results show that the above rare earth ions can diffuse into SiO2 to form interstitial solid solutions or rare earth silicates, which can enhance the stability of the SiO2 structure. Among them, the Lu2O3-SiO2 composites showed the lowest mass loss at 1700∘C and the highest binding energy of lutetium oxide to SiO2, indicating the best stability effect. Table 2 shows the high temperature oxidation resistance of self-generated glass film coating at temperatures above 1500∘C.
Table 2 The self-generated glass film coating has high temperature oxidation resistance above 1500∘C. |
| Coating materials | Fabrication methods | Temperature ( ∘C ) | Time (h) | Mass loss (wt%) | Refs. |
|---|---|---|---|---|---|
| HfB2-SiC/SiC | PCP | 1700 | 0.8 | 0.51 g/cm2 | [115] |
| HfB2-SiC-MoSi2 | LPS | 1500 | 200 | 0.08% | [121] |
| SiO2-MexOy | CP+HT | 1700 | 30 | - | [122] |
| ZrB2-SiC-ZrC-B4C | IMP + PYR | 1500 | 200 | 1.8% | [123] |
| ZrB2-SiC-ZrC | - | 1500 | 6 | 1.34 % | [124] |
| ZrB2-SiC-TaSi2 | SCC | 1700 | 0.5 | 3.81mg/cm2 | [126] |
| ZrB2-SiC-WB | LPPS | 1500 | 753 | 0.487 % | [127] |
| HfB2-SiC-MoSi2 | LFT | 1700 | - | 0.56 % | [128] |
| SiC/SiC-MoSi2-ZrB2 | 1500 | 30 | 0.3 % | [129] | |
| ZrB2-MoSi2-SiC-Si | SI+ VSI | 1600 | 150 | 0.21 % | [130] |
| ZrB2-xMoSi2-Y2O3-yAl | SCC | 1400 | 6.5 | [133] | |
| CeO2-HfB2-MoSi2-SiC | SPS | 1700 | 1.5 | 0.14 g/cm2 | [134] |
| ZrB2-SiC-La2O3/SiC | SPS | 1800 | 0.25 | 1.15mg/cm2 | [135] |
| Lu2O3-SiC-HfB2 | SPS | 1700 | 130 | 3.8mg/cm2 | [136] |
| LaB6-HfB2-SiC | LFT | 1700 | 1.5 | 0.85 g/cm2 | [137] |
PCP, LPS, CP, HT, IMP, PYR, SCC, LPPS, LFT, SI, VSI, SCC, SPS and others respectively represent the following technologies: carburizing coating technology, liquid phase sintering technology, cold pressing technology, heat treatment technology, impregnation technology, pyrolysis technology, vacuum plasma spraying technology, low-loss film formation treatment technology, slurry impregnation technology, gasphase silicon infiltration technology, slurry coating technology, and discharge plasma sintering technology.
The antioxidant mechanisms of the multiphase glass layers on oxidized ceramic coatings (as illustrated in Fig. 21) can be systematically categorized into four fundamental aspects:
(1) Low oxygen permeability structure: the dense glass layer functions as protective armor, effectively blocking the diffusion of oxidative gases like oxygen into the coating and substrate, thereby reducing the oxidation reaction rate.
(2) Self-healing capability: under elevated temperatures, the glass layer exhibits dynamic fluidity characteristics. When surface microcracks or defects develop, the viscous glass phase spontaneously flows to fill these imperfections, restoring structural integrity and maintaining continuous oxidation protection.
(3) High-temperature stability: the transition metal oxide nanocrystals diffused within the SiO2 glass matrix enhance the glass layer's thermal stability and strengthen interfacial adhesion between different phases.
(4) Crack inhibition via embedded phases: the refractory embedded phases in the glass layer perform multiple protective functions through their ability to impede crack propagation, to induce crack deflection or termination, and to dissipate crack propagation energy.
Therefore, through the synergistic effect of multiple mechanisms, the glass layer formed on the oxidized surface of the ceramic coating significantly improves the oxidation resistance of the material. In view of this, how to clarify the oxygen blocking contributions of each component in the composite glass layer is the key to further strengthening the design of oxide glass films. (Fig. 25)
6. Coating treatment
Fig. 26 illustrates the autonomous film formation mechanism of UHTC coatings during operational exposure [13,144,145]. The continuous oxidation of coating constituents promotes the progressive growth and lateral expansion of a glassy phase, ultimately resulting in the formation of a continuous oxygen-blocking layer on the coating surface. However, practical applications reveal that oxidation-induced structural imperfections, particularly porosity and crack formation, significantly compromise coating performance and service life. Furthermore, the formation of the protective glass layer through surface oxidation inherently involves the consumption of coating constituents. To address these challenges, researchers have developed an integrated approach combining preventive measures and in situ repair mechanisms. The coating densification was enhanced through pore-sealing by chemical vapor deposition (CVD) and silicon infiltration techniques, which creates dense protective coatings and effectively improve thermal oxygen-blocking capabilities by establishing defect-resistant architectures. Additionally, pre-oxidation treatments have been employed to establish stable oxide protective films on the coating surface, providing preemptive protection against subsequent environmental oxidation under harsh conditions. For unavoidable localized defects, micro-region repair technologies are implemented to precisely identify and restore damaged areas, thereby maintaining maximum coating integrity. Through these multidimensional approaches to minimize oxidation-induced defects in ceramic coatings, researchers are enhancing comprehensive coating performance to extend service life in severe environments [146].
6.1. Chemical vapor deposition
The presence of pores and cracks in coatings constitutes primary channels for oxygen penetration, leading to oxidative corrosion of the carbon matrix. To enhance the oxygen-blocking capabilities of the coating, the formation of dense films through vapor deposition for sealing surface pores has attracted extensive research attention globally [147]. Quan et al. [148] developed a multilayer oxidation-resistant SiC/ZrB2-CrSi2-Si/SiC coating using chemical vapor deposition (CVD) (as shown in Fig. 27). The researchers investigated the coupling mechanisms between the CVD-SiC and SCZ layer microstructures during preparation. The coating exhibited exceptional performance with a minimal mass loss of 8.05mg⋅cm-2 after 340 h of oxidation at 1673 K. Yang et al. [38] fabricated a $\mathrm{S}\mathrm{i}\mathrm{C}/\mathrm{S}\mathrm{i}-{\mathrm{Z}\mathrm{r}\mathrm{S}\mathrm{i}}_{2}-{\mathrm{Z}\mathrm{r}\mathrm{B}}_{2}-{\mathrm{H}\mathrm{f}\mathrm{B}}_{2}/\mathrm{S}\mathrm{i}\mathrm{C}$ coating through a combination of CVD, brush coating-sintering and pre-oxidation treatments. Oxidation tests demonstrated that the dense structure of the intermediate self-healing layer and the synergistic effects among the three layers resulted in minimal weight losses of 0.76%,0.84% and 1.25% after exposure at 1100∘C,1200∘C and 1300∘C for 210 h,165 h and 120 h, respectively. Zhu et al. [149] developed a dense SiC-HfB 2 oxidation-resistant coating on C/C composites with an inner SiC layer using low-temperature composite chemical vapor infiltration (CVI). The coating effectively sealed penetrating cracks in the inner SiC layer, while Hf oxides inhibited volatilization of SiO2, providing oxidation protection for 59 h,503 h, and 166 h in air at 1473 K,1773 K and 1973 K, respectively.
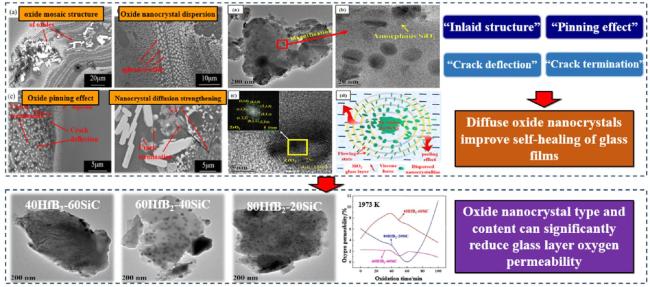
Siliconizing represents a chemical heat treatment process involving infiltration of silicon into the surface layer, where silicon atoms transfer from the medium to the workpiece surface through chemical reactions to form silicide layers. The process encompasses various methodologies, including solid-phase siliconization using powder media, gas-phase siliconization, and liquid-phase siliconization utilizing molten salt baths or solutions containing silicon [150]. Ren et al. [151] prepared a ZrB2 -SiC-TaSi2-Si coating on siliconized graphite through combined slurry brushing and gaseous silicon infiltration. The coating demonstrated excellent oxidation resistance and crack resistance in air at 1500∘C, exhibiting a relatively low oxidation rate constant of 0.27mg/ (cm2⋅ h0.5 ). Jiang et al. [152] modified a single-layer Si-SiC coating on a graphite substrate through combined impregnation and reactive infiltration. Oxidation experiments revealed that after oxidation for 1200 h (30 thermal cycles) at 1500∘C in air, graphite substrates coated with ZrB2-SiC-Si and TaB2-SiC-Si exhibited mass losses of 0.086% and 0.537%, respectively, indicating substantially improved high-temperature stability compared to the original Si-SiC coating. Zhang et al. [153] fabricated a dense SiC-HfB2-Si coating on C/C composites through combined slurry impregnation and gaseous silicon infiltration, with the preparation process diagram illustrated in Fig. 28. The coating demonstrated exceptional oxidation resistance with only 0.69% mass loss after 538 h of oxidation in static air at 1773 K, primarily attributed to the formation of a composite Hf-Si-O glass layer that effectively sealed cracks and pores on the coating surface.
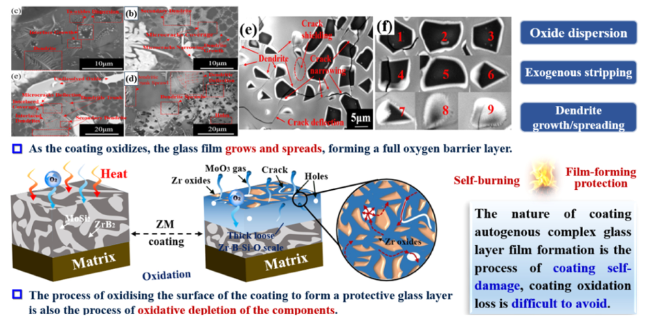
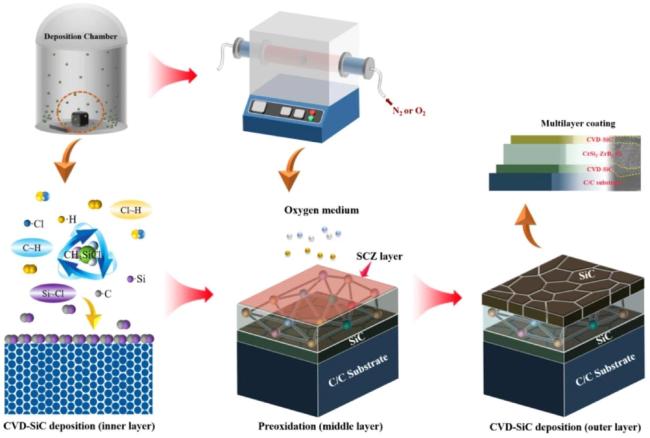
Fig. 27. Schematic diagram of the preparation process for the SiC/ZrB2-CrSi2-Si/SiC multi-layer coating. Reproduced with permission from Ref. [148], © Elsevier 2021. |
In summary, the synergy between coating preparation technology and chemical vapor deposition technology provides an effective solution for the densification and self-healing of ultra-high temperature coatings, significantly improving the closure of oxygen diffusion channels inside the coating. However, existing processes still face common bottlenecks such as insufficient deposition rate and limited deep penetration ability of high melting point components (such as Hf, Zr and Ta). Based on this, how to improve sedimentation efficiency and ensure uniformity of sedimentation along the depth direction is the future development direction of this technology.
6.2. Pre-oxidation
Although the in-situ formation of transition metal borosilicate multiphase glass layers through oxidation of the boride-silicon-based coatings is essential for achieving enhanced wide-temperature-range oxygen-blocking capabilities, the oxidation process of the coating inherently compromises the integrity of the oxygen-blocking structure. To minimize oxidation-induced degradation during film formation, researchers have developed pre-oxidation strategies to establish highquality self-healing protective layers with reduced mass loss [154].
Kan et al. [155] analyzed the oxidation behavior of ZrB2-SiC ceramic samples from room temperature to 1700∘C (weight change curve shown in Fig. 29), identifying a stability window between 1100-1400∘C. By optimizing pre-filming parameters within this temperature range, they developed low-permeability glass films on ZrB2 SiC coatings, significantly enhancing their oxidation resistance. Fig. 26 displays the surface SEM micrographs and TEM images of the ZrB2-SiC coating after the film formation process at 1200∘C for 120 min. The coating exhibited optimal oxidation suppression performance, with the structural and inert factors reduced by 33.36% and 82%, respectively. Zhang et al. [156] employed low-loss film treatment (LFT) to establish a high-quality oxygen-blocking glass layer on the HfB2-SiC-ZrSi2 coating. Following 1500∘C LFT treatment, the coated sample exhibited a carbon loss rate of 0.33×10⁻⁶ g⋅ cm-2⋅ s-1 and oxygen transmittance of merely 0.28% during oxidation at 1700∘C. Wu et al. [142] reported that HfB2-SiC coating subjected to 1200∘C film-forming treatment exhibited active and inert factor values of 0.151 and 0.953×10⁻⁶g⋅cm-2⋅ s-1, respectively, indicating minimal formation loss. Extended treatment duration to 360 min improved the protective efficiency to 99.13% and reduced oxygen permeability by 79.6%, effectively suppressing oxidation activity. Chen et al. [157] observed that the preoxidation of TaB2-SiC coatings at 1500∘C reduced active and inert factor values by 43.12% and 17.33%, respectively, thereby enhancing dynamic stability during oxidation. Wang et al. [158] found that preoxidized WSi2-HfB2-SiC/SiC coatings provided oxidation protection for C/C substrates in air at 1973 K for 110 h, attributed to the formation of a protective multiphase glass layer from oxidation products. Zhu et al. [159] developed a composite glass coating through pre-oxidation of porous HfSi2-SiC-Si, featuring uniformly distributed micropores and Hf oxides. At 1773 K, the coating exhibited synergistic oxidation resistance through a dual-layer structure comprising a microporous outer layer and dense inner layer. At 1973 K, uniform distribution of Hf oxides effectively reduced SiO2 volatilization, resulting in a mass loss of only 3.90wt\% after 45 h of oxidation. (Fig. 30)
The pre-oxidation treatment technology achieves the goal of generating high-quality glass layers with lower coating consumption. However, with the increasingly harsh application environment of carbon-based composites, it is urgent to further reduce the film formation consumption of coatings to improve the stability of coating structures.
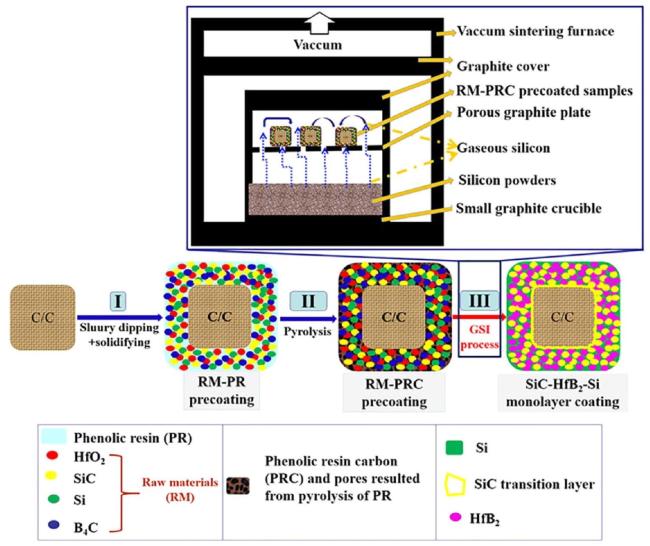
Fig. 28. Schematic diagram of the combined slurry dipping (SD) and gaseous silicon infiltration (GSI) process for preparing a single-layer SiC-HfB 2-Si coating on C/C composites. Reproduced with permission from Ref. [153], © Elsevier 2020. |
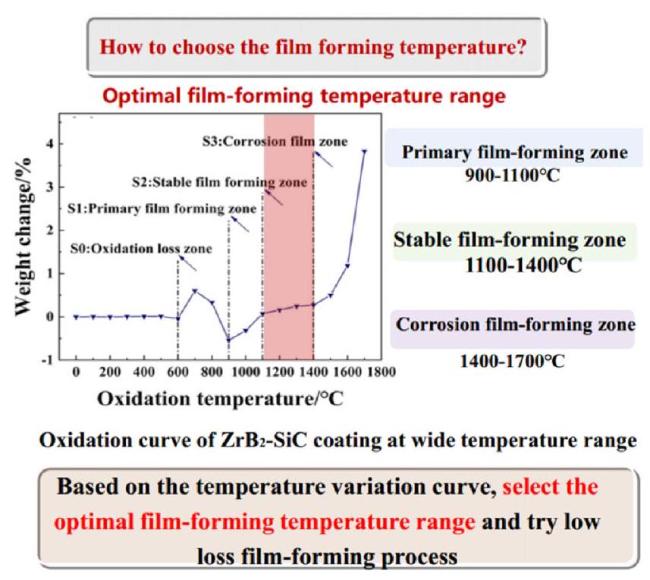
Fig. 29. Weight change curve of the ZrB2-SiC ceramic standard specimen during oxidation from room temperature to 1700∘C. Reproduced with permission from Ref. [155], © Elsevier 2022. |
6.3. Micro-zone repair
Considering the dynamic evolution of oxygen-blocking structures in coatings during service, enhancing their dynamic protective capabilities in harsh environments requires excellent self-healing properties. Based on the self-healing mechanisms, coatings are primarily categorized into extrinsic and intrinsic self-healing types [160]. Extrinsic self-healing coatings incorporate active repair material carriers within the coating matrix. Upon coating damage, these carriers release healing agents or corrosion inhibitors to fill damaged areas, achieving autonomous repair. For instance, Wang et al. [161] utilized polysiloxane and SiC-ZrB2 powder as repair agents to generate Si-O-C ceramics through high-temperature treatment for repairing damaged SiC-ZrB2/SiC coatings. The repaired coating exhibited significantly reduced mass loss from 21.16% (damaged coating) to 2.4% after oxidation at 1500∘C for 360 min. Wang et al. [162] developed a double-layer repair system on damaged SiC-coated C/C composites using laser cladding technology, comprising a Sm-doped borosilicate glass outer layer and Si/SiC inner layer. The schematic diagram of the coating repair process is shown in Fig. 31. The enhanced laser absorption and reduced viscosity improved the coating thermal radiation performance, resulting in a 74.98% reduction in mass loss after oxidation at 1773 K for 10 h.
Intrinsic self-healing coatings utilize the inherent high reactivity of constituent powders to automatically repair minor damage, providing sustained substrate protection. Shi et al. [163] prepared ZrB2-MoSi2- SiC-Si coatings using self-propagating high-temperature synthesis (SHS) powder and gas-phase silicon infiltration (GSI) technology. Compared to coatings fabricated from commercial powders, SHS powder-derived coatings exhibited enhanced density (3.5 g/cm3 ) and superior structural integrity. After 62 h of oxidation at 1500∘C, the mass loss of the SHScoated samples was only 0.28%, representing a 32% improvement over commercial powder coatings. Zhang et al. [164] synthesized ZrB2 MoSi2 composite powder via SHS and fabricated ZrB2-MoSi2 coatings on graphite substrates using spark plasma sintering (SPS). Increasing MoSi2 content (20vol\%-40vol\% ) enhanced dispersion of transition metal oxide nanocrystal in the glass layer, improving viscosity, and strengthening the composite glass layer blocking effect during inert oxidation. Coatings prepared with SHS powder demonstrated the lowest oxygen permeability, reaching only 0.3%. Shi et al. [165] fabricated HfB2-HfSi2-SiC coatings on carbon substrates combining SHS and SPS techniques. Fig. 32 illustrates the in-situ micro-area selfhealing process of the HfB2-HfSi2-SiC coating during oxidation [165]. The non-equilibrium bonding of SHS-derived boride-silicide alloyed powder enabled uniform micro-nano scale composite structures, significantly reducing film formation consumption at the microscale and achieving enhanced oxygen blocking.
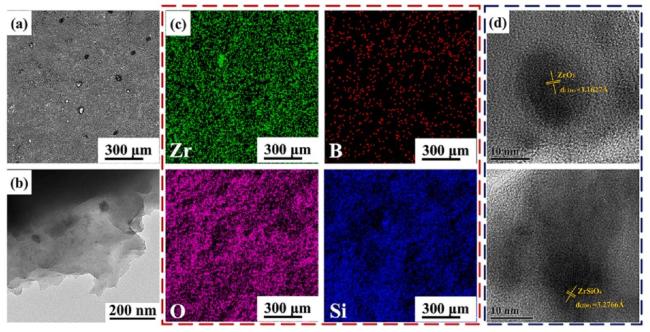
Fig. 30. (a) Surface SEM image and (b) TEM image of the ZrB2-SiC coating after 1200∘C,120 min film formation treatment; (c) EDS surface scan map corresponding to (a); (d) high-resolution TEM image corresponding to (b). Reproduced with permission from Ref. [155], © Elsevier 2022. |

Fig. 31. Schematic diagram of the coating repair process for C/C composites. Reproduced with permission from Ref. [162], © Elsevier 2022. |
Micro-zone repair relies on passive triggering of external carriers and intrinsic activity self-drive to achieve dynamic protection, but it is difficult to achieve both repair efficiency and long-term stability. In the future, it is necessary to break through the collaborative bottleneck of "targeted transport of repair agents and in situ bonding reconstruction", and build a fast response repair network.
7. Evaluation methods
UHTC coatings operate in extreme environments for extended periods, where their oxidation behavior is influenced by multiple factors including severe temperature gradients, variations of oxygen partial pressure, water-oxygen coupling and thermomechanical shocks. These environmental dependencies significantly affect oxidation evolution, kinetics, damage accumulation, and protective efficiency under various service conditions [166]. Therefore, addressing the evaluation requirements of coatings under various operating conditions and precisely analyzing the mechanism of oxidation behavior are crucial for optimizing the design of coating structure and enhancing long-term service stability.
7.1. Static oxidation
Static oxidation testing represents a fundamental methodology for evaluating the oxidation resistance of the coatings, which effectively characterizes their protective performance under controlled environmental conditions. This approach enables comprehensive assessment of oxidation kinetics at constant elevated temperatures, identification of oxidation product phases, and evaluation of structural stability mechanisms, providing crucial insights for research of coating performance and practical applications.
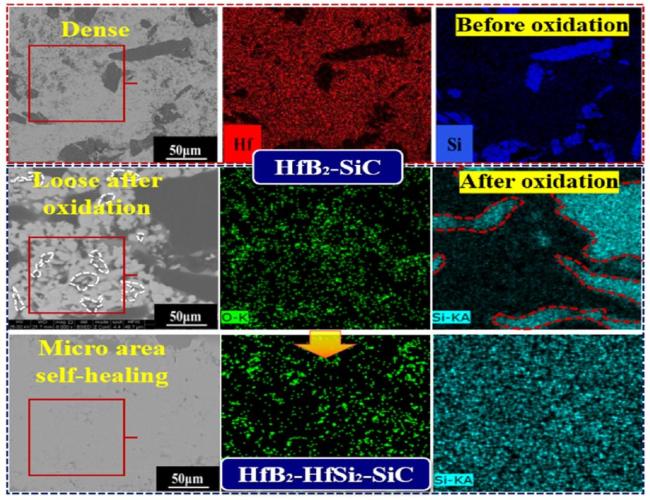
Fig. 32. In-situ micro-area self-healing during oxidation of HfB2-HfSi2-SiC coating prepared by SHS +SPS. Reproduced with permission from Ref. [165], © Elsevier 2023. |
7.1.1. Air oxidation
Air oxidation testing serves as a fundamental evaluation method in static oxidation studies, where oxidation kinetics and product evolution determine the oxidation resistance mechanisms and long-term stability of coatings. Recent advancements in understanding oxidation dynamics and glass-phase stability under air exposure have significantly contributed to enhancing the durability of the coatings for extended service lifetimes.
Ren et al. [167] fabricated a TaxHf1-xB2-SiC coating on SiC-coated C/C composites using an in-situ reaction method. The coating demonstrated exceptional oxidation protection for the C/C substrate at 1773 K in air, with a mass loss of only 2.8×10⁻³ g/cm2 after 1480 h of oxidation (isothermal oxidation curve shown in Fig. 33). Ta and Hf oxide "precipitated phases" within a composite glass layer, comprising an outer Ta-Si-O complex silicate layer and inner SiO2 glass layer, significantly enhanced oxidation resistance. Wang et al. [168] prepared an SiC inner coating and a CrSi2-HfB2-SiC outer coating on C/C substrates viain-situreaction. The coating containing 15wt\%Cr exhibited remarkable oxidation protection at 1973 K in air for 415 h with only 1.6% mass loss, attributed to the formation of highly stable and oxi-dation-resistant Cr-Si-O and Hf-Si-O glass phases. Jiang et al. [152] developed single-phase ultra-high-temperature boride (ZrB2 or TaB2 )modified Si-SiC coatings on graphite substrates using a combination of impregnation and reactive infiltration. After 1200 h of oxidation in air at 1500∘C, the mass losses of graphite substrates coated with ZrB2-SiC- Si and TaB2-SiC-Si were 0.086% and 0.537%, respectively. Zhou et al. [169] fabricated a dense double-layer HfB2-SiC/SiC coating with an embedded structure using a combination of impregnation, carbonization, and pack cementation. The coating exhibited only 1.65% mass loss after oxidation at 1700∘C for 156 h in air, due to the formation of a continuous, interwoven Hf-Si-O glass layer. In addition, Zhou et al. [170] also designed and prepared a dense double-layer ZrB2-SiC-Si/SiC- Si coatings with high ZrB2 content through combined impregnation, carbonization, and gaseous silicon infiltration. The coating protected C/ C substrates for 500 h at 1773 K in air with 1.14% weight gain, attributed to ZrSiO4/ZrO2 "pinning" phases and compressive stress fields around ZrB2 particles promoting dense composite silicate oxide layer formation. Pourasad et al. [78] in-situ synthesized a SiC/SiC-ZrB2 coating on graphite surfaces using a novel embedding cementation technique. The dense and low-oxygen-permeability ZrSiO4 glass film formed on the coating surface effectively protected the graphite from significant damage during 10 h of oxidation in air at 1773 K.

Fig. 33. Isothermal oxidation curve of the coated C/C composite in air at 1773 K. Reproduced with permission from Ref. [167], © Elsevier 2014. |
The air oxidation test provides a benchmark for screening antioxidation coating systems by revealing oxidation kinetics and product evolution, but a single temperature field test is difficult to simulate extreme conditions such as thermal shock and oxygen pressure fluctuations. In the future, it is necessary to analyze the multi field coupling failure mechanism and optimize environmental adaptability, promoting the upgrade of the coatings from a single oxidation resistance target to a synergistic protection of thermal-mechanical-oxygen coupling environment.
7.1.2. Water-oxygen environment
Compared to air oxidation, water-oxygen (H2O+O2 ) environments present more complex challenges to oxidation reactions and glass phase stability, primarily due to the high-temperature chemical activity of water vapor [171]. The underlying mechanisms and control strategies of these effects remain critical areas requiring comprehensive investigation in current coating oxidation resistance research. Jiao et al. [172] developed HfB2-SiC/SiC coatings on C/C composites through slurry spraying and heat treatment. After 60 h of corrosion in dry oxygen at 1500∘C, the coating formed a SiC-HfO2-HfSiO4-SiO2 ceramicembedded glass composite layer with a mass gain of 2.98mg/cm2. However, exposure to 90H2O-10vol\%O2 environment under identical conditions resulted in mass loss of 1.12mg/cm2, as water vapor disrupted the continuity of the surface SiO2 glass layer, accelerating corrosion. Zhang et al. [173] fabricated SiC ceramic coatings on C/C composites via pressureless reactive sintering. In 50H2O-50 vol \%O2 environment at 1773 K for 720 -minute water-oxygen corrosion, the coating exhibited weight gain (0.24-0.31 g/cm2 ) approximately double that observed in oxygen-only conditions, with increases correlating to water vapor content. The enhancement stemmed from hydroxyl groups bonding with Al and Si atoms in the glass oxide layer, weakening Si-O and Al-O bonds. These weakened bonds subsequently ruptured during atomic thermal motion, accelerating oxidizing gas diffusion and dissolution. Guo et al. [174] synthesized MoSi2-CrSi2-Si/SiC multi-component coatings on C/C composites using a two-step embedding method. After 10 h of oxidation in a 50H2O-50vol\%O2 environment at 1773 K, water vapor significantly reduced the protective capability of the glass layer formed by SiO2 and Cr2O3, exacerbating the oxidation of coating components and resulting in a weight loss of 0.436%. Li et al. [175] developed Si coatings on graphite surfaces through plasma spraying. After 300 h of corrosion in a 90H2O-10vol\%O2 environment at 1300∘C, the thicknesses of thermally grown oxides (TGO) on as-deposited Si coatings, polycrystalline Si, and single-crystal Si surfaces reached approximately 11.5μ m,22.1μ m, and 11.2μ m, respectively (Fig. 34). Coating defects such as pores and cracks in the deposited Si coating provided rapid diffusion pathways for oxygen and water vapor, accelerating oxidation and corrosion of Si. However, during solid-state sintering, reduced porosity in the Si coating prevented further diffusion of oxygen and water vapor, thereby enhancing its oxidation protection. Zhao et al. [176] prepared silicon carbide coatings on graphite substrates using chemical vapor deposition (CVD). The coating provided effective oxidation protection for 140 s at temperatures below 1300∘C with 3.1MW/m2 water vapor flux, beyond which significant coating delamination occurred. Yang et al. [177] coated graphite spheres with multi-layer silicon carbide via a multi-layer SiC encapsulation technique. The multi-layer porous SiC coatings with porosity below 0.16% ensured that graphite spheres resisted oxidation for at least 10 h in water vapor mixtures at 1673 K without failure.
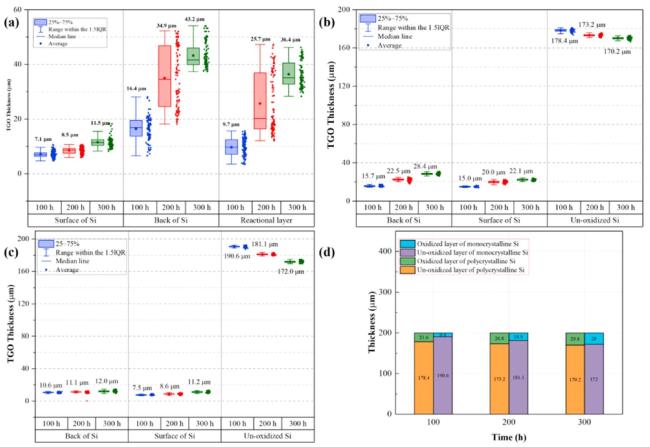
Fig. 34. Thickness measurements of thermally grown oxide (TGO) layers on three Si specimens after water vapor corrosion at 1300∘C : (a) APS-deposited Si coating; (b) polycrystalline Si; (c) single-crystal Si; (d) thickness comparison between unoxidized and oxidized crystalline Si. Reproduced with permission from Ref. [175], © Elsevier 2025. |
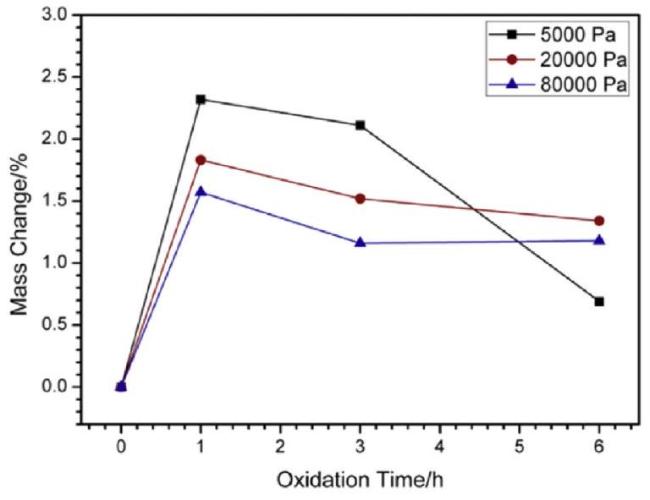
Fig. 35. Oxidation curves of coated samples at 1773 K under different OPP conditions. Reproduced with permission from Ref. [124], © Elsevier BV 2016. |
Tests have confirmed that high-temperature water vapor deteriorates the glass phase through hydroxylation erosion and gas film permeation. Therefore, the water oxygen coupling environment will exacerbate the destructive evolution of the coating during service. In the future, it is necessary to further improve the effectiveness of the dynamic water oxygen and temperature synergistic loading platform in simulating real scenarios of aircraft engines (water oxygen concentration and temperature transients occurring within seconds).
7.1.3. Influence of oxygen partial pressure
Oxygen partial pressure (OPP) represents a fundamental factor governing high-temperature oxidation behavior, influencing not only oxide morphology and glass phase fluidity but also determining long-term oxidation protection performance of the coating. Recent research has increasingly focused on understanding the effects of varying OPP on the oxidation behavior of coatings [178]. Li et al. [124] fabricated SiC-ZrB2-ZrC coatings on C/C composites through pack cementation and evaluated their oxidation performance at 1773 K under various OPP conditions (oxidation curves shown in Fig. 35). The coating demonstrated effective oxidation protection for C/C composites exceeding 6 h under high OPP at 1773 K, exhibiting a mass change of 1.34%. The investigation revealed a significant microstructural evolution with increasing OPP: fibrous ZrO2 particles gradually transformed into aggregated ZrO2 particles, facilitating the formation of a denser SiO2 glass layer. Consequently, the densified structure effectively healed microcracks generated during the oxidation process. Li et al. [179] developed SiC/ZrSiO4-SiO2 (SZS) coatings on C/C composites utilizing a combination of pack infiltration, slurry coating, and sintering techniques. The coating exhibited remarkable oxidation resistance under varying OPP conditions. Under low OPP at 1500∘C, the coating demonstrated minimal mass gain of 0.54% after 111 h of exposure. Under high OPP conditions (36 L/h air flow), the coating maintained exceptional stability with mass loss below 0.03% after 50 h of oxidation.
Different oxygen partial pressure tests have elucidated their regulatory mechanisms on the morphology of the oxide layer and the flowability of the glass phase (such as high oxygen partial pressure promoting self-healing of the dense layer). However, current tests are mostly limited to static oxygen partial pressure conditions and cannot simulate the synergistic effect of transient variations in oxygen partial pressure and thermal stress under the service conditions of aerospace vehicles. It is urgent to develop a dynamic oxygen diffusion and stress coupling model under oxygen partial pressure fluctuations to provide guidance for the design of multi-level oxygen barrier structures in coatings.
7.2. Dynamic oxidation
Dynamic oxidation refers to chemical reactions between coatings and oxygen under fluctuating temperature conditions. Unlike static oxidation, dynamic oxidation environments present complex challenges where coatings need to maintain structural and functional stability while confronting both oxygen erosion and thermal cycling effects [180].
7.2.1. Thermogravimetric analysis and wide-temperature-range oxidation
The oxidation kinetics of coatings across broad temperature ranges are governed by the interplay between evolving thermal gradients and modifications in oxygen transport pathways. Accurate characterization of oxidation characteristics under non-isothermal conditions is essential for understanding wide-temperature-range oxidation mechanisms. Li et al. [29] fabricated a multiphase double-layer ZrB2-CrSi2-SiC-Si/SiC coating on carbon/carbon composites through pack cementation. Thermogravimetric analysis (TGA) from room temperature to 1500∘C revealed minimal mass gain of 2.10%, attributed to the formation of a composite glass layer comprising ZrO2,Cr2O3,SiO2, and SiC oxidation products, effectively sealing oxidation-induced microcracks. Liu et al. [181] developed Y2O3-modified ZrSi2/SiC coatings via supersonic atmospheric plasma spraying (SAPS). The coating exhibited a 30% mass increase during heating to 1400∘C, where Y2O3 stabilized ZrO2 phase transitions and promoted the crystallization of Y2Si2O7/Y2SiO5 phases, thereby significantly enhancing oxidation resistance. Ren et al. [182] synthesized HfB2-20wt\%SiC coatings through liquid-phase sintering. Oxidation experiments revealed that the Hf-B-Si-O glass layer formed at 1500∘C effectively inhibited oxygen diffusion, resulting in a minimal final mass gain of 0.23%. Zhu et al. [183] designed a B2O3-rich glass composite coating through low-temperature slurry impregnation-densification, achieving broad-spectrum oxidation resistance. During thermogravimetric analysis from room temperature to 1773 K, the coated specimen demonstrated exceptional non-isothermal oxidation resistance with 98.19% mass retention.
As a supplement to these findings, Jiao et al. [184] engineered a SiC/ glaze precursor coating via molecular precursor infiltration to enhance the oxidation protection of C/C composites across a wide temperature range. The oxidation curve of the SiC/ glaze precursor-coated specimen in air from room temperature to 1600∘C is shown in Fig. 36. The coating exhibited oxidation protection initiation at approximately 560∘C, with oxidation behavior primarily controlled by oxygen diffusion processes, demonstrating excellent oxidation resistance and self- healing capabilities across broad temperature ranges. Wang et al. [185] fabricated ZrB2-SiC-LaB6 coatings via spark plasma sintering (SPS) and evaluated their oxidation resistance performance under dynamic temperature conditions. From room temperature to 1700∘C, the coating achieved 95.9% protection efficiency with a minimal mass gain of 8.56×10⁻⁵ g/cm3. Jiang et al. [186] successfully developed a dense MoSi2-SiC-Si coating on a graphite substrate through slurry impregnation and vapor silicon infiltration. Dynamic oxidation testing from room temperature to 1500∘C revealed two distinct stages: negligible mass changes up to 900∘C due to slow oxidation kinetics, followed by rapid oxidation of MoSi2,SiC and Si from 900-1500∘C, resulting in a final mass gain of 2.25%. Chu et al. [187] fabricated SiC nanowire-toughened CrSi2-SiC-Si coatings on C/C composites through combined chemical vapor deposition and pack cementation. The nanowire-toughened coating exhibited exceptional oxidation resistance from room temperature to 1500∘C, maintaining a maximum mass loss of only 2.55%. Zhang et al. [98] investigated the effect of volume ratios between HfB2 and TaB2 on the oxidation resistance of HfB2-MoSi2-TaB2 coatings. Over a temperature range of 300-1700∘C, the optimized coating containing 15vol\%TaB2 extended the initial oxidation temperature from 300 ∘C to 500∘C, reducing dynamic oxidation loss by 75.85% compared to the 60HfB2-40MoSi2 coating. Zhu et al. [188] densified a porous SiC-ZrSi 2 pre-coating using in-situ generated SiO2 glass, producing a gradient composite coating with a dense outer layer and a microporous intermediate layer. During dynamic oxidation testing from 573 K to 1773 K, the gradient coating demonstrated enhanced mass retention, improving from 62.9% (pure SiC coating) to 97.94%.
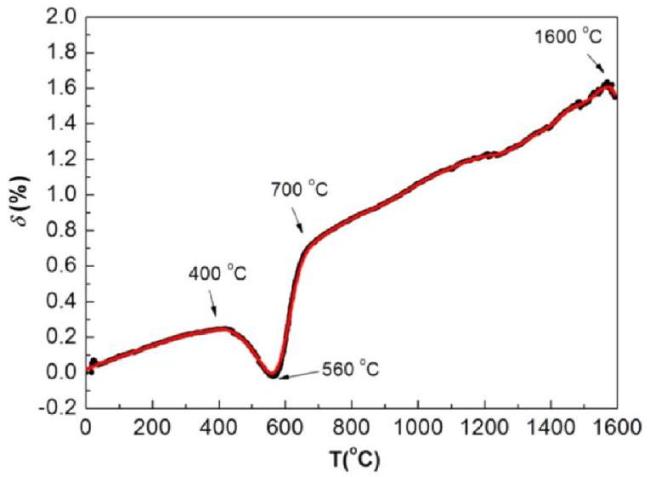
Fig. 36. Oxidation curve of SiC/ glaze precursor-coated samples in air from room temperature to 1600∘C. Reproduced with permission from Ref. [184], © Elsevier 2017. |
The existing thermogravimetric and wide temperature range oxidation tests have verified the nonlinear relationship between the self-healing ability of coating oxide films under temperature gradients and temperature. However, the linear temperature change mode is difficult to reproduce the transient competition mechanism of thermal shock and oxidation coupling during space reentry, which limits the accuracy of predicting the oxygen diffusion path of coatings under extreme thermal gradients.
7.2.2. Thermal shock and cyclic oxidation
Under extreme service environments, coatings experience severe temperature fluctuations and cyclic thermal shocks, leading to interfacial crack propagation, glass phase reconstruction, and structural instability. Researchers have systematically investigated composition optimization, interface control, and microstructural enhancement to improve coating stability under cyclic thermal shock conditions [189]. Wang et al. [75] synthesized HfB2-modified SiC coatings on C/C composites with varying HfB2 content (7.3-31.5 wt\% ) via in-situ reactions. Thermal shock resistance exhibited a peak-valley trend with increasing HfB2 content. After 30 thermal cycles, the optimized 18.2wt\%HfB2 modified SiC coating demonstrated a 25.8% reduction in mass loss compared to unmodified coatings. This enhancement resulted from the formation of an Hf-Si-O glass layer during oxidation, improving coating stability and reducing oxygen permeability, thereby enhancing oxygenblocking performance. Hu et al. [190] performed thermal cycling test between 1500∘C and room temperature on the SiC coated carbon/ carbon composites with monolayer MoSi2 and MoSi2/Cr multilayers in Fig. 37. Finite element analysis (ANSYS19.0) was used to simulate the particle impact and thermal shock processes, and the impact stress and thermal stress distribution of the laminate coating in the particle structure and thermal shock environment were evaluated. The Cr metal layer effectively alleviates the crack deflection of MoSi2 at high temperatures in the hard and brittle phase, reduces the stress concentration at the interface, reduces the propagation of vertical cracks, and alleviates the intrusion of oxygen. Chu et al. [191] fabricated SiC nanowirereinforced SiC-Si oxidation resistance ceramic coatings on C/C composites through a two-step process combining chemical deposition and hot-press reactive sintering. The uniform distribution of SiC nanowires significantly enhanced the toughness and thermal shock resistance of the coating. After 30 thermal cycles between 1773 K to room temperature, the nanowire-reinforced coating exhibited superior oxidation resistance with only 2.41% mass loss, compared to 4.14% for pure coatings. Qiang et al. [192] prepared in-situ SiC nanowire-enhanced SiC (SiCNWs-SiC) coatings on C/C composites via CVD. The incorporation of SiCNWs improved deposition efficiency, increasing flexural strength increasing from 107.2 MPa to 134.3 MPa and bonding strength from 6.74 MPa to 14.18 MPa. After 30 thermal shock cycles, the coated specimen demonstrated enhanced oxidation resistance with 2.5% mass loss, significantly lower than the 6.2% observed in pure SiC coatings. Wang et al. [46] incorporated SiC whiskers (SiCw) into HfB2-SiC-Si/SiC coatings via CVD. The SiCw-HfB2-SiC-Si/SiC coating exhibited superior oxidation protection with 4.48% mass loss after 50 thermal oxidation cycles, outperforming unmodified coatings. The enhanced performance was attributed to the SiC whiskers mitigating thermal expansion coefficient mismatch and suppressing crack propagation through toughening mechanisms such as whisker pull-out and crack bridging. The temperature and thermal stress distribution during thermal cycling for the SiCw-HfB2-SiC-Si/SiC-coated C/C composites are shown in Fig. 38. Lee et al. [193] applied dense SiC and HfC coatings to C/C composites and evaluated their thermal shock resistance under cyclic conditions (500∘C,1000∘C,1350∘C to room temperature). Coated composites demonstrated enhanced oxidation resistance compared to uncoated ones, though mass loss increased with testing temperature. Notably, HfC-coated composites maintained over 40% coating retention even after five cycles at 1500∘C. Wang et al. [100] fabricated ZrB2-LaB6-SiC coatings on graphite substrates via spark plasma sintering (SPS) method. The coating containing 3wt\%LaB6 demonstrated optimal oxidation resistance, maintaining structural integrity and 97.7% oxidation protection efficiency through 20 thermal cycles.
Thermal shock and cyclic oxidation testing provide key evaluation criteria for the synergistic performance of coatings against thermal shock and oxidation. However, existing methods lack sufficient characterization of the temporal interaction and multi field coupling mechanism of thermal shock and oxidation corrosion, which restricts the life prediction and optimization design of coatings under extreme thermal-oxygen alternating conditions in space.
7.2.3. Wind tunnel testing
In hypersonic flight and re-entry vehicle service environments, oxidation-resistant coatings are required to withstand high-temperature airflow erosion, intense thermal shock, and complex aerodynamic loads, presenting conditions challenging to replicate through conventional experiments. Wind tunnel testing has emerged as a critical methodology for evaluating the resistance of coatings to oxidation, ablation and thermal shock conditions [194].
Du et al. [195] developed an innovative hybrid thermal protection system combining TaSi2-based coating on carbon-bonded carbon fiber (CBCF) composites with mullite fiber insulation tiles. Wind tunnel evaluations revealed surface temperature variations between 400∘C and 1200∘C under low heat flux and dynamic pressure conditions. However, under high heat flux and dynamic pressure, rapid surface temperature elevation to 1400∘C resulted in coating deterioration. Feng et al. [196] synthesized Mo-Si-Cr coatings on C/C composites via pack cementation and investigated their high-temperature erosion behavior in a wind tunnel. The self-healing SiO2 glass layer formed above 1300 K enabled sustained erosion resistance for 92 h at 1873 K. Zhang et al. [197] fabricated SiC coatings via in-situ reactions and evaluated them in a 200-1600∘C gradient wind tunnel environment. The dense SiO2 layer formed in high-temperature regions enhanced oxygen-blocking capabilities, extending the effective oxidation protection of C/C composites to 44 h. Qiang et al. [198] designed a multilayer SiC nanowirereinforced SiC (SiCNWs-SiC ) coating via CVD. The coating demonstrated exceptional oxidation resistance at 1873 K in high-temperature wind tunnel testing, sustaining protection for 130 h with minimal mass loss (1.1% ), attributed to nanowire-enhanced crack suppression and SiO2 layer formation. Fu et al. [199] prepared multilayer SiC/Si-Mo-Cr/MoSi2 coatings via pack cementation and SAPS methods. During hightemperature wind tunnel testing at 1873 K (as shown in Fig. 39), the coatings maintain substrate protection for 124 h, demonstrating remarkable thermal stability. Xu et al. [200] created a double-layer ZrB2 based ceramic coating comprising ZrB2,MoSi2,SiC whiskers, and borosilicate glass on carbon fiber composites via trace oxygen sintering. High-frequency plasma wind tunnel tests demonstrated the excellent ablation resistance of the coatings under a heat flux of 1.3MW/m2, stagnation pressure of 1.2 kPa, and 800 s of exposure. Xu et al. [201] fabricated a ZrC-SiC coating with a dual-layer oxidation structure via pack infiltration and vacuum plasma spraying. At elevated temperatures, the coating formed a compatible oxide film combining ZrO2 skeleton with SiO2 or Zr-Si-O glass. After 1000 -second exposure in a 2200∘C arc-heated wind tunnel, the coating exhibited a mass ablation rate of -1.9×10⁻²mg/cm2⋅ s and a linear ablation rate of 2.9×10⁻⁵mm/s. Xu et al. [202] further developed a self-sealing CBCFs/ ZrB2 ceramic composite coating via trace oxygen sintering and pre-oxidation. The coating demonstrated exceptional ablation resistance during high-frequency plasma wind tunnel testing under conditions of 1000 s exposure time, heat flux density of 131.8 W/cm2, and stagnation pressure of 2.7 kPa. Zhao et al. [176] prepared SiC anti-oxidation coatings using chemical vapor deposition (CVD) technology. In a 1 MW inductively coupled plasma wind tunnel, it was observed that the oxidation weight loss rate at a surface temperature near 1560∘C was approximately 5μ m/min, demonstrating favorable ablation resistance performance. Chen et al. [203] prepared bulk SiC specimens through pressureless sintering. In high-frequency plasma wind tunnel tests, atomic oxygen dominated the oxidation reaction, significantly reducing the apparent activation energy. The oxide layer thickness increased by 20 nm within 300 s, with a linear increase in quality without showing signs of saturation.
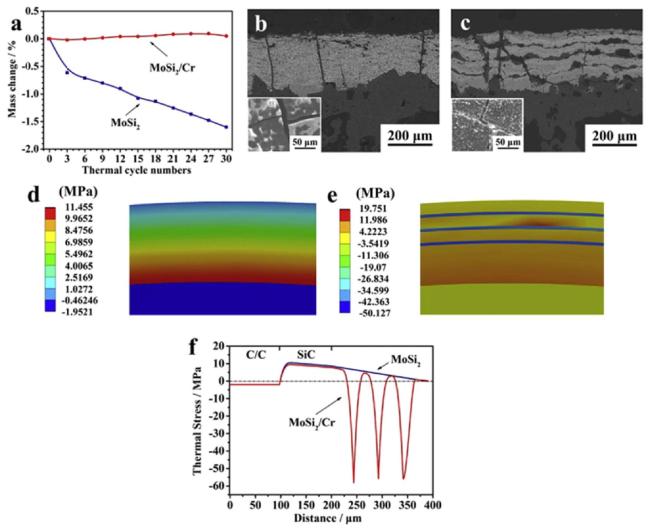
Fig. 37. Experimental and simulation results under thermal shock environment: (a) mass change curves of the coated samples with monolayer MoSi 2 coating and with laminated MoSi2/Cr coating after 30 thermal cycles; (b) BSE image of monolayer MoSi2 coating (inset of figure is the surface view of (b)) and (c) BSE image of laminated MoSi2/Cr coating along the cross-section (inset of figure is the surface view of (c)) after thermal shock test; (d) and (e) stress distribution diagram along the cross-section of monolayer MoSi2 coating and laminated MoSi2/Cr coating during a thermal cycle; (f) stress distribution curves through the thickness of the coating and substrate under thermal shock environment. Reproduced with permission from Ref. [190], © Elsevier 2020. |
In summary, the wind tunnel significantly improves the working condition proximity and data reliability of coating anti erosion performance evaluation through high enthalpy heat flux aerodynamic shear multi field coupling loading. However, its ability to reproduce transient extreme working conditions still needs further improvement.
7.3. High oxygen-blocking evaluation
Traditional evaluation methods face data distortion arising from simultaneous substrate oxidation mass loss and coating oxidation mass gain (as shown in Fig. 40). To address this limitation, a novel high oxygen-blocking evaluation system has been developed (as shown in Fig. 41), and system distinguishes between two primary protection mechanisms: structural oxygen blocking and glass layer passivation blocking. The approach enables quantitative characterization and provided deeper insights into coating oxygen-blocking capabilities.
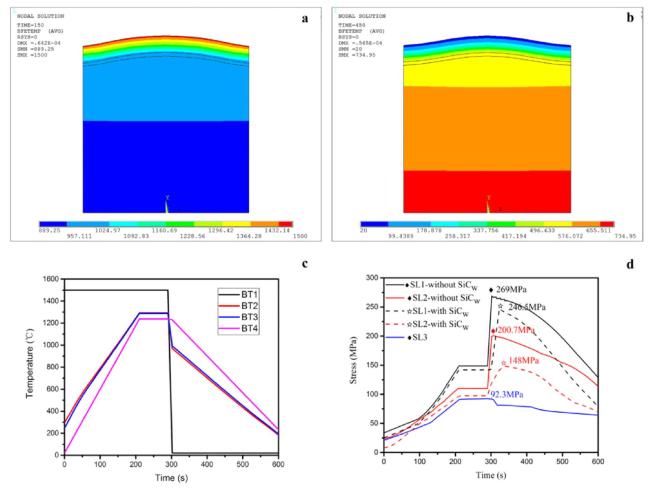
Fig. 38. Temperature and thermal stress distribution in coated C/C composites. Reproduced with permission from Ref. [46], © Elsevier 2018. |
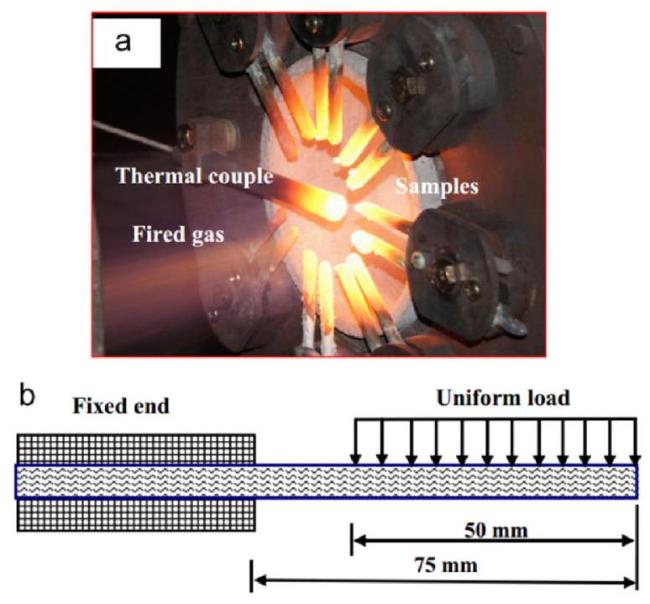
Fig. 39. Macroscopic images and cantilever beam model of coated samples in wind tunnel. Reproduced with permission from Ref. [199], © Elsevier 2015. |
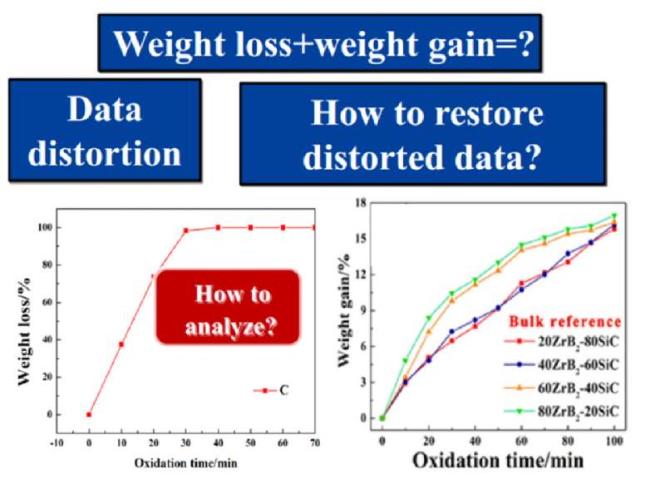
Fig. 40. Data distortion in traditional evaluation methods. Reproduced with permission from Ref. [143], © Elsevier 2021. |
Qian et al. [204] prepared La2O3-modified HfB2-SiC coatings via SPS. The incorporation of 5vol\%La2O3 enhanced both structural and passive oxygen-blocking properties through the formation of stable Hf-B-La-Si-O multiphase glass at 1973 K. This modification reduced oxygen permeability from 2.21% to 1.54% and lowering the maximum mass change rate from 28.24×10⁻⁶ to 7.35×10⁻⁶ g⋅ cm-2⋅ s-1. Zhang et al. [106] fabricated HfB2-SiC-TaSi2 coatings via spark plasma sintering (SPS). During oxidation at 1700∘C,TaSi2(20wt\%) oxidation induced moderate volume expansion, effectively suppressing HfB2 loosening and enhancing structural oxidation resistance. The coating protection efficiency demonstrated composition dependence: for Hf/Ta- oxide content below 50vol\%, efficiency increased progressively to 99.69% with increasing content, whereas content exceeding 50vol\% resulted in reduced efficiency of 93.7%. Ren et al. [143] optimized ZrB2-SiC coatings via SPS. The 60ZrB2-40SiC coating exhibited superior oxygen-blocking performance, achieving 1.77% oxygen permeability and 97.7% protection efficiency. This improvement was attributed to the formation of ZrO2 nanocrystals, which broadened crystalline regions and increased the viscosity of the glass layer, thereby enhancing the resistance to oxidation of the coatings.

Fig. 41. High oxygen-barrier evaluation system. Reproduced with permission from Ref. [143], © Elsevier 2021. |
In summary, the interference of carbon matrix oxidation loss on the evaluation of high oxygen resistance performance of coating materials has constrained the development and service of surface coatings for carbon-based composites. Based on the relative method, a high oxygen resistance evaluation method is provided to separate and analyze the service behavior and oxygen resistance ability of coating materials, providing a key quantitative basis for component screening and system design of coatings. However, due to the multi-scale non-uniformity of composite materials and the dynamic diversity of oxygen diffusion pathways, the existing evaluation system still lacks adaptability to complex working conditions. In the future, it is necessary to establish a standardized oxidation test process and a multi parameter coupled evaluation model to achieve a full life cycle assessment of coating oxygen blocking performance.
8. Conclusions and outlook
Recent developments in ultrahigh-temperature ceramic coatings for carbon-based composites have demonstrated significant progress. This review comprehensively examines key research areas, including coating architecture design, fabrication techniques, coating systems, oxide glass film engineering, coating treatment methods, and oxygen blocking evaluation approaches, while analyzing the advantages and limitations of current technologies. Beyond this, particular attention is devoted to previously underexplored functional mechanisms, including the regulation of oxidation-induced glassy phases, micro-zone self-healing at the mesoscopic scale, and a relative-method-based framework for evaluating high oxygen resistance-perspectives which enrich conventional classification-focused reviews and offer guidance for system-level coating design. However, increasing performance requirements in aerospace, nuclear energy, and related fields have revealed persistent bottlenecks in existing technologies. These challenges necessitate breakthroughs in three critical areas: (1) optimization of multiscale material architectures, (2) precision control of atomic-level processes, and (3) standardization of durability evaluation protocols.
8.1. Current challenges
Thermophysical compatibility issues between coating and substrate.
The significant mismatch in thermal expansion coefficients between carbon-matrix composites and ultrahigh-temperature ceramic coatings induces interfacial stress accumulation during thermal cycling. This stress accumulation can precipitate crack initiation and eventual delamination, severely compromising the coating's operational lifespan. While mitigation strategies such as graded architectures and nanowire reinforcement have partially alleviated these thermomechanical stresses, achieving optimal interfacial adhesion strength and high-temperature durability under cyclic loading conditions remains a persistent challenge.
Long-term oxidation protection failure at ultra-high temperatures.
Existing ultrahigh-temperature ceramic coatings operating above 1800∘C are prone to degradation due to volatilization and viscosity reduction of borosilicate-based glass films formed during oxidation. Despite enhanced thermal stability of the glass film through transition metal and rare earth oxide modifications, high-temperature creep induces stress redistribution within coatings, accelerating failure and compromising long-term oxidation protection performance.
Limited adaptability to complex service environments.
Actual service environment often involves multiple coupled factors including high temperature, oxidation, high-speed air wash, and thermal shock. Current coating system struggles to simultaneously address these complex environmental demands. For instance, in the highspeed airflow erosion can strip away protective oxide films, reducing the coating's effectiveness. Similarly, thermal shock can damage the interfacial bonding between the coating and substrate. The coupling of these factors in real-world service conditions accelerates coating failure, highlighting the need for coatings with enhanced adaptability.
Limitations in coating fabrication processes.
Conventional techniques exhibit specific constraints: embedding methods present challenges in coating uniformity and thickness control; chemical vapor deposition involves extended processing times, complex equipment, and high costs while limiting coating thickness; slurry sintering introduces porosity defects; and plasma spraying yields inadequate interfacial bonding strength. Furthermore, the layer-by-layer preparation of multilayer composite coatings is complex, and ensuring interfacial compatibility is challenging. Existing fabrication processes struggle to balance coating performance with scalability and cost-effectiveness, limiting their practical application.
Incomplete performance evaluation systems.
Current evaluation methods, while simulating partial service conditions, inadequately represent actual operating environments, limiting accurate prediction of coating lifetime and performance under complex, variable service conditions. Additionally, the lack of standardized evaluation protocols for coating performance results in poor comparability between studies, hindering the development of universally accepted benchmarks for coating reliability.
8.2. Future challenges
(1) Coating stability under extreme thermo-mechanical-oxidative coupling
Future aerospace thermal protection systems require prolonged service under extreme conditions exceeding 2000∘C with highspeed airflow and severe thermal gradient loading. These conditions impose stringent demands on the thermal shock resistance, ablation resistance, and self-healing properties of coatings. A primary challenge lies in achieving dynamic oxidation protection under coupled thermal-mechanical-oxidative conditions.
(2) Development of environmentally sustainable manufacturing processes
The traditional fabrication methods exhibit high energy consumption and environmental impact, such as chemical vapor deposition using halide precursors, limiting industrial-scale production potential. While developing streamlined, cost-effective, and environmentally sustainable preparation technologies represents a future direction, optimization of process parameters and coating property control requires extensive investigation.
(3) Establishment of multiscale-multidimensional evaluation methods
Existing evaluation systems are incapable of fully capturing the complete scale of processes, from micro-defect formation to macroscale failures. There is an urgent need to develop cross-scale characterization techniques and simulation models that integrate multiple physical fields, enabling a more comprehensive understanding of coating performance under real-world service conditions.
8.3. Potential solutions and technological prospects
(1) Novel coating structures
Future advancements should focus on designing adaptive coatings capable of autonomously adjusting their structure and performance in response to changes in service environments. Inspiration can be drawn from biological materials, such as shell-like organic-inorganic alternating structures, honeycomb, and fish scale hierarchical configurations. Such bio-inspired multilevel interfaces enable "soft-hard" alternating gradient layers that mitigate thermal stresses through interfacial micro-region plastic deformation. Furthermore, cross-scale modeling frameworks should be established, integrating atomic scale (molecular dynamics simulation of diffusion process) and macroscopic scale (finite element analysis of thermal stress distribution) to guide the coating architecture design.
(2) Advanced manufacturing techniques
Exploration of novel fabrication processes and optimization of existing technologies are essential for achieving high-quality, cost-effective, large-scale coating production. For instance, strategies include integrating additive manufacturing with traditional coating techniques could enable rapid coating deposition on components with complex shapes; implementing laser beam-assisted in-situ synthesis for compositional gradients through precise parameter control and developing modular coating systems with customizable robotic spraying capabilities for enhanced uniformity on complex aerospace components.
(3) Improvement of coating performance evaluation system
Development priorities on performance evaluation systems should be advanced to replicate actual service environments by incorporating multi-physics coupled simulation platforms, where platforms should integrate oxidation kinetics, thermal gradient cycling, erosive flow dynamics, and transient thermomechanical loads. Concurrently, computational modeling frameworks should establish predictive relationships between coating architectures and durability metrics, providing a theoretical basis for performance-driven coating optimization. Furthermore, industry-academia collaborations should focus on developing standardized testing protocols that encompass static oxidation and dynamic erosion-oxidation methodologies, ensuring cross-study data verifiability, improving reliability, and accelerate the transition of coating technologies from research to practical applications.
8.4. Summary and outlook
Ultrahigh-temperature ceramic coating technology for carbon-based composites approaches a critical transition from laboratory research to industrial implementation. Future advancements require focused innovation across material-structure-process-evaluation domains to overcome extreme environment protection challenges. By leveraging the synergistic convergence of materials science, fracture mechanics, and advanced computational modeling, this technology holds the potential to achieve large-scale deployment in aerospace thermal protection components.
CRediT authorship contribution statement
Chengshan Ji: Resources, Methodology. Jun Zhao: Validation, Investigation. Huiqun Liu: Investigation. Guozheng Lv: Investigation.
Peizhong Feng: Supervision, Resources, Project administration. Xuanru Ren: Writing - review & editing, Writing - original draft, Methodology, Funding acquisition, Conceptualization. Peipei Wang: Writing - review & editing, Methodology, Formal analysis. Yuexing Chen: Writing - original draft, Visualization, Investigation. Wei Xie: Resources, Funding acquisition. Xiang Ji: Resources, Project administration. Zhichao Shang: Resources, Investigation.
Declaration of Competing Interest
The authors declared that they have no conflicts of interest to this work.