

1. Introduction
High-temperature components of aero-engines include turbine blades, turbine disks, and turbine combustors. These components face extremely harsh working conditions such as high temperature, high pressure, and high-speed during engine operation. As the primary materials for high-temperature components, nickel-based superalloys can withstand high-temperature oxidation, creep, and thermal fatigue, ensuring the reliable operation of the engines [1,2]. For gas turbines, higher gas inlet temperatures can directly enhance gas efficiency, thereby improving the thrust-to-weight ratio. The designed turbine inlet temperature of current aero-engines has reached 1500∘C, exceeding the limiting service temperature (≤1050∘C ) of the most advanced nickel-based superalloys [3,4]. Therefore, the quest for novel materials capable of exceeding the service temperature limits of nickel-based superalloys has emerged as an urgent and critical challenge. Refractory metals (RM) and their alloys are considered candidate materials for hot structure components due to their high melting points and high elevated-temperature strengths [5]. However, a critical limitation restricting their application in aerobic environments is that refractory metals and their alloys typically undergo oxidation before reaching their service temperatures, forming volatile or exfoliating oxides. Notably, material scientists have made an unexpected discovery: in refractory high-entropy alloys (RHEAs) containing Cr-Ta or Cr-Nb, the formation of ternary oxides (CrTaO4/CrNbO4) can significantly enhance the oxidation resistance of these materials [6,7].
In our previous work, the microstructure, mechanical properties, and thermal properties of CrTaO4 [8] and CrNbO4 [9] were systematically investigated. The results showed that the mechanical properties of CrTaO4 and CrNbO4 are highly comparable to those of yttria-stabilized zirconia (YSZ), the widely used thermal barrier coating material (TBC). The bulk modulus of the two ternary compounds (181 GPa and 180 GPa, respectively) is highly comparable to that of YSZ (176 GPa) [10]. Meanwhile, the room-temperature thermal conductivities of CrTaO4 and CrNbO4 are 1.31 W⋅ m-1⋅ K-1 and 1.09 W⋅ m-1⋅ K-1, respectively-both values are significantly lower than that of YSZ. The low thermal conductivity originates from the unique crystal structure of rutile, where only half of the octahedral sites in each layer along the c-axis are occupied by Cr3+/Ta5+/Nb5+ cations. On the other hand, for the ternary oxides CrTaO4/CrNbO4 (or solid solutions ${\mathrm{C}\mathrm{r}}_{0.5}{\mathrm{T}\mathrm{a}}_{0.5}{\mathrm{O}}_{4}/{\mathrm{C}\mathrm{r}}_{0.5}{\mathrm{N}\mathrm{b}}_{0.5}{\mathrm{O}}_{4}$ ), the significant mass difference between Ta/Cr or Nb/Cr atoms leads to a reduction in group velocity, thereby decreasing thermal conductivity. Thermal expansion coefficient analysis further reveals that CrTaO4(6.39×10⁻⁶/K) and CrNbO4(6.07×10⁻⁶/K) exhibit excellent thermal expansion matching with refractory metals such as $\mathrm{T}\mathrm{a}\left(6.3\times {10}^{-6}/\right.\mathrm{K}),\mathrm{N}\mathrm{b}\left(7.3\times {10}^{-6}/\mathrm{K}\right)$ [11] and ultra-high temperature ceramics like TaC (6.6×10⁻⁶/K ), ZrC(6.9×10⁻⁶/K) [12] within their service temperature ranges, endowing them with great application potential in high-temperature protection fields. Nevertheless, their mechanical properties still require optimization. For example, the Vickers hardness values of CrTaO4(12.20GPa) and CrNbO4(10.20GPa) are slightly lower than YSZ(14GPa), a hardness discrepancy that may induce micro-crack propagation when the coatings are subjected to sand particle impacts and high-velocity erosion during engine operation.
A solid solution is defined as a phenomenon wherein one or more types of solute atoms dissolve into the crystal lattice of a solvent, resulting in the formation of a homogeneous and single crystalline phase. By manipulating the species and content of solutes, the mechanical properties, electrical properties, and thermal properties of materials can be tailored. Currently, solid solution strengthening is one of the common and effective methods to improve the mechanical properties of materials. The mechanism underlying solid solution strengthening hinges on the interaction between solute atoms and the matrix lattice. When solute atoms (such as alloying elements in metals) incorporate into the solvent lattice, a significant lattice distortion is induced if the size discrepancy between solute and solvent atoms exceeds 15%. For instance, interstitial solutes give rise to lattice expansion, whereas substitutional solutes generate local stress fields owing to differences in atomic radii. This distortion exerts an "impeding effect" on dislocation motion: during the migration of dislocations within the lattice, they must overcome the additional stress in the distorted regions, thereby consuming more energy. Macroscopically, this is manifested as an improvement in the strength and hardness of the material. Solid solution strengthening exhibits extensive applicability, encompassing most metals, alloys, and ceramics. Particularly in the field of ceramics, ample experimental evidence has confirmed that the formation of solid solutions can effectively enhance the mechanical properties of materials and reduce their thermal conductivity. For example, in transition metal diborides (TMB2 ), the hardness of TMB2 compounds can be further enhanced by constructing dual-transition metal diboride solid solutions. The hardness of ZrB2 increases from 35 GPa to 42 GPa after introducing Ta5+ ions to form Zr0.8Ta0.2 B1.8 [13]. Furthermore, lattice distortion induced by solid solution further reduces thermal conductivity, as evidenced by the work of Ridley et al. [14].The room-temperature thermal conductivity of (Sc,Y,Dy,Er,Yb)2SiO5 prepared by them is 1.06 W⋅ m-1⋅ K-1, which is lower than that of all corresponding single-rareearth component silicate materials.
To enhance the mechanical properties and further reduce the thermal conductivity of rutile-type ternary oxides CrTaO4 and CrNbO4, we designed a CrTa0.5Nb0.5O4 solid solution based on the theory of solid solution strengthening. This idea was also driven by the fact that Cr,Nb and Ta usually coexist in some RHEAs, which may lead to the formation of CrTa0.5Nb0.5O4 solid solution during high-temperature oxidation. As such, understanding the mechanical and thermal properties of CrTa0.5Nb0.5O4 solid solution is appealing. As we will show in the following sections, this study provides experimental evidences for the development of a novel high-temperature protective coating with both low thermal conductivity and good mechanical performance.
2. Experimental
2.1. Preparation of CrTa0.5Nb0.5O4 powders and dense bulk
The raw materials are high-purity Cr2O3 (Huawei Ruike Chemical Co., Ltd., Beijing, China), Ta2O5 (Huawei Ruike Chemical Co., Ltd., Beijing, China) and Nb2O5 (Macklin Biochemical Technology Co., Ltd., Shanghai, China) powders. The materials were mixed according to the nominal composition of CrTa0.5Nb0.5O4 with deionized water and zirconia balls in a mass ratio of 1:2:6 and then ball milled for 12 h at 120 rpm. After drying in an oven, the mixture was sieved through a 300 -mesh screen to achieve the desired powder fineness. Subsequently, the powder underwent preparation in an air atmosphere at the temperature of 1150∘C with a holding time of 2 h according to reaction (1):
These parameters were selected because both CrTaO4 and CrNbO4 powders were synthesized at 1150∘C for 2 h. The phase composition of the as-synthesized CrTa0.5Nb0.5O4 powders was examined by an X-ray diffractometer (XRD, Rigaku Ultima IV, Japan) using CuK αradiation (λ=1.5406Å ) with a step size of 0.02∘ at a scanning rate of 1∘/min. The microstructure and particle size distribution were analyzed in a scanning electron microscope (SEM, JSM-7001F, Japan). In addition, the crystal structure of CrTa0.5Nb0.5O4 was refined by the Rietveld method (Reflex code, Materials Studio program, Accelrys Inc., San Diego, USA). After that, the synthesized pure-phase CrTa0.5Nb0.5O4 powders were ground and screened to obtain particles with uniform size, which is beneficial to the preparation of subsequent dense bulk.
Bulk CrTa0.5Nb0.5O4 was prepared by the hot-press sintering method (in a ZT-50-22Y hot-pressing furnace, Shanghai Chenhua Science and Technology Co., Ltd, China). Through monitoring the displacement-temperature-time curve during the hot-pressing process, the optimal processing parameters for fabricating bulk CrTa0.5Nb0.5O4 were determined as follows: CrTa0.5Nb0.5O4 powders were loaded into a graphite mold with a diameter of 50 mm, heated to 1400∘C at a rate of 10∘C/min, maintained at 30 MPa for 40 min, cooled to 800∘C at a rate of 5∘C/min, and then furnace-cooled to room temperature. After cooling, the surface contaminants were removed using a grinding machine. The final density of the bulk CrTa0.5Nb0.5O4 was measured by the Archimedes method. The theoretical density of CrTa0.5Nb0.5O4 was calculated from the mass of the atoms in a unit cell and the cell dimensions obtained by the Rietveld refinement of XRD data. Phase identification in the bulk sample was conducted by XRD at a scanning rate of 1∘/min. The microstructure and grain size distribution of the bulk CrTa0.5Nb0.5O4 were observed in a scanning electron microscope (SEM, JSM-7001F, Japan). For in-depth and detailed microstructure analysis, atomic-resolution high-annular dark field (HAADF) and annular bright field (ABF) scanning transmission electron microscopy (STEM) analyses were carried out in a Thermo Fisher Spectra 300 aberration-corrected transmission electron microscope.
2.2. Elastic/mechanical properties of bulk CrTa0.5Nb0.5O4
The Young's modulus (E ) and shear modulus (G ) of the bulk CrTa0.5Nb0.5O4 were measured using a rectangular bar with the size of 3 mm×15 mm×40 mm by employing the impulse excited resonance method (DST-V, China National Inspection and Testing Group Co., Ltd). According to the China National Building Materials Industry Standard (JC/T 2172-2013) [15], the E and G were calculated based on the obtained flexural resonate frequency and torsional resonate frequency respectively:
In these equations, β and γ were calculated using the following Eqs. (4) and (5):
where E and G are Young's modulus and shear modulus in Pa, respectively; m is the mass of rectangular bar in kg;fF and fT are the fundamental flexural resonant frequency and torsional resonate frequency in Hz, respectively; b,L, and t are the width, length, and thickness of the rectangular bar in m, respectively; β is the shape parameter, and γ is the empirical correction parameter. The bulk modulus (B ) and Poisson's ratio (v ) were calculated from the E and G according to the following relationships [16]:
Vickers hardness (Hv ) was measured by a microhardness tester (HXD-1000TMC/LCD, Shanghai Taiming, China) at loads of 0.98, 1.96, 2.94,4.90, and 9.80 N, with a dwell time of 15 s. Seven measurement points were taken under each load, and the hardness value at the corresponding load was obtained by calculating the average of these seven points. The morphology of the indentation was observed by a scanning electron microscope (SEM, JSM-7001F, Japan). The HV was calculated according to Eq. (8):
where P is the load, S is the surface area of the indentation, θ is the angle between opposite face of the intender, and d is the diagonal length of the indentation.
Flexural strength (σf ) was measured by the three-point bending method with a span of 30 mm and a crosshead speed of 0.5 mm/min. Samples were cut into the size of 3 mm×4 mm×40 mm and were polished and chamfered with a polishing lap. The flexural strength was calculated by using Eq. (9) [17]:
where F is the load, l is the length of the span, b is the width, and h is the thickness of the sample. Fracture toughness (KIC ) was measured using single-edge V-notched beam specimens (SEVNB) in three-point bending. The V-notches with a sharp tip radius of ca.8μ m and notch depth of ca. 860μ m were cut at the center of the 3 mm×40 mm surfaces of the rectangular samples by automated means with a razor blade coated with diamond paste before testing. The fracture toughness was calculated by using Eqs. (10), (11) and (12) [18]:
where d is the depth of V-notches; w and h represent the width and height of the sample, respectively; Y is a stress intensity shape factor; Pmax is the maximum force at which fracture occurred; SO and Si are the outer and inner span, respectively.
2.3. Thermal properties of CrTa0.5Nb0.5O4
The melting point of CrTa0.5Nb0.5O4 was measured by directly observing the shape and volume changes during the laser heating process in a system developed at Shanghai Institute of Ceramics, Chinese Academy of Sciences. The bulk sample was placed in a graphite crucible positioned at the center of a vacuum chamber. The graphite crucible was heated by four symmetrically arranged laser beams, and the temperature was measured using an infrared pyrometer. The shape and volume of the sample were monitored via an optical system. When the collapse of the solid sample was observed, the corresponding temperature (melting point) at that moment was recorded.
The average thermal expansion coefficient (TEC) of CrTa0.5Nb0.5O4 was measured by an optical dilatometer (Misura ODHT 1600-50, Expert System Solutions, Italy). The test specimen is a rectangular bar with the dimension of 3 mm in thickness, 4 mm in width, and 15 mm in length (height). A 45∘ sharp edge was cut on top end of the height of the test specimen. Temperature dependent change in the length of the specimen from room temperature to 1473 K was recorded continuously by a personal computer. The heating rate during testing was controlled at 5∘C/min. The average linear TEC of CrTa0.5Nb0.5O4 was calculated according to Eq. (13):
where α is the average linear TEC, L is the length of the sample, T is the temperature.
Thermal diffusivity (Dth ) of CrTa0.5Nb0.5O4 was determined by laser flash method (LFA457, NETZSCH, Germany). A specimen with the dimension of $\mathrm{\Phi }10\text{ }\mathrm{m}\mathrm{m}\times 2\text{ }\mathrm{m}\mathrm{m}$ was used for the test. Before thermal diffusivity measurement, the front and back faces of the specimen were sprayed with two layers of carbon to minimize the radiative heat transport through the specimen. The heat capacity was obtained from the data of its constituent oxides according to Neumann-Kopp rule [19]. The thermal conductivity of CrTa0.5Nb0.5O4 was calculated according to the following equation [20]:
where k is the thermal conductivity, Dth is the thermal diffusivity, Cp is the heat capacity, and ρ(T) is the temperature dependent density, which can be calculated using the TEC.
3. Results
3.1. Synthesis and characterization of CrTa0.5Nb0.5O4 powders
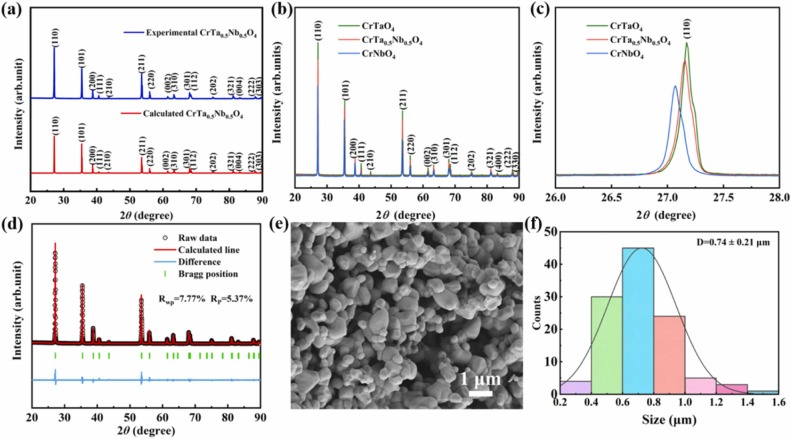
In Fig. 1(a), the experimental XRD pattern of CrTa0.5Nb0.5O4 powder, synthesized by calcining the Cr2O3,Nb2O5 and Ta2O5 powder mixture at 1150∘C for 2 h in an air atmosphere, was compared with the theoretical XRD pattern generated using the Reflex code in the Accelrys Materials Studio program (Accelrys Inc., San Diego, USA). Apparently, both the positions and intensities of the diffraction peaks are consistent with the calculated XRD pattern, and no extra diffraction peaks are detected. Based on these facts, we preliminarily believe that phase pure CrTa0.5Nb0.5O4 powder has been successfully obtained. Since CrTa0.5Nb0.5O4 can be regarded as a solid solution of CrTaO4 and CrNbO4, in Fig. 1(b), we compared the experimental XRD patterns of these three materials. Judging from the intensities of the diffraction peaks, the intensity of the solid solution CrTa0.5Nb0.5O4 is between those of CrTaO4 and CrNbO4 (see the color difference in the figure). After magnifying the (110) peak, Fig. 1(c) is obtained. It is of note that the position of the diffraction peak of the solid solution CrTa0.5Nb0.5O4 is also in between the two-end member CrTaO4 and CrNbO4. Therefore, we can assume that a new solid solution CrTa0.5Nb0.5O4 has indeed been formed after calcining the Cr2O3,Nb2O5 and Ta2O5 powder mixture at 1150∘C for 2 h. To further confirm that the synthesized powder is CrTa0.5Nb0.5O4 and obtain the corresponding crystal structure information, Rietveld refinement was performed using Pseudo-Voigt peak shape profile, and the resultant data are presented in Fig. 1(d). The reliability factors Rp and Rwp were calculated by Eqs. (15) and (16) [21,22]:
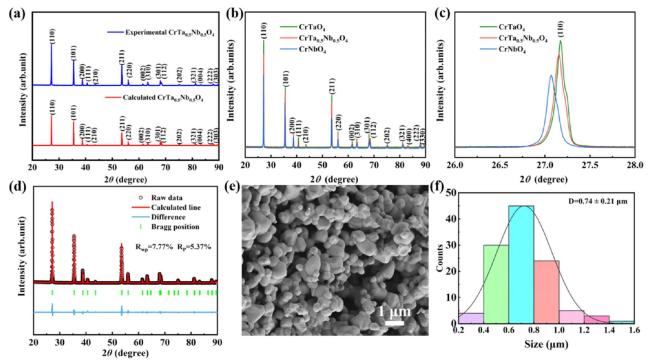
Fig. 1. (a) Comparison of the XRD pattern of CrTa0.5Nb0.5O4 powders synthesized at 1150∘C for 2 h with the theoretical one for CrTa0.5Nb0.5O4. (b) Comparison of the experimental XRD patterns of CrTaO4,CrNbO4 and CrTa0.5Nb0.5O4. (c) An enlarged view of the (110) diffraction peak in Fig. 1(b). (d) The experimental (black line) and calculated (red line) XRD patterns of CrTa0.5Nb0.5O4. The difference plot (blue line) is shown in the lower part. Vertical marks indicate the Bragg reflection positions of CrTa0.5Nb0.5O4 (green). (e) SEM image of CrTa0.5Nb0.5O4 powders. (f) particle size distribution of CrTa0.5Nb0.5O4 powders. |
where c is the optimization constant scaling factor, Iexp(2θi) is the intensity of the measured experimental spectrum, Yback (2θi) is the background intensity of the measured spectrum, Ysim(2θi) is the simulated diffraction intensity without the background contribution and wi is a weighting function. The reliability factors are Rp=5.34% and Rwp=7.77%, which indicate that the Rietveld refinement results are reliable. Rietveld refinement provides the corresponding unit cell parameters and atomic position information, as shown in Table 1. Moreover, the crystal structure information of CrTaO4 and CrNbO4 is also presented in the table. The unit cell parameters of the refined CrTa0.5Nb0.5O4 are between those of CrTaO4 and CrNbO4, consistent with the results in Fig. 1(c), which further confirm that the obtained powder is the solid solution CrTa0.5Nb0.5O4. Fig. 1(e) shows the SEM image of CrTa0.5Nb0.5O4 powders synthesized at 1150∘C for 2 h. The ImageJ software was utilized to calculate the particle size distribution presented in Fig. 1(f). The results demonstrate that the particle size distribution range of CrTa0.5Nb0.5O4 powders is relatively narrow, with an average particle size of 0.74μ m, which is conducive to the subsequent preparation of dense bulk materials.
Table 1 Crystal structure parameters of CrTaO4,CrNbO4 and CrTa0.5Nb0.5O4 obtained by Rietveld refinement. |
| Materials | CrTa0.5Nb0.5O4 | CrTaO4[8] | CrNbO4[9] |
|---|---|---|---|
| Lattice constants | |||
| a | 4.644 | 4.642 | 4.645 |
| b | 4.644 | 4.642 | 4.645 |
| c | 3.017 | 3.019 | 3.014 |
| Atomic positions | |||
| Cr/Ta/Nb | (0,0,0) | (0.2990,0.2990,0) | (0,0,0) |
3.2. Phase composition and microstructure of bulk CrTa0.5Nb0.5O4
To investigate the mechanical and thermal properties of CrTa0.5Nb0.5O4, the preparation of dense bulk CrTa0.5Nb0.5O4 compact is essential. Bulk CrTa0.5Nb0.5O4 was synthesized via hot-pressing the as-synthesized powders in a graphite mold under vacuum at 1400∘C under 30 MPa for 40 min. The phase composition of the hot-press sintered bulk was analyzed using XRD, as shown in Fig. 2(a). After hot-press sintering, the diffraction peaks of CrTa0.5Nb0.5O4 showed no significant shift in position or change in intensity and they closely matched with those in the theoretically simulated XRD pattern. This indicates that the phase composition remained unchanged after hot-pressing, suggesting that CrTa0.5Nb0.5O4 exhibits good thermal stability upon hot-press sintering at 1400∘C. Notably, in contrast to our previous study on CrNbO4 bulk synthesis-wherein trace amounts of Cr2O3 precipitation were detected after hot-pressing-the absence of secondary phases in CrTa0.5Nb0.5O4 underscores the stabilizing effect of configurational entropy in the solid solution of CrTa0.5Nb0.5O4. This phenomenon is consistent with the thermodynamic principle that increasing the entropy reduces the Gibbs free energy (ΔG=ΔH-TΔS ), thereby promoting phase homogeneity and inhibiting decomposition [23]. After confirming that the bulk material was phase-pure CrTa0.5Nb0.5O4, we calculated the relative density of the bulk. By applying Archimedes' principle, it was calculated that the density of the bulk was 6.39 g/cm3, which was 98.6% of the theoretical density of ${\mathrm{C}\mathrm{r}\mathrm{T}\mathrm{a}}_{0.5}{\mathrm{N}\mathrm{b}}_{0.5}{\mathrm{O}}_{4}(6.48\text{ }\mathrm{g}/{\mathrm{c}\mathrm{m}}^{3}$ ). Fig. 2(b) presents a SEM image of the fracture surface of the bulk CrTa0.5Nb0.5O4. Within the field of view of this image, neither micropores nor microcracks are observable. This microstructure feature suggests that the bulk CrTa0.5Nb0.5O4 is near fully dense, which is in line with the measured density of 98.6 %. Fig. 2(c) shows the grain size distribution collected from Fig. 2(b) using the ImageJ software. It is seen that the grains are relatively small with a narrow size distribution. The average grain size is statistically determined to be 3.05±0.54μ m.
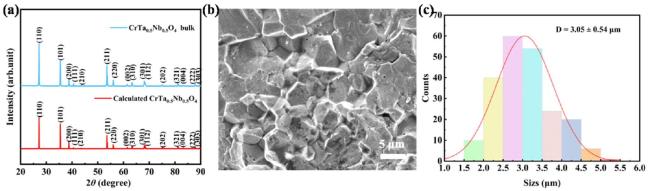
Fig. 2. (a) Comparison of the XRD pattern of bulk CrTa0.5Nb0.5O4 material prepared by hot-press sintering at 1400∘C for 40 min under 30 MPa with the theoretical one. (b) SEM image of the fracture surface. (c) Grain size distribution. |
3.3. Elastic/mechanical properties of bulk CrTa0.5Nb0.5O4
Elastic properties are important for technological and engineering applications of materials. The intrinsic hardness of a material is correlated with its bulk modulus (B ) and shear modulus (G ). The B is a measure of resistance to volume change by the applied pressure while the G is a measure of resistance to reversible deformations upon shear stress. Young's modulus (E ) is defined as the stress-to-strain ratio, characterizing the stiffness of the solid. Table 2 shows the B,G,E, Poisson's ratio (v ), Pugh's ratio G/B, Vickers hardness (Hv ), flexural strength (σf ), and fracture toughness (KIC ) of CrTa0.5Nb0.5O4. Additionally, it also includes those of CrTaO4 [8] and CrNbO4 [9] with the rutile-type crystal structure, typical ceramics Al2O3 [24], YSZ [10], and Cr-Ta-Nb based RHEAs [25] in the table. The E,G and B of CrTa0.5Nb0.5O4 are higher than CrMoNbTaTiVZr, but much lower than those of Al2O3. Since CrTa0.5Nb0.5O4 is a solid solution of CrTaO4 and CrNbO4, so we conduct a detailed comparison of these three materials. Notably, both the E and G of CrTa0.5Nb0.5O4 are higher than those of CrTaO4 and CrNbO4, but its B is lower than that of these two materials. The bulk modulus of CrTa0.5Nb0.5O4 is 3.3% lower than CrTaO4 and 2.7% lower than CrNbO4. A parallel trend is observed when compared with YSZ. The E and G of CrTa0.5Nb0.5O4 are much higher than those of YSZ, but the bulk modulus B is slightly lower (∼0.57% ) than that of YSZ. A low bulk modulus typically indicates that a material is more prone to volume shrinkage under external pressure, which may affect its thermal properties such as the thermal expansion coefficient. Pugh's ratio (G/B ) and Poisson's ratio (ν ) serve as valuable indicators for characterizing the brittleness/ ductility and bonding type in crystalline materials. Specifically, materials are generally classified as brittle when the G/B ratio exceeds 0.571 [26] and the Poisson ratio is lower than 0.26 [27]. Conversely, materials with G/B ratios below this threshold and Poisson ratios above 0.26 are typically categorized as damage-tolerant, exhibiting enhanced resistance to fracture under stress. Using the measured elastic properties, the G/B ratio of CrTa0.5Nb0.5O4 is calculated to be 0.680 (exceeding 0.571), while the ν is 0.233 (lower than 0.260). Thus, it can be concluded that CrTa0.5Nb0.5O4 exhibits brittle behavior. To quantitatively compare the degree of brittleness, the Poisson's ratios and Pugh's ratios (G/B ) of the following materials are plotted in Fig. 3(a): CrMoNbTaTiVZr (0.317, 0.356) [28], CrMoNbTaTiVWZr (0.372,0.335 ), Y2SiO5(0.44,0.31) [29], CrTaO4(0.59,0.254) [8], CrNbO4(0.56,0.266) [9], YSZ (0.46, 0.3) [10], SiC (0.85, 0.16) [30], Al2O3 (0.65,0.22 ) [24], TaC(0.63,0.24) [12], $\mathrm{H}\mathrm{f}\mathrm{C}\left(\mathrm{0.81,0.18}\right)\left[31\right],{\mathrm{Y}\mathrm{b}}_{3}{\mathrm{A}\mathrm{l}}_{5}{\mathrm{O}}_{12}$ (0.64,0.24 ) [32], YbAlO3(0.496,0.287) [33], Ti3AlC2(0.75,0.2) [34], ${\mathrm{M}\mathrm{n}}_{2}{\mathrm{A}\mathrm{l}\mathrm{B}}_{2}\left(\mathrm{0.71,0.21}\right)\left[35\right],{\mathrm{Y}\mathrm{T}\mathrm{a}\mathrm{O}}_{4}\left(\mathrm{0.327,0.35}\right),{\mathrm{N}\mathrm{d}\mathrm{T}\mathrm{a}\mathrm{O}}_{4}\left(\mathrm{0.459,0.30}\right)\left[36\right]$ . On the ground of the data in Fig. 3(a), the two Cr and Nb containing RHEAs are judged as ductile materials, whereas CrTa0.5Nb0.5O4 is more brittle than its constituent end member CrTaO4 and CrNbO4 as well as YSZ,Y2SiO5, ${\mathrm{Y}\mathrm{T}\mathrm{a}\mathrm{O}}_{4},{\mathrm{N}\mathrm{d}\mathrm{T}\mathrm{a}\mathrm{O}}_{4},{\mathrm{Y}\mathrm{b}\mathrm{A}\mathrm{l}\mathrm{O}}_{3},{\mathrm{Y}\mathrm{b}}_{3}{\mathrm{A}\mathrm{l}}_{5}{\mathrm{O}}_{12}$ . Notably CrTa0.5Nb0.5O4 is significantly less brittle than some typical brittle ceramics, such as SiC,HfC,Ti3AlC2 and Mn2AlB2 but exhibits comparable brittleness to Al2O3 and TaC.
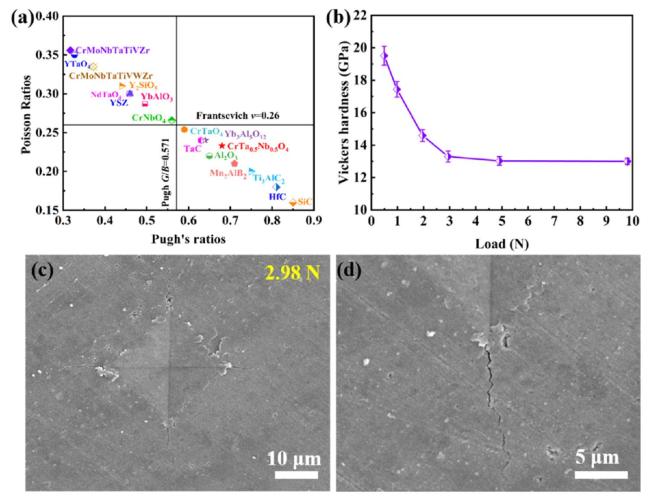
Fig. 3. (a) Compiled data of G/B and Poisson's ratio v of some typical ceramics and Cr,Nb containing RHEAs. (b) Vickers hardness versus indentation load for CrTa0.5Nb0.5O4. (c) SEM image of a representative indent produced under a load of 2.98 N. (d) High magnification SEM image showing crack deflection. |
Table 2 Elastic/mechanical properties of CrTa0.5Nb0.5O4 together with those of |
| Material | CrTa0.5Nb0.5O4 | CrTa5O4 | CrNbO4 | Al2O3 | YSZ | CrMoNbTaTiVZr |
|---|---|---|---|---|---|---|
| E | 291±2 | 268 | 253 | 370 | 210 | 142 |
| G | 119±1 | 107 | 100 | 163 | 81 | 52 |
| B | 175±3 | 181 | 180 | 251 | 176 | 164 |
| v | 0.233 | 0.254 | 0.266 | 0.22 | 0.300 | 0.356 |
| G/B | 0.68 | 0.59 | 0.56 | 0.65 | 0.46 | 0.317 |
| Hv | 13.01±0.20 | 12.20±0.44 | 10.20±0.58 | 15 | 14 | 5.4 |
| σf | 201±12 | 142±14 | 205±8 | 300-400 | 120 | |
| KIC | 2.07±0.017 | 1.87±0.074 | 1.54±0.124 | 3.2-4.5 | 1.7-2.0 |
Fig. 3(b) shows the relationship between the Vickers hardness and the indentation load of CrTa0.5Nb0.5O4. As the indentation load increases (from 0.98 N to 9.80 N), the hardness of CrTa0.5Nb0.5O4 monotonically decreases from 19.50 to 13.01 GPa. When the load increases to 2.98 N, cracks start to appear, which is regarded as the practical hardness value of CrTa0.5Nb0.5O4. As a result, the hardness of CrTa0.5Nb0.5O4 is 13.01±0.20GPa (measured under a load of 2.98 N), being lower than that of YSZ (14 GPa) [10], Al2O3(16GPa) [24], and SiC(32GPa) [30], but higher than the two end member materials CrTaO4(12.20±0.44) [8] and CrNbO4(10.20±0.58) [9]. This phenomenon is primarily ascribed to solid solution strengthening, wherein the dimensional and valence electron disparities among metal atoms (Cr,Ta,Nb ) in the multi-component solid solution elicit significant lattice distortion. Such distortion hinders dislocation glide, thereby elevating the solid solution's hardness in comparison to its end member analogs. Fig. 3(c) presents the SEM morphology of an indentation generated in CrTa0.5Nb0.5O4 under a load of 2.98 N. The indentation exhibits distinct boundaries, and straight cracks emanate from its four corners, which is consistent with the failure characteristics of brittle materials. A magnified view of the crack, as shown in Fig. 3(d), reveals crack deflection. This mechanism effectively mitigates the tendency toward brittle fracture under stress and enhances the material's toughness. The flexural strength of CrTa0.5Nb0.5O4 is 201±12MPa, which is higher than that of CrTaO4(142±14MPa) [8], YSZ (120 MPa ) [10], but lower than that of CrNbO4(205±8MPa) [9] and Al2O3(300-400MPa) [24]. Notably, the fracture toughness of CrTa0.5Nb0.5O4 is 2.07±0.017MPa⋅m1/ 2, representing a 10.7% increase over ${\mathrm{C}\mathrm{r}\mathrm{T}\mathrm{a}\mathrm{O}}_{4}\left(1.87\pm 0.074\mathrm{M}\mathrm{P}\mathrm{a}\cdot {\mathrm{m}}^{1}/{ }^{2}\right)$ and a 33.1% increase over ${\mathrm{C}\mathrm{r}\mathrm{N}\mathrm{b}\mathrm{O}}_{4}\left(1.54\pm 0.124\mathrm{M}\mathrm{P}\mathrm{a}\cdot {\mathrm{m}}^{1}/{ }^{2}\right)$ , while remaining comparable to YSZ (1.7-2.0MPa⋅m1/ 2 ). The improvement in toughness can also be ascribed to the solid solution strengthening mechanism, wherein lattice distortion induced by size discrepancies among the three atoms hinders dislocation glide and retards crack propagation. At present, YSZ is the most commonly used thermal barrier coating material, in line with CrTaO4 and CrNbO4 the similar elastic and mechanical properties of CrTa0.5Nb0.5O4 to those of YSZ give us a hint that CrTa0.5Nb0.5O4 is presumably a new thermal barrier material.
3.4. Thermal properties of CrTa0.5Nb0.5O4
CrTa0.5Nb0.5O4 exhibits high hardness, flexural strength, and fracture toughness. However, for thermal barrier coating (TBC) applications, the matching of thermal expansion coefficient with the substrate and low thermal conductivity are of paramount importance, which motivates an in-depth investigation into the thermal properties of CrTa0.5Nb0.5O4.
3.4.1. Sound velocities, Debye temperature, and melting point
The sound velocity is closely related to the thermal conductivity of a material. According to the measured Young's modulus (E ), shear modulus (G ), and Poisson's ratio (v ), the longitudinal sound velocity (v1), transverse sound velocity (vs), and average sound velocity (vM) of CrTa0.5Nb0.5O4 can be calculated using the following Eqs [37]:
where v1 is the longitudinal sound velocity, vS the transverse sound velocity, and vM the average sound velocity. Based on the elastic constant calculations, v1 is determined to be 7226 m/s,vS4315 m/s, and vM of 4776 m/s. Generally, a large difference between the vS and v1 leads to complex phonon scattering paths, resulting in a decrease in thermal conductivity [38]. For CrTa0.5Nb0.5O4, the shear-to-longitudinal wave velocity ratio (vS/v1) is 0.56, which is lower than those of ${\mathrm{C}\mathrm{r}\mathrm{T}\mathrm{a}\mathrm{O}}_{4}$ (0.58) and ${\mathrm{C}\mathrm{r}\mathrm{N}\mathrm{b}\mathrm{O}}_{4}$ (0.60), implying that it may exhibit lower thermal conductivity and be more suitable as a thermal barrier coating material.
The Debye temperature (θD ) is generally related to the strength of chemical bonds, holding significant guiding significance for melting point, thermal expansion coefficient (TEC), and thermal conductivity. The value of θD is calculated using Eq. (20) [39]:
where h is the Planck's constant, kB is the Boltzmann's constant, n is the number of atoms in the molecular formula, NA is the Avogadro's number, ρ is the density, M is the molecular weight, and vM is the average sound velocity. The calculated Debye temperature of CrTa0.5Nb0.5O4 is 606 K, which is higher than that of CrTaO4(560 K), indicating that CrTa0.5Nb0.5O4 possesses good thermal stability. The melting point of CrTa0.5Nb0.5O4 is 2073±20 K, slightly lower than that of TiO2(2143 K) [40], CrTaO4(2103 K) [8], but higher than that of CrNbO4(2053 K) [9].
3.4.2. Thermal expansion coefficient and thermal conductivity
Thermal expansion arises directly from anharmonic effect in the atomic interaction potential, implying that the average interatomic distance increases with temperature. The average interatomic distance ⟨R⟩ can be described by the Maxwell Boltzmann distribution [41]:
where R0 is the equilibrium interatomic distance, x=R-R0,kB is the Boltzmann constant, U(x) is the interatomic potential, and T is the temperature.
The linear thermal expansion curve of CrTa0.5Nb0.5O4 measured from room temperature to 1673 K is illustrated in Fig. 4(a). As shown in Fig. 4(a), the expansion of the test specimen increases almost linearly with the increase of temperature. The linear thermal expansion coefficient is determined in terms of the slope of thermal expansion versus temperature curve during heating process, and the linear TEC is (5.91±0.52)×10-6 K-1, which is lower than that of ${\mathrm{C}\mathrm{r}\mathrm{T}\mathrm{a}\mathrm{O}}_{4}\left((6.12\pm 0.52)\times {10}^{-6}{\text{ }\mathrm{K}}^{-1}\right)$ , but higher than that of ${\mathrm{C}\mathrm{r}\mathrm{N}\mathrm{b}\mathrm{O}}_{4}\left((5.84\pm 0.04)\times {10}^{-6}{\text{ }\mathrm{K}}^{-1}\right)$ .
Fig. 4(b) is the temperature-dependent thermal diffusivity of CrTa0.5Nb0.5O4. The thermal diffusivity data were subjected to polynomial equation fitting, yielding a result in the form:
and the reliability (R2 ) value of the fitted curve is 0.997. The thermal diffusivity of CrTa0.5Nb0.5O4 is 1.349 mm2/s at 298 K. With the increase of temperature, the thermal diffusivity of CrTa0.5Nb0.5O4 decreases gradually, dropping to only 0.576 mm2/s at 1473 K. Fig. 4(c) displays the curve of heat capacity for CrTa0.5Nb0.5O4 as a function of temperature. This curve was derived based on the Neumann-Kopp rule (Cp (compound) $\approx \mathrm{\Sigma }{x}_{i}{C}_{\mathrm{p}}$ (oxide)), utilizing the thermophysical property data of its constituent oxides (Cr2O3,Ta2O5, and Nb2O5 ). Then, the thermal conductivity of CrTa0.5Nb0.5O4 was calculated using Eq. (14). Since the thermal conductivity of most oxides is almost inversely proportional to temperature, least squares fit of the data yields Eq. (24):
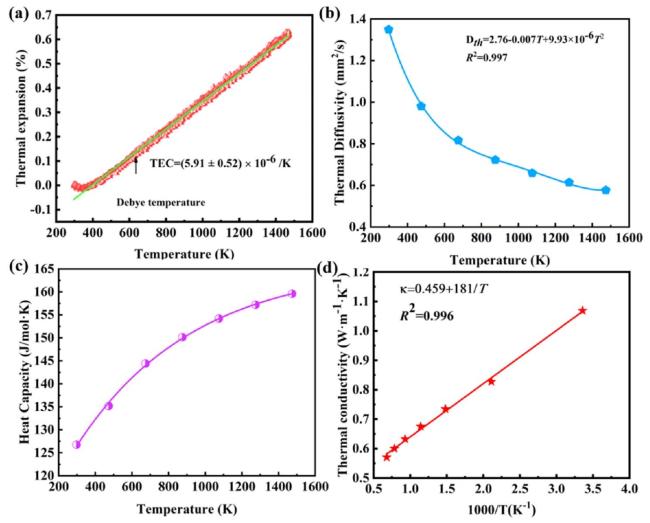
Fig. 4. Temperature dependent (a) thermal expansion coefficient, (b) thermal diffusivity, (c) heat capacity, and (d) thermal conductivity of CrTa0.5Nb0.5O4. |
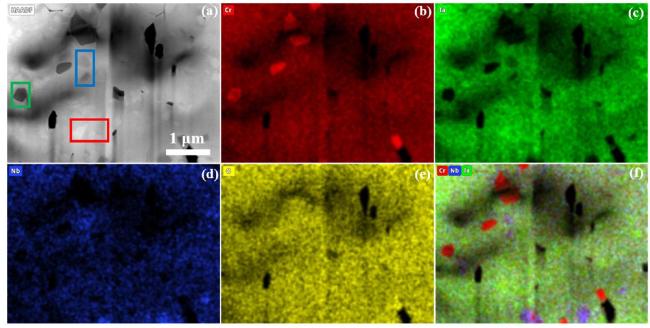
Fig. 5. (a) HAADF image of CrTa0.5Nb0.5O4. The red rectangle, blue rectangle and green rectangle mark CrTa0.5Nb0.5O4,CrNbO4, and CrO, respectively. (b-e) EDS elemental mapping of Cr,Ta,Nb and O. (f) The merged mapping images of Cr,Ta and Nb corresponding to the HAADF in Fig. 5(a). |
The R2 value of the fitted curve is 0.996. The thermal conductivity of CrTa0.5Nb0.5O4 at room temperature is 1.07Wm-1⋅ K-1, which is much lower than other reported TBC materials, such as ${\mathrm{C}\mathrm{r}\mathrm{T}\mathrm{a}\mathrm{O}}_{4}\left(1.31{\mathrm{W}\mathrm{m}}^{-1}\cdot {\text{ }\mathrm{K}}^{-1}\right)\mathrm{ }\left[8\right],{\mathrm{C}\mathrm{r}\mathrm{N}\mathrm{b}\mathrm{O}}_{4}\left(1.09{\mathrm{W}\mathrm{m}}^{-1}\cdot {\text{ }\mathrm{K}}^{-1}\right)\mathrm{ }\left[9\right],\mathrm{Y}\mathrm{S}\mathrm{Z}(3.06{\mathrm{W}\mathrm{m}}^{-1}\cdot {\text{ }\mathrm{K}}^{-1}$ ) [10], Yb3Al5O12(4.67Wm-1⋅ K-1) [32]. As the temperature increases, the thermal conductivity of CrTa0.5Nb0.5O4 decreases slowly and reaches 0.57Wm-1⋅ K-1 at 1473 K.
Debye derived the lattice thermal conductivity of dielectric solids by analogy to gas dynamics theory, expressed as [42]:
where C is the heat capacity, vM the average sound velocity, and λ the phonon mean free path. Above the Debye temperature (606 K), both heat capacity and sound velocity remain approximately constant, while the average phonon free path in crystalline materials scales nearly as 1 / T. Consequently, the thermal conductivity of CrTa0.5Nb0.5O4 can be fitted to a 1/T function over the temperature range of 606-1473 K. When the temperature continues to rise, the thermal conductivity does not decrease infinitely but tends to a plateau, becoming independent of temperature. For most materials, such a plateau value of thermal conductivity reaches the minimum thermal conductivity κmin , which can be obtained using Clarke's model [43]:
where kB is the Boltzmann constant, NA Avogadro's constant, m the number of atoms in the primitive cell, ρ the density, E the Young's modulus, and M the molecular mass. To accurately estimate the lower limit of the intrinsic κmin of CrTa0.5Nb0.5O4, the modified Clarke model reported by Liu et al. [44] is used here, which can be expressed as:
Using Eq. (27), the modified Clarke model of Liu et al., the estimated κmin for CrTa0.5Nb0.5O4 is 0.46Wm-1⋅ K-1. The experimental thermal conductivity at 1473 K is 0.57 W⋅ m-1⋅ K-1, only slightly higher than 0.46Wm-1⋅ K-1, but close to the estimated κmin . It is common for most oxides that the measured κmin is higher than the theoretical one. The reason may be that the testing temperature (1473 K) is relatively low and does not approach the temperature at which thermal conductivity saturates to κmin.
4. Discussions
4.1. The microstructure of the bulk CrTa0.5Nb0.5O4
The aforementioned research findings demonstrate that CrTa0.5Nb0.5O4 manifests remarkable advantages in mechanical properties and thermal conductivity. To fundamentally reveal the inherent mechanisms underlying its excellent performance and fully explore its potential application values, subsequent studies will focus on the atomic scale microstructure analysis. Through microscopic structural analysis, the influences of composition, atomic arrangement and other factors on its properties will be systematically investigated, which will provide more solid theoretical support for the optimized design and practical application of CrTa0.5Nb0.5O4.
As illustrated in Fig. 5(a), the HAADF image of bulk CrTa0.5Nb0.5O4 processed by FIB technology reveals distinct contrast phases, prompting energy-dispersive spectroscopy (EDS) for elemental characterization. Figs. 5(b)-5(e) display the corresponding elemental mappings of Cr,Ta, Nb, and O, while Fig. 5(f) presents the merged elemental distribution of these three transition metals (Cr,Ta,Nb ). Notable observations include: red rectangle region showing co-distribution of all four elements (Cr, Ta,Nb,O ); blue rectangle region featuring high Cr and Nb contents with trace Ta; green areas characterized by dominant Cr with negligible Ta and Nb. Intriguingly, although the XRD pattern in Fig. 2 exhibiting diffraction peaks exclusive to a single phase, the integrated analysis with Fig. 5 provides compelling evidence for the coexistence of three distinct phases within the bulk material. In accordance with the fundamental principle of stereology, which states that under random sampling conditions, the three-dimensional volume fraction of a given phase within a material is equivalent to its area fraction in two-dimensional cross-sectional images, we quantified the area distributions of the three phases using ImageJ software to determine their volume ratio. Subsequent calculations yielded an approximate volume ratio of CrTa0.5Nb0.5O4,CrNbO4, and CrO2 to be 94.25%:2.41%:3.34%. To further determine the compositions and crystal structures of the three phases, atomic-scale high-resolution scanning transmission electron microscopy (HR-STEM) combined with EDS mapping analyses were performed on the respective regions highlighted in Fig. 5. Specifically, Fig. 6 presents the HAADF image acquired from the red rectangle region in Fig. 5(a), revealing atomic-column resolved contrast that facilitates direct structural interpretation. In HAADF-STEM image, the bright spots in the image can reflect the real atoms or atomic pairs, and the intensity of the image points is proportional to the square of the atomic number, while the ABF image contrast is proportional to one-third of the atomic number. Fig. 6(a) is the HAADF image of rutile structured CrTa0.5Nb0.5O4 in [012] zone axis and the overlaid atomistic structure in the figure. Figs. 6(b)-6(e) are the EDS element mapping of Cr,Ta,Nb and O corresponding to the HAADF in Fig. 6(a). Fig. 6(f) is the HAADF image of rutile structured CrTa0.5Nb0.5O4 in [101] zone axis and the overlaid atomistic structure in the figure. Figs. 6(g)-6(j) are the EDS element mapping of Cr,Ta,Nb and O corresponding to the HAADF in Fig. 6(f). Combining the analyses of Figs. 6(a) and Figs. 6(f), the atomic site occupation demonstrates a high degree of consistency with the rutile structure. By integrating the analyses from Fig. 6(a) and Fig. 6(f), the calculated unit cell parameters of CrTa0.5Nb0.5O4 are determined to be a=4.646Å and c=3.018Å, which show close agreement with the results derived from XRD refinement in Fig. 1(d). Specifically, Cr, Ta, and Nb exhibit random occupation of the (0,0,0 ) lattice sites. Elemental area scanning results confirm that the elemental composition closely aligns with the designed molar ratio of Cr:Ta:Nb=2:1:1, strongly indicate that CrTa0.5Nb0.5O4 is a rutile-structured solid solution. The grain boundary plays a crucial role in determining the mechanical and thermal properties of ceramics. From the HAADF image in Fig. 6(k), one finds that there is no amorphous layer at the interphase boundary, i.e., the interface between two grains is lattice-lattice directly matched. Figs. 6(l)-6(n) show the distributions of elements Cr,Nb, and Ta, respectively, while Fig. 6(o) is the merged mapping images of Cr, Ta,Nb and O. EDS line scanning (denoted by the purple line in Fig. 6(o)) was used to analyze the elemental distribution at the interface. It can be observed that Cr,Ta,Nb, and O are uniformly distributed near the interface without obvious enrichment or segregation phenomena, as can be seen from Fig. 6(p).
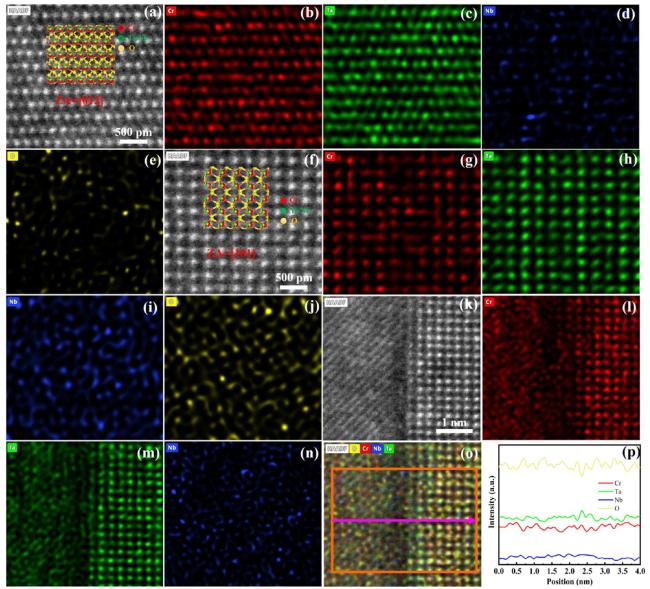
Fig. 6. (a) HAADF image of rutile-type CrTa0.5Nb0.5O4 in [012] zone axis. (b-e) EDS element mapping of Cr,Ta,Nb and O corresponding to the HAADF in Fig. 6(a). (f) HAADF image of rutile-type CrTa0.5Nb0.5O4 in [101] zone axis. (g-j) EDS element mapping of Cr,Ta,Nb and O corresponding to the HAADF in Fig. 6(f). (k) HAADF image of a grain boundary with the right grain in [101] zone axis, (l-n) EDS element mapping of Cr,Ta, and Nb corresponding to the HAADF in Fig. 6(k). (o) The merged mapping image of Cr,Ta,Nb and O, position of line scanning across the grain boundary is shown in the orange box. (p) Distribution of Cr (red), Ta (green), Nb (blue) and O (yellow) across the grain boundary along the purple line shown in Fig. 6(o). |
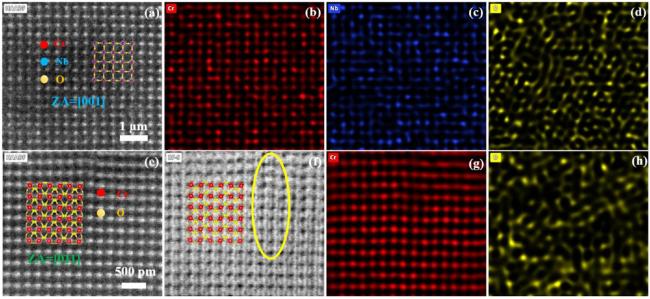
Fig. 7. (a) HAADF image of rutile structured CrNbO4 in [001] zone axis. (b-d) EDS element mapping of Cr,Nb and O corresponding to the HAADF in Fig. 7(a). (e-f) The HAADF and the ABF images of rutile structured CrO2 in [011] zone axis. Atomic resolution EDS mapping of (g)Cr element and (h)O element corresponding to the Fig. 7(e). The atomistic structures are overlaid in Fig. 7(a), (e) and (f). |
The presence of impurities exerts a non-negligible influence on the mechanical and thermal properties of bulk materials. Therefore, in-depth investigation and accurate determination of impurity composition and distribution in bulk materials are of significant importance. Further analysis was performed on the blue- rectangle region in Fig. 5, yielding the HAADF image shown in Fig. 7(a). Figs. 7(b)-7(d) present the elemental mappings of Cr,Nb, and O, respectively. Combined with the elemental distribution, the impurity phase in the blue region was identified as CrNbO4 with a rutile-type crystal structure, and the calculated lattice parameter a is 4.648 A. Similarly, in-depth analyses of the elemental composition and crystal structure were conducted for the third phase. Figs. 7(e) and Figs. 7(f) show the HAADF and ABF images of the third phase, respectively, while Figs. 7(g) and Figs. 7(h) depict the elemental distributions of Cr and O. Based on the results from Figs. 7(e) to 7(h), the impurity phase in the red region was identified as rutile-structured CrO2. Figs. 7(e) and Figs. 7(f) are the HAADF and ABF-STEM images of CrO2 in [011] zone axis. The calculated lattice parameters are a=4.437Å and c=2.938Å, which are in good agreement with those reported in the literature [45]. Overall, three phases were identified in the bulk material: CrTa0.5Nb0.5O4,CrNbO4, and CrO2. Due to their akin rutiletype crystal structures and highly similar unit cell parameters, these phases are indistinguishable in the XRD patterns presented in Figs. 1(a) and Figs. 2(a). Characterizing the composition and crystal structure of the impurity phases offers critical insights into the mechanisms underlying the observed enhancements in mechanical and thermal properties, which will be discussed in the next section.
4.2. Influence of impurity phases on mechanical/thermal properties
In terms of mechanical properties, the Vickers hardness of CrTa0.5Nb0.5O4 is 13.01±0.20GPa, indicating a 6.6% increase compared to ${\mathrm{C}\mathrm{r}\mathrm{T}\mathrm{a}\mathrm{O}}_{4}\left(\right(12.20\pm 0.44\mathrm{G}\mathrm{P}\mathrm{a})$ and a 27.5% increase compared to CrNbO4(10.20±0.58GPa). The fracture toughness of CrTa0.5Nb0.5O4 is 2.07±0.017MPa⋅m1/ 2, representing a 10.7% increase over ${\mathrm{C}\mathrm{r}\mathrm{T}\mathrm{a}\mathrm{O}}_{4}\left(1.87\pm 0.074\mathrm{M}\mathrm{P}\mathrm{a}\cdot {\mathrm{m}}^{1}/{ }^{2}\right)$ and a 33.1% increase over ${\mathrm{C}\mathrm{r}\mathrm{N}\mathrm{b}\mathrm{O}}_{4}\left(1.54\pm 0.124\mathrm{M}\mathrm{P}\mathrm{a}\cdot {\mathrm{m}}^{1}/{ }^{2}\right)$ . Based on microstructure analyses presented Fig. 5, it is proposed that the primary strengthening mechanisms are attributed to solid solution strengthening and dispersion strengthening. The solid solution strengthening in CrTa0.5Nb0.5O4 is primarily attributed to lattice distortion induced by the differences in atomic radius and electronegativity among Cr,Nb, and Ta. The differences in atomic properties among Cr,Nb, and Ta constitute the core origin triggering solid-solution strengthening. On one hand, there exist significant distinctions in their ionic sizes: Cr3+ has a radius of approximately 0.62Å, while both Nb5+(≈0.69Å) and Ta5+(≈0.64Å) are larger than Cr3+. When Nb5+ and Ta5+ substitute for Cr3+ in the lattice, their larger ionic sizes force the surrounding lattice to undergo local tensile deformation, forming inhomogeneous strain fields. On the other hand, there is a charge difference of +3 versus +5 between Cr3+ and Nb5+/Ta5+. This charge imbalance induces perturbations in the local electrostatic field, further exacerbating lattice irregularities. The lattice strain fields resulting from size mismatch and the electrostatic perturbations caused by charge differences collectively form a "composite resistance field" that hinders dislocation motion. When the material undergoes plastic deformation under external forces, the migration of dislocations (as carriers of lattice slip) is subjected to mechanical obstruction from the strain fields. Meanwhile, electrostatic perturbations enhance the interaction energy between dislocations and surrounding ions. The superposition of these two effects means that dislocations must overcome a higher energy barrier to continue moving, ultimately manifesting as an improvement in the material's strength and hardness, thus achieving solid-solution strengthening. Additionally, the presence of impurity phases (CrNbO4 and CrO2 particles) in the CrTa0.5Nb0.5O4 matrix exerts a dispersion strengthening effect. Dispersion strengthening enhances the material's resistance to deformation by means of second-phase particles such as fine impurity particles that impede dislocation motion. When the material undergoes plastic deformation under external force, dislocations need to traverse the impurity particles (i.e., CrNbO4 and CrO2 ) in the matrix. As dislocations propagate within the material, upon encountering CrNbO4 and CrO2 particles, they bend and loop around these particles to pass through. This process requires overcoming the line tension of the bent dislocations and consuming additional energy, which hinders the motion of dislocations. Consequently, the mechanical properties of the material, such as strength and hardness, are improved. The two mechanisms of solid-solution strengthening and dispersion strengthening can achieve the effects of "resistance superposition" and "spatial complementarity": the lattice distortion from solid-solution strengthening keeps dislocations in a state of continuous hindrance during long-distance movement, while the particle pinning from dispersion strengthening forms locally insurmountable obstacles. After dislocations break through the obstruction of the solid-solution stress field, they will soon encounter further interception by impurity particles. Meanwhile, significant lattice distortions were observed in CrO2 in Figs. 7(e) and Figs. 7(f), such as the areas marked by yellow circles. To characterize this phenomenon accurately, Geometric Phase Analysis (GPA) was employed for strain quantification, including quantitative studies on the distribution of CrO2 along the [011] zone axis, as well as CrNbO4 along the [001] zone axis and CrTa0.5Nb0.5O4 along the [113] zone axis. GPA analyses reveal that the mapping of horizontal normal strain (εxx ), vertical normal strain (εyy ) and shear strain (εxy ) are randomly distributed. In the strain intensity color scale, white-blue pixels characterize regions of high strain, while red-green pixels correspond to states of low strain. The results in Fig. 8 demonstrate that the strains in CrO2 and CrNbO4 are significantly greater than those in CrTa0.5Nb0.5O4. This implies that within the material, CrTa0.5Nb0.5O4 is subjected to a compressive stress, while CrO2 and CrNbO4 experience tensile stresses. Upon the application of external stress, the compressive stress in the CrTa0.5Nb0.5O4 matrix counteracts part of the load, thereby enhancing the material's hardness, strength and toughness.
In terms of thermal properties, the thermal conductivity of CrTa0.5Nb0.5O4 at room temperature is 1.07Wm-1⋅ K-1, which is lower than that of ${\mathrm{C}\mathrm{r}\mathrm{T}\mathrm{a}\mathrm{O}}_{4}\left(1.31{\mathrm{W}\mathrm{m}}^{-1}\cdot {\text{ }\mathrm{K}}^{-1}\right),{\mathrm{C}\mathrm{r}\mathrm{N}\mathrm{b}\mathrm{O}}_{4}\left(1.09{\mathrm{W}\mathrm{m}}^{-1}\cdot {\text{ }\mathrm{K}}^{-1}\right)$ . The reduction in thermal conductivity can be analyzed from the following aspects. Firstly, the configurational entropy ( ${S}_{\text{config}\text{ }}=-R\left(\sum _{i=1}^{N} {x}_{i}\mathrm{l}\mathrm{n}{x}_{i}\right)$ ) [46] of CrTaO4 and CrNbO4 is 0.69R, whereas that of CrTa0.5Nb0.5O4 reaches 1.04R. The enhanced configurational entropy in CrTa0.5Nb0.5O4 gives rise to more pronounced atomic radius mismatches and charge fluctuations among cations (Cr3+,Ta5+,Nb5+ ), thereby inducing lattice strains and local distortions. Such structural perturbations exacerbate phonon scattering, leading to a consequent reduction in thermal conductivity. Additionally, besides the matrix phase CrTa0.5Nb0.5O4, the impurity phases of CrNbO4 and CrO2 are present. Although the three phases share the same type of crystal structure, differences in elastic properties cause phonons to change propagation directions during scattering, thereby hindering heat conduction and thus reducing thermal conductivity. Furthermore, as shown in Fig. 8, significant residual strain exists in CrO2, which distorts the lattice and disrupts crystal symmetry, which increases the probability of phonon scattering and further reduces the thermal conductivity of CrTa0.5Nb0.5O4.
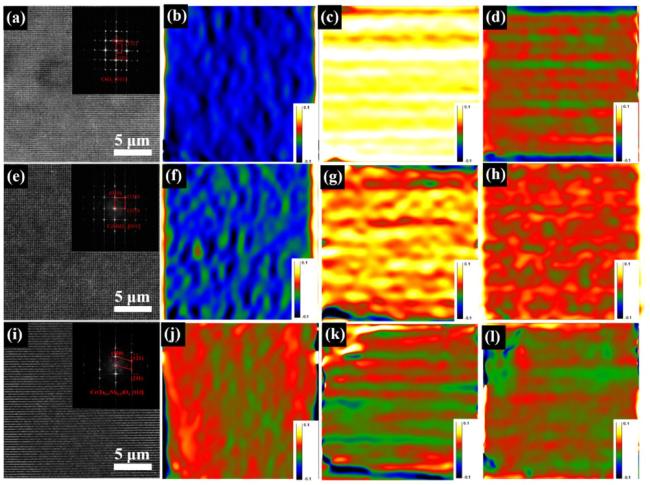
Fig. 8. GPA images of lattice strain distributions εxx,εyy and εxy in CrO2[011](a-d),CrNbO4 in [001] (e-h) and CrTa0.5Nb0.5O4 in [113] (i-l). |
4.3. The potential applications of CrTa0.5Nb0.5O4
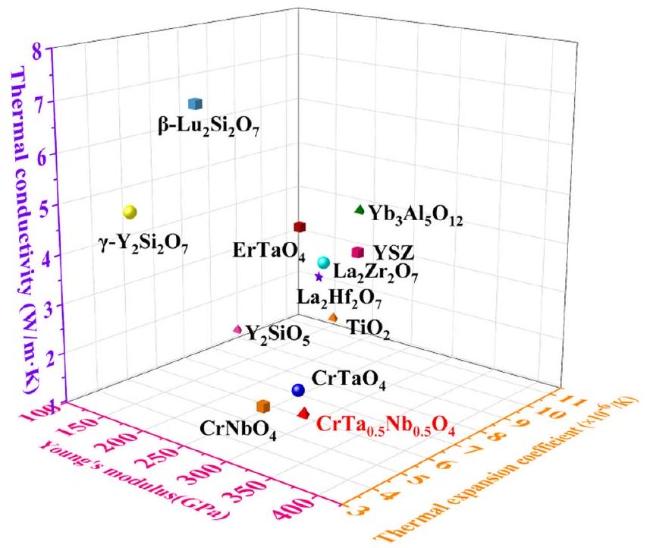
CrTa0.5Nb0.5O4 demonstrates an elevated melting point (2073 K) and exhibits good thermal stability. Intriguingly, its mechanical properties closely mirror those of YSZ, while maintaining a significantly low thermal conductivity. These findings inspire speculation on the potential of CrTa0.5Nb0.5O4 as a novel thermal barrier coating (TBC) material, positioning it comparably to CrTaO4 and CrNbO4. From the dual perspectives of TBC functional performance and system-level compatibility, the following attributes are critical for an ideal TBC material [47,48]: (1) ultralow thermal conductivity to minimize heat transfer; (2) a thermal expansion coefficient that closely matches the substrate, ensuring thermal stress mitigation; (3) robust corrosion resistance against harsh environmental conditions; (4) outstanding high-temperature stability to withstand prolonged exposure at elevated temperatures; (5) a high melting point to prevent phase degradation; and (6) superior mechanical properties, enabling resistance to mechanical stresses during operation. Consequently, the discussion will primarily focus on the thermal expansion coefficient and thermal conductivity. The TECs, room temperature thermal conductivities, and Young's modulus of common TBCs were plotted in a 3D graph, as depicted in Fig. 9. From Fig. 9, it is noteworthy that the TEC of CrTa0.5Nb0.5O4 is much lower than that of currently investigated TBC materials, such as CrTaO4(6.12×10⁻⁶ K-1) [8], CrNbO4(5.84×10⁻⁶ K-1) [9], YSZ (10.5×10⁻⁶ K-1) [10], La2Hf2O7(8.76×10⁻⁶ K-1) [49], Yb3Al5O12(8.22×10⁻⁶ K-1) [32], La2Zr2O7(9×10⁻⁶ K-1) [50] but higher than that of γ-Y2Si2O7(3.9×10⁻⁶ K-1) [51]. Of particular interest, the TEC of CrTa0.5Nb0.5O4 is close to those of refractory alloys such as Ta (6.3×10⁻⁶ K-1 ) and Nb(7.3×10⁻⁶ K-1) [11] and UHTCs such as HfB2(6.3×10⁻⁶ K-1) [52], TaC(6.6×10⁻⁶ K-1), and NbC (6.8×10⁻⁶ K-1 ) [12]. Therefore, from the perspective of matched TECs, CrTa0.5Nb0.5O4 is promising as protective TBC for refractory metals such as Ta and Nb and their alloys as well as UHTCs or as a protective scale to prevent the further oxidation of these materials once it forms on their surfaces upon oxidation. For thermal barrier applications, low thermal conductivity in the application temperatures is another important gauge to judge the suitability of a candidate material. The thermal conductivity of CrTa0.5Nb0.5O4 is much lower than that of some common TBC such as CrTaO4 [8], CrNbO4 [9], YSZ [10], β Lu2Si2O7 [53], γ-Y2Si2O7 [51], Y2SiO5 [29], La2Zr2O7 [50], Yb3Al5O12 [32], La2Hf2O7 [49], TiO2 [40], and ErTaO4 [36]. Considering the comprehensive mechanical properties, thermal expansion coefficient, and thermal conductivity, CrTa0.5Nb0.5O4 is considered promising as a thermal barrier coating material for RM, RHEAs, UHTCs and other materials.
Fig. 9. Comparison of thermal conductivity, TEC and Young's modulus of CrTa0.5Nb0.5O4 with those of typical TBCs materials. |
5. Conclusions
In summary, to enhance the mechanical properties and further reduce the thermal conductivity of rutile-type complex oxides CrTaO4 and CrNbO4, we successfully synthesized a CrTa0.5Nb0.5O4 solid solution and conducted a systematic investigation into its phase composition, microstructure, mechanical, and thermal properties. Firstly, CrTa0.5Nb0.5O4 powders were prepared via a solid-state reaction using Cr2O3,Ta2O5, and Nb2O5 as raw materials at 1150∘C for 2 h. The powders were then sintered into bulk CrTa0.5Nb0.5O4 with a relative density of 98.6% by hot-press sintering at 1400∘C under 30 MPa for 40 min. The HAADF and ABF-STEM analyses confirmed the rutile-type crystal structure of CrTa0.5Nb0.5O4, while also identified minor impurities of rutile-structured CrNbO4 and CrO2. The obtained mechanical properties of CrTa0.5Nb0.5O4 were as follows: Young's modulus (E ) of 291 GPa, shear modulus (G ) of 119 GPa, and bulk modulus (B ) of 175 GPa. Its Vickers hardness (HV ), flexural strength (σf ), and fracture toughness (KIC ) were measured at 13.01±0.2GPa,201±12MPa, and 2.07±0.017MPa⋅m1/ 2, respectively. Compared to ternary CrTaO4 and CrNbO4, the mechanical properties of CrTa0.5Nb0.5O4 were significantly improved (hardness and fracture toughness), demonstrating the feasibility of enhancing mechanical properties via solid solution strengthening. The solid solution of CrTa0.5Nb0.5O4 exhibits a high melting point of 2073±20 K, an average TEC of (5.91±0.52 ) ×10-6 K-1, slightly lower than those of CrTaO4 and CrNbO4. From room temperature to 1473 K, its thermal conductivity follows the empirical correlation κ=0.459+181/T. Notably, the thermal conductivity of CrTa0.5Nb0.5O4 is lower than that of most conventional thermal insulation materials-including YSZ, CrTaO4,CrNbO4, rareearth silicates, aluminates, and zirconates-across the entire temperature range. Owing to its matched TEC with RHEAs and UHTCs, CrTa0.5Nb0.5O4 shows promise as a TBC material for these materials or as protective scale to prevent them from further oxidation once it forms on their surfaces upon oxidation. Compared with CrTaO4 and CrNbO4, it demonstrates superior mechanical properties and lower thermal conductivity, offering significant potential for high-temperature protection applications.
CRediT authorship contribution statement
Yize Yao: Formal analysis, Investigation. Xiaohui Wang: Data curation, Methodology. Huimin Xiang: Software, Visualization. Cheng Fang: Formal analysis, Resources, Validation. Hailong Wang: Funding acquisition, Project administration. Yanchun Zhou: Conceptualization, Investigation, Methodology, Supervision, Validation, Writing - review & editing. Shuang Zhang: Conceptualization, Investigation, Methodology, Writing - original draft.
Declaration of competing interest
The authors have no competing interests to declare that are relevant to the content of this article.