


1. Introduction
With the continuous development of aeroengines toward higher thrust-to-weight ratios and improved thermal efficiency, the turbine inlet temperature has been steadily increasing, posing stringent thermal-structural challenges to core components [1,2]. Studies have shown that increasing the gas temperature significantly enhances propulsion efficiency and power density. However, it also intensifies the thermal deformation mismatch between turbine blades and the casing under high-temperature conditions, making rotor-stator clearance control one of the critical factors affecting engine performance and service life.
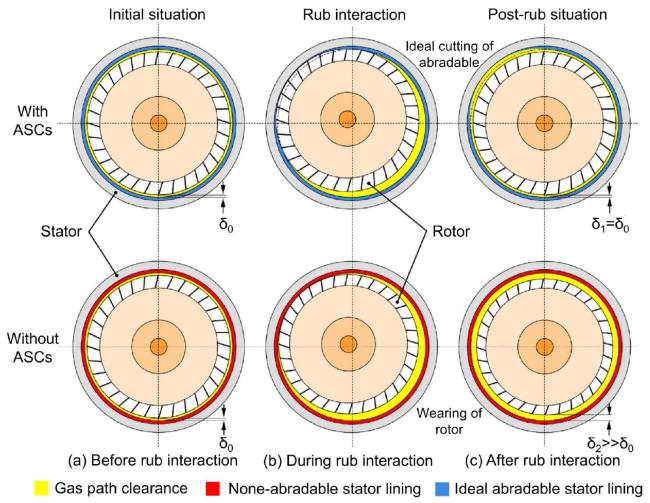
Precise control of blade tip clearance not only improves engine efficiency and reduces specific fuel consumption but also effectively mitigates the risks of failures, such as compressor surge and high-pressure leakage [3]. Studies have shown that an increase of 0.127 mm in the radial clearance of high-pressure turbine blade tips can lead to approximately a 0.5% rise in specific fuel consumption, while a 0.076 mm increase in the compressor's radial clearance may cause about a 1% increase in fuel consumption [4]. However, under actual operating conditions, it is difficult to maintain the optimal clearance between rotating and stationary components due to the combined effects of differential thermal expansion and creep from high-speed blade rotation, as well as manufacturing and assembly tolerances [5]. To address this challenge, ASCs are widely applied to the inner casing of engines. These coatings enable adaptive sealing by allowing the blade tips to intentionally cut into the coating during the early stages of operation, thereby achieving a balance between gas tightness and structural integrity [6,7]. Conversely, abrasive coatings are applied to blade tips, forming a cooperative sealing pair with the casing to enhance flow path sealing efficiency [8,9]. The evolution of rotor-stator clearance with and without ASCs before and after rub interactions is illustrated in Fig. 1. Initially, the clearances are identical. During engine operation, if an ASC is present, the rotor preferentially wears the abradable layer on the stationary component with minimal impact on the overall clearance. In contrast, if the stationary surface lacks an abradable coating, direct contact between rotating and stationary parts leads to mutual wear and increased clearance [10].
Traditional metal-based abradable sealing coatings have been widely used in service environments below 1100∘C due to their good machinability and controllable mechanical properties [11,12]. However, with the continuous increase in the thrust-to-weight ratio of aeroengines, turbine inlet temperatures are expected to exceed 1800∘C, pushing the service temperature requirements of ASCs to above 1200∘C, and in some cases up to 1350∘C [13]. Under such extreme conditions, metal-based coatings suffer from severe issues, including softening, oxidation, and strength degradation, making them unsuitable for stable operation at ultra-high temperatures. As a result, ceramic materials, which offer higher melting points and superior thermal stability, are being increasingly adopted. Ceramic-based abradable sealing coatings have thus become a focal point of current research.
Although ceramic-based abradable sealing coatings possess inherent advantages in thermal stability, they also introduce new challenges. Their high hardness and brittle nature can cause excessive wear on blade tips, while their low fracture toughness limits their thermal shock resistance. In addition, the mismatch in thermal expansion coefficients between the ceramic coating and substrates such as high-temperature alloys or ceramic matrix composites (CMCs) can lead to interface incompatibility and thermal fatigue cracking. The situation is further complicated by chemical corrosion induced by steam and molten CMAS (CaO-MgO-Al2O3-SiO2) particles present in the combustion exhaust, which significantly deteriorate the coating's service reliability. Therefore, ensuring high-temperature stability while maintaining desirable abradability, mechanical properties, and corrosion resistance is a critical challenge. Achieving this balance lies at the core of designing multifunctional ceramic-based ASCs.
To address the aforementioned challenges, researchers have explored multiple dimensions, including material systems, structural regulation, and process optimization. Key design strategies have been developed, such as pore structure tailoring, incorporation of lubricating phases, multilayer architecture design, nanocomposite structuring, and self-healing functionalities. These approaches have collectively advanced ceramic-based abradable sealing coatings toward applications under more extreme service conditions and longer lifespans. In particular, as CMCs are gradually replacing conventional high-temperature alloys in hot-section components, the development of multifunctional coating systems that combine environmental barrier capabilities with abradability has emerged as a critical trend in the evolution of high-temperature sealing coatings.
Hence, this paper provides a systematic overview of the development status of ceramic-based abradable sealing coatings, focusing on four key aspects: material composition, fabrication techniques, structural design, and performance evaluation (Fig. 2). Particular emphasis is placed on current research and design strategies aimed at the multifunctional optimization of coating performance under complex high-temperature environments. By summarizing existing studies and representative cases, this work aims to offer both theoretical insights and engineering guidance for the structural design of next-generation high-temperature ceramic-based sealing coatings, thereby promoting their practical application in future aeroengines.
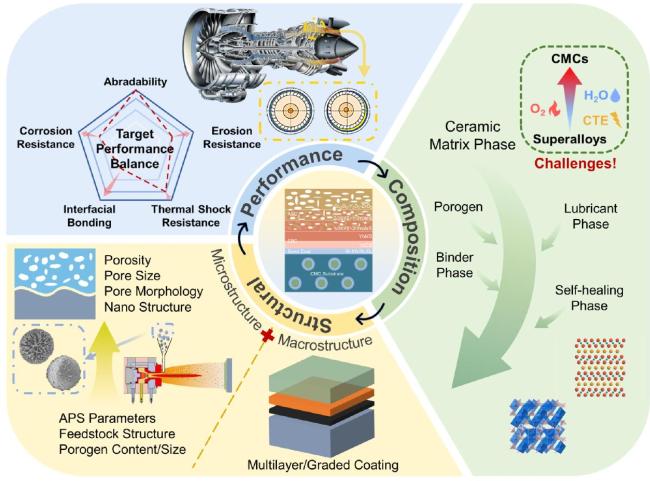
Fig. 2. A review of composition and structural design strategies for ceramic-based ASCs. |
2. Basic composition and preparation methods of ceramic matrix high-temperature abradable sealing coatings
Abradable high-temperature sealing coatings are used under high-temperature, high-speed rubbing conditions. The coatings should be scraped by blades without causing damage and should conform to the counter-face shape to ensure gas tightness. After friction, the surface should remain smooth and flat to minimize aerodynamic losses, and the wear debris should be fine enough to avoid damage to the downstream gas path. In addition, the coating must withstand the intense impact of high-speed gas flow and solid particles, ensuring stability and durability [14]. The requirement for abradability demands minimizing the hardness of the sealing coating as much as possible, while erosion resistance requires maximizing the surface hardness of the coating. The design of the coating's pore structure is key to resolving this contradiction. In addition, abradable sealing coatings also need properties such as thermal shock resistance and corrosion resistance. To combine the above various properties and achieve a balance, methods such as composite materials and multi-layer composite coating design are commonly used to prepare ASCs.
2.1. Basic composition
Currently, the top layer of ASCs mostly consists of a matrix phase, a lubricating phase, and a certain amount of micropores [15]. Among these, the matrix phase material is usually a metal or ceramic phase possessing certain oxidation resistance, corrosion resistance, and erosion resistance. Common ceramic phases include yttria-stabilized zirconia (YSZ), ytterbium disilicate, etc. The lubricating phase is used to provide abradability, reduce the coefficient of friction, and disrupt the continuity of the matrix to ensure that the "spalled" fragments are sufficiently small, preventing blockage of cooling holes or causing downstream erosion. Commonly used high-temperature lubricating phase materials include hexagonal boron nitride (h-BN), calcium fluoride (CaF2), and MAX phases [16]. Compared to wear-resistant coatings, abradable sealing coatings require high porosity and low hardness to ensure good abradability. Coating porosity can be increased, on one hand, by adjusting thermal spray process parameters; on the other hand, by introducing pore-forming phases such as polyhydroxybutyrate (PHB) into the feedstock powder. Subsequent heat treatment then forms pores in situ, thereby increasing the porosity of the coating[17].
2.2. Preparation technology
ASCs are mostly manufactured by thermal spraying, among which flame spraying (FS) is often used for medium-to-low temperature ASCs, while plasma spraying is commonly used for high-temperature ASCs [12]. In the preparation of ceramic matrix ASCs, atmospheric plasma spraying (APS) technology is most frequently employed. The principle of this spraying technology [18] is: the plasma arc generated between the cathode and anode heats and ionizes the working gas, forming a plasma jet ejected from the nozzle; the injected spray powder is heated by the plasma flame and becomes molten or semi-molten; entrained by high-pressure gas, the heated and softened powder is propelled forward; when the high-temperature, high-velocity powder particles reach the pre-treated substrate surface, they create intense impact and collision, instantaneously deforming upon the substrate surface. The molten powder rapidly cools and contracts, finally flattening and spreading onto the substrate surface; as spraying time increases, powder particles continuously impact and adhere to the substrate surface, bonding to each other in an interlocked manner, ultimately forming a firmly bonded coating.
The microstructure of a plasma-sprayed coating is described as a lamellar stack containing microcracks and pores. When the number of voids and microcracks in the coating reaches a certain level, it reduces the overall thermal conductivity of the coating and improves abradability. Furthermore, APS technology features high coating preparation efficiency, fast deposition speed, and low cost, making it one of the most economical and effective methods for preparing porous ceramic coatings [19].
2.3. Material systems
Before the emergence of ceramic matrix ASCs, turbine gas path seals were typically made from all-metal structures. As temperature requirements increased, metal-based coatings could no longer meet service demands. Ceramic matrix coatings with higher melting points thus came into the view of researchers. Thermal barrier coatings (TBCs) applied in similar service environments cannot be directly used as abradable coatings due to their high hardness. Soft phases must be added to TBCs or porosity deliberately created to make them easier to abrade. Furthermore, for higher service temperatures, superalloy substrates themselves can no longer meet the requirements. The demand for CMCs with better thermal stability and lighter weight is growing, making the development of ASCs suitable for CMCs particularly important. Therefore, multifunctional ASCs based on environmental barrier coatings (EBCs) have been developed and applied onto CMC substrates.
2.3.1. High-temperature abradable sealing coatings with superalloy substrates
According to the requirements of the service environment, a good ASC must possess the following properties: (a) Good phase stability at high temperatures, avoiding the destruction of coating integrity due to phase transformation or oxidation; (b) A coefficient of thermal expansion (CTE) close to that of the superalloy substrate, avoiding stress-induced coating delamination or cracking caused by CTE mismatch; (c) Low thermal conductivity to reduce the temperature of the substrate; (d) Moderate mechanical properties, maintaining a balance between abradability and erosion resistance; (e) Excellent resistance to hot corrosion in the surrounding environment, especially resistance to CMAS corrosion.
The basis for the coating maintaining stability without spalling during thermal cycling is having a coefficient of thermal expansion close to that of the substrate. YSZ considered a relatively mature thermal protection material, is widely used in TBCs research due to its favorable properties, including a coefficient of thermal expansion that matches superalloys (10.7×10⁻⁶ K-1), low thermal conductivity, excellent oxidation resistance, and good thermal stability [20]. Compared to other preparation methods, APS-prepared YSZ coatings have more controllable porosity and lower strength. This not only benefits abradability but also provides the coating with better strain tolerance under thermal shock conditions, favoring coating stability during hightemperature service [21]. To disrupt the continuity of the YSZ matrix and improve friction performance, high-temperature solid lubricants represented by h-BN are often added to YSZ coatings [22-24].
Pure ZrO2 undergoes a phase transformation from monoclinic to tetragonal phase at 1170∘C; the accompanying volume expansion can cause cracks in the coating. Although the added Y2O3 can effectively suppress the phase transformation, as the service temperature rises above 1200∘C, YSZ-based sealing coatings reach their upper temperature limit [25]. Sporer et al. [26] reported in a patent a dysprosia-stabilized zirconia (DySZ) abradable material that remains stable at a service temperature of 1200∘C. As shown in Fig. 3, compared to commercial YSZ-based coatings, both YbSZ and DySZ exhibit higher phase stability temperatures and better thermal shock resistance [10]. Cui et al. [24] prepared porous DySZ coatings via APS and studied the residual stress state before and after thermal shock testing using Raman spectroscopy. They demonstrated that after heat treatment at 1100∘C, the surface stress of the coating transformed from tensile stress to compressive stress, and the surface hardness and Young's modulus increased rapidly during the initial stage of heat treatment and then remained stable. However, while thermal stability is improved, this also brings higher hardness, which causes more severe wear to the blade tips. To avoid damage to the blade tips, ASCs need sufficient abradability. It is reported that the porosity of ceramic-based ASCs, especially DySZ coatings, needs to reach 30% to meet the requirement for smooth cutting by bare blades [12].
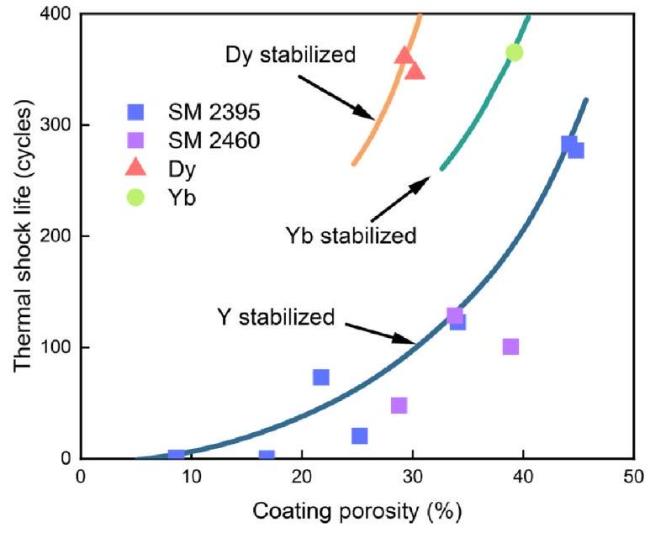
Fig. 3. Thermal shock life of ceramic ASCs as a function of their porosity[10]. |
To satisfy the abradability requirements of blades for coatings at higher service temperatures, Ebert et al. [27] constructed ASCs using a top layer of lower-hardness magnesium aluminum spinel coating and a middle layer of YSZ. This exhibited good abradability, and they clarified that its failure mechanism is mainly the spallation of the surface magnesium aluminum spinel coating. Through such a multilayer coating design, the service temperature was increased to around 1400∘C. Due to their excellent thermal stability, homologous layered InFeO3(ZnO)m compounds have attracted researchers' attention. Qu et al. [28] studied the thermophysical and mechanical properties of the InFeO3(ZnO)m material system synthesized by solid-state reaction. They found that it exhibits good thermal stability from room temperature to 1400∘C, possesses a coefficient of thermal expansion and thermal conductivity comparable to YSZ, and has lower hardness and friction coefficient, suggesting it is a promising matrix material. However, due to its low hardness, its erosion resistance is difficult to meet service requirements. Based on this, Kondrat et al. [29] used high-energy ion irradiation to modify the matrix, increasing the hardness of the InFeZnO4 material to improve the surface hardness and erosion resistance of the coating.
LaMnAl11O19 (LMA) with a magnetoplumbite structure exhibits outstanding thermal stability up to 1600∘C, low thermal conductivity, and high fracture toughness, making it a potential next-generation TBC material. Researchers hope to impart porosity to LMA coatings to give them abradability. Huang et al. [30] prepared an abradable top layer based on LMA and studied its isothermal oxidation behavior and thermal shock performance at 1300∘C. They found that the porosity distribution in the coating was uneven, with interconnected pores. While this is beneficial for material removal mechanisms, improving abradability to a certain extent, it also reduces cohesion, leading to severe cracking of the coating during operation and ultimately affecting its thermal shock performance.
Table 1 Regulation of coating porosity and microhardness [37]. |
| Feedstock | Power(kW) | Stand-off Distance (mm) | Porosity (Heat-treated) (% area) | Microhardness (Heat-treated) (HV0.1) | |
|---|---|---|---|---|---|
| EBC | YbDS | 24 | 150 | 5.6±0.4 | 783.1±28.1 |
| ASC1 | YbDS | 12 | 125 | 8.8±0.8 | 695.6±42.3 |
| ASC2 | YbDS + 1.5wt% PE | 12 | 125 | 14.4+0.9 | 633.5+27.6 |
| ASC3 | YbDS + 4.5wt% PE | 12 | 125 | 18.9±2.1 | 553.9 + 50.0 |
Compared to YSZ, yttrium aluminum garnet (YAG) has phase stability up to 1600∘C and better CMAS corrosion resistance. Using the SPPS (Solution Precursor Plasma Spraying) process, horizontal pores with different porosities can be generated in the microstructure of YAG coatings. By adjusting spraying parameters, Kumar et al.[31] prepared double-layer YAG coatings with different porosities on the substrate: a thin, dense intermediate layer and a thick, porous top layer. The dense intermediate layer acts as a thermal barrier and protects against CMAS corrosion, while the porous top layer serves as the abradable coating.
2.3.2. High-temperature abradable sealing coatings with CMC substrates
As service temperatures continue to rise, superalloy substrates gradually fail to meet usage requirements. As their replacements, CMCs are developing rapidly, creating an urgent demand for ASCs applied on CMC substrates. Due to thermal expansion coefficient mismatch, ASCs with YSZ as the matrix phase cannot be directly used on CMC surfaces. Simultaneously, because of the severe water vapor corrosion problem of SiC-based ceramics, ASCs for CMC substrates need the ability to block water vapor penetration. For applications on CMC substrate surfaces, additional requirements are proposed for ASCs: (1) Having CTEs close to those of the CMC substrate; (2) Excellent resistance to hot corrosion, encompassing both water vapor corrosion and CMAS corrosion.
Since the three-layer BaO-SrO-Al2O3-SiO2 (BSAS) EBC possesses a thermal expansion coefficient matching SiC-CMCs and low silica activity, it has been proven effective for protecting SiC-CMCs as an environmental barrier coating [32]. Guo et al. [33] prepared a BSASpolyester coating based on this. By effectively controlling the polyester content, they regulated the coating porosity and hardness, obtaining an ASC with high porosity (∼30%) and low hardness (∼57.7 HR45Y), which exhibited excellent abradability. The primary failure mechanism of BSAS-based coatings under extended high-temperature conditions is the formation of a glass phase, which promotes coating spallation. [32].
Rare earth silicates nearly satisfy all requirements for environmental barrier coatings. They have attracted widespread attention due to their thermal expansion coefficient matching SiC CMCs, high-temperature phase stability, good chemical compatibility with the substrate, low thermal conductivity, and excellent resistance to water vapor/oxygen and CMAS corrosion. Simultaneously, due to their relatively low hardness, they may be a material suitable for ASCs. Costa et al. [34] calculated the silicon volatility rate of rare earth silicates and found that under the same conditions, monociliate exhibit lower volatility than their corresponding disilicates, demonstrating superior resistance to water vapor/oxygen corrosion. Additionally, Yb2SiO5 (YbMS) possesses excellent high-temperature phase stability and low thermal conductivity, making it a promising candidate EBC system. However, the CTE of YbMS (7.5×10⁻⁶ K-1) significantly mismatches that of the SiCf/SiC CMC substrate (4.5-5.5×10⁻⁶ K-1), making it prone to cracking and spallation at the interface between the EBC and the bond coat during service. Therefore, Yb2Si2O7 (YbDS), which has weaker water vapor/oxygen corrosion resistance than YbMS but matches the CTE of the SiCf/SiC CMC substrate (4.5×10⁻⁶ K-1), has gradually replaced YbMS as a research hotspot for EBC materials [35]. Poor corrosion resistance is detrimental for an EBC in high-temperature water vapor/ oxygen environments, but the increased porosity resulting from selective volatilization of Si from the coating surface benefits the abradability of ASCs. This may become a new approach for constructing abradable sealing coatings based on EBCs [36].
Lynam et al. [37] utilized atmospheric plasma spraying to prepare YbDS EBCs and ASCs with porosities of 8.8%-18.9%. By adjusting APS parameters and polyester content, they achieved control over coating porosity and microhardness (as shown in Table 1). Qin et al. [38] prepared YbDS/h-BN composite coatings and reported their good abradability. The composites demonstrated lower hardness, reduced friction coefficient, increased wear rate, and a smaller IDR value compared to pure YbDS coatings. Tejero-Martin et al. [39] prepared YbDS coatings with porosity of 19.4%-21.3% and thickness around 1 mm, and studied the effect of CMAS corrosion on coating performance. They suggested that for ASCs, higher porosity facilitates the rapid infiltration of molten CMAS, potentially avoiding the blistering damage commonly reported for YbDS. To obtain low hardness and good abradability, minimizing damage to blades, good ASCs should have high porosity and large thickness. However, this may be detrimental to the coating's bond strength and erosion resistance. To address this, Xu et al. [40] used APS to prepare YbDS coatings with porosity between 23.3% and 35.5%, achieving desirable hardness (77.9-82.5 HR 15 Y) and high bond strength (7.8-9.0MPa), demonstrating excellent erosion resistance.
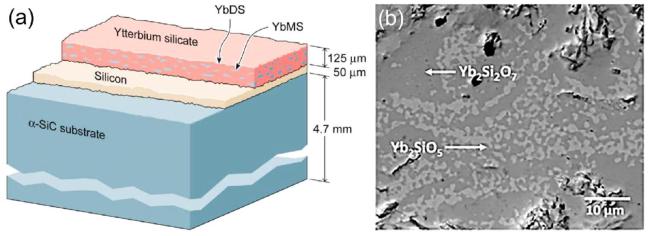
Although certain performance balance can be achieved in single-phase YbDS coatings through process optimization, its intrinsic vulnerability to water vapor and oxygen corrosion still limits its applicability in extreme environments. Given that YbMS exhibits superior thermal stability and corrosion resistance, combining it with YbDS can enhance the overall corrosion resistance of the coating. Currently, YbDS top layers are usually prepared using plasma spraying technology. During spraying, the preferential volatilization of SiO from the powder feedstock often leads to a deviation from the stoichiometric composition of YbDS, forming a composite coating consisting of both YbDS and YbMS, as shown in Fig. 4. Han et al.'s [41] research on the thermal shock resistance of YbDS coatings at 1500∘C confirmed that the presence of YbMS in the YbDS coating is beneficial. The evolution of YbMS from amorphous, metastable to stable crystalline phases can lead to crack healing in high-temperature environments. Furthermore, YbDS coatings mixed with 10-15% YbMS still maintained good bonding with the SiC substrate after 2000 h of cycling in a water vapor/oxygen environment at 1316 ∘C, with no significant cracking or spallation observed [42]. Additionally, after corrosion for 300 h at 1400∘C,Yb2O3, YbMS, and YbDS composite coatings showed that the YbDS-rich coating suffered severe corrosion, forming a porous reaction layer about 20μ m thick, while the YbMS-rich coating only formed a dense reaction layer 5-6μ m thick, demonstrating superior resistance to water vapor/oxygen corrosion [43]. The above studies indicate that YbMS-YbDS composite coatings can alleviate the CTE mismatch between the top layer and the bond coat, while improving thermal stability and thermal shock resistance at high temperatures. They also compensate for the insufficient water vapor/oxygen corrosion resistance of YbDS and the poor thermal shock resistance of YbMS. Furthermore, researchers have enhanced the service temperature and corrosion resistance of coatings by modifying the matrix phase. Ou et al. [44,45] prepared YbMS top layers modified with ZrO2 and Al2O3, respectively, and found that the addition of the secondary phase significantly extended the coating's service life at 1500∘C and effectively suppressed water vapor corrosion.
Since EBC-based ASCs have high porosity, their defect structure may be insufficient to block water vapor penetration, limiting their protective capability for CMC substrates. Faced with these complex performance requirements, a single coating layer is difficult to meet all demands, making multilayer coating design often a reasonable choice. Huang et al. [46] used APS to prepare a Si/YbDS/LMA coating as an interlayer on SiCf/SiC CMC substrates to alleviate thermal mismatch stress and block water vapor corrosion. A porous YSZ outer layer was then applied as the abradable coating. This coating system exhibited excellent thermal stability; even after 2000 thermal shock cycles, although numerous macroscopic cracks appeared along the length direction on the coating surface, no spallation occurred.
CMAS corrosion has long been a critical research topic in TBCs studies, while it is equally critical for EBCs. Current research reveals two primary failure mechanisms of CMAS attack on EBC topcoats [13]: (1) recrystallization of monosilicates with CMAS within solid solutions, forming acicular microstructures; (2) penetration of molten CMAS along grain boundaries, generating expansion gradients within the coating that induce blistering damage. As depicted in Fig. 5a, the corrosion mechanism of YbMS involves dissolution of the monosilicate phase, followed by precipitation of acicular apatite-type particles intermixed with residual CMAS regions, ultimately forming a reaction layer that leads to coating failure. In the YbDS case illustrated in Fig. 5b, initially formed apatite particles exhibit coarser dimensions, with no distinct reaction front observed within the irregular reaction layer. As corrosion progresses, molten CMAS preferentially attacks YbMS-rich regions in the coating. Given the lamellar structure characteristic of plasma-sprayed coatings, YbMS-rich splats align parallel to the surface, thereby promoting rapid lateral advancement of the reaction front. This process culminates in the formation of transverse cracks as shown, which propagate rapidly and cause catastrophic coating failure. These observations demonstrate that both chemical composition and coating morphology significantly influence CMAS-induced failure mechanisms in EBC systems.
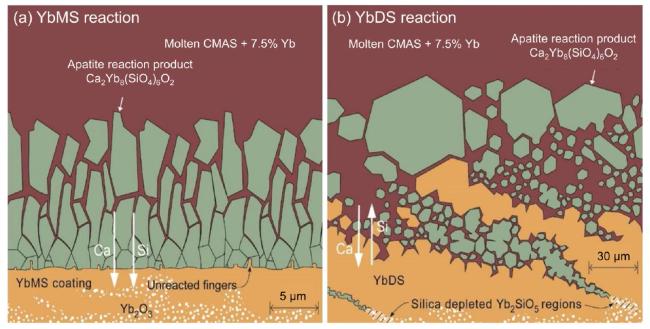
Fig. 5. CMAS corrosion failure mechanism of EBCs [47]. |
For multilayer coatings, alleviating interlayer stress mismatch is a critical issue. To mitigate thermal stress mismatch between layers and extend service life, researchers have rationally designed and constructed graded coatings. For instance, Jing et al. [48] formed a gradient between the top-layer Sc2O3-Y2O3-ZrO2 abradable coating and the middle-layer YbMS EBC by adjusting the YbMS powder content, which not only improved the bonding strength of the abradable coating to some extent but also significantly enhanced its thermal shock resistance compared to non-graded coatings.
In actual service environments, the failure challenges faced by coatings are not isolated but rather complex and mutually coupled. For example, during service, ASCs may experience stress-induced cracking and microcrack formation caused by thermal shock, as well as erosion, CMAS corrosion, and water-oxygen corrosion, all of which can lead to coating failure. Moreover, such damage is not a simple superposition of individual factors; instead, they interact and act synergistically. Microcracks generated by thermal stress not only cause coating fracture but also provide rapid pathways for corrosive species. Since single-factor experiments cannot fully replicate real service conditions, it is necessary to consider failure analysis under multi-physics coupling and to adopt an integrated approach to material design at the early stages. Table 2
Table 2 Comparison of key performance indicators of coating materials for ASCs. |
| Material | Service temperature ( ∘C) | CTE (×10-6 K-1) | Thermal stability | Key advantages | Limitations |
|---|---|---|---|---|---|
| YSZ | < 1200 | ∼10.7 (matches superalloy) | Good | Mature system, tunable porosity, good oxidation resistance | Upper temp limit ∼1200∘C, poor CMAS resistance |
| DySZ | ~1200 | Similar to YSZ | Better than YSZ | Improved phase stability, thermal shock resistance | Higher hardness, more blade wear |
| YbSZ | ~1200 | Similar to YSZ | Better than YSZ | Good thermal stability | Limited service temperature range |
| InFeO3(ZnO)m | < 1400 | ∼11.5 | Stable up to 1400∘C | Low hardness, good abradability | Poor erosion resistance |
| LMA | < 1600 | - | Excellent | High fracture toughness, low thermal conductivity | Uneven porosity, cracking under shock |
| YAG | < 1600 | - | Excellent | Good CMAS resistance, tunable porosity (SPPS) | - |
| BSAS | < 1300 | 4-6(matches CMCs) | Good | Good abradability, low silica activity | Glass phase formation at high temperature |
| YbMS | < 1500 | 7.5 | Excellent | Good thermal stability | CTE mismatch, interface spallation |
| YbDS | < 1400 | 4.5 | Good | Good CTE match, abradability | Poor water vapor/oxygen corrosion resistance |
3. Design strategies for coating composition and structure
Ceramic-based abradable sealing coatings are required to meet a variety of complex performance demands during service. Their performance design is not only constrained by the intrinsic physical properties of the materials but also must account for dynamic responses and multi-physical coupling behaviors under actual operating conditions (as shown in Table 3). Overall, a high-performance coating should achieve a balanced combination of the following core attributes: excellent abradability, superior erosion resistance, thermal shock stability at high temperatures, strong interfacial bonding strength, and high-temperature corrosion resistance. However, these performance indicators often impose conflicting requirements on the coating design. For instance, increasing porosity enhances abradability and thermal shock tolerance but reduces mechanical strength and erosion resistance; incorporating lubricating phases helps lower the friction coefficient, yet may compromise structural integrity; multilayer architectures can realize multifunctionality but may introduce interfacial mismatch and thermal stress complications.
Table 3 Contradictions among key performance indicators of coatings. |
| Performance Indicator | Functional Role | Enhancement Strategy | Negative Impacts |
|---|---|---|---|
| Abradability | Maintains blade-clearance control and avoids blade damage | Reduce hardness and increase porosity | May decrease bonding strength and erosion resistance |
| Erosion Resistance | Withstands high-speed particle impact | Increase surface hardness | May lead to increased blade wear and reduced abradability |
| Thermal Shock Resistance | Resists rapid temperature fluctuations, extends service life | Increase porosity and/or introduce nanostructures | May reduce mechanical strength |
| Corrosion Resistance | Resists water vapor and CMAS (calcium-magnesium-alumino-silicate) corrosion | Employ corrosion-resistant ceramic phases | Often associated with higher hardness or thermal stress |
| Bonding Strength | Enhances the durability of multilayer structures and prevents delamination | Surface texturing or bonding phase design | Risk of bonding phase oxidation or thermal stress accumulation |
Therefore, the key to achieving these performance objectives lies in rational material selection and structural design, aiming to establish a dynamic balance among abradability, mechanical strength, thermal shock resistance, corrosion resistance, and interfacial bonding. In the following sections, several representative structural optimization strategies will be systematically discussed, including pore structure regulation, nanocomposite architectures, incorporation of lubricating and bonding/self-healing phases, multilayer coating design, and surface texturing. These strategies aim to establish explicit relationships between structural design parameters and the multifunctional performance in ASCs.
3.1. Pore structure regulation
In exploring the wear mechanisms of ASCs, researchers have applied various models based on the weakest-link theory to describe the strength of brittle materials. Building on such studies, Seuba [49] conducted Weibull analysis and found that the strength of porous ceramics primarily depends on total porosity, while also being influenced by the spatial distribution and morphology of the pores. Irissou [50] designed CoNiCrAlY coatings with varying surface hardness and porosity, and evaluated their bonding strength, erosion resistance, and tribological performance. The results indicate that a higher porosity reduces surface hardness and facilitates wear behavior, but it also leads to a deterioration in erosion resistance and overall mechanical properties. Moreover, the pore structure exerts a significant influence on the coating's thermal shock resistance and corrosion resistance. These findings underscore the critical role of pore structure control in the design of ASCs. For ceramic coatings, pore structure can be adjusted through three main approaches: pore-forming agents, spray process parameter optimization, and feedstock powder structure design.
3.1.1. Addition and modification of pore-forming agents
Incorporating pore-forming agents is the most fundamental method for tailoring the porosity of coatings. By adding specific agents to the ASC system, volatile components are removed during thermal spraying or post-deposition treatment, leaving behind uniformly distributed pores. Ideal pore-forming agents should (a) decompose or volatilize at a suitable temperature, (b) generate a defined pore structure, (c) leave minimal residue, and (d) disperse homogeneously within the coating material.
Common pore-forming agents fall into two categories: inorganic and organic. Inorganic options include ammonium carbonate, ammonium bicarbonate, calcium carbonate, graphite, and coal powder, while organic agents encompass materials such as PHB, high-density polyethylene (HDPE), polyether ether ketone (PEEK), and starch [51]. Due to their good dispersion and pyrolysis behavior, degradable organic polymers are frequently employed in ASC systems. Cui [52], for instance, used medium-density polyethylene (MDPE) and PEEK as pore-forming agents mixed with nano- ZrO2 powders for plasma spraying, confirming that these additives increased porosity, which was further enhanced after heat treatment. PEEK, with a higher melting point (334 ∘C), exhibited superior pore-forming capability. PHB is widely used as a pore-forming agent for high-temperature ASCs due to its good thermal stability and relatively high thermal conductivity [23,24]. However, during plasma spraying, PHB may undergo partial melting rather than complete decomposition, resulting in non-uniform pore distribution. To mitigate PHB loss during spraying, researchers have employed high-melting-point ceramic coatings as protective shells. Cheng [53] and Ding [54] successfully coated PHB particles with Al2O3, ZrO2, and TiO2, effectively shielding them from the plasma flame and preventing premature decomposition. Inorganic pore-forming agents like CaCO3, with their higher decomposition temperatures, have also been adopted to reduce combustion loss during spraying and ensure more stable pore control [55]. However, residual CaO from CaCO3 decomposition may adversely affect coating performance. It is important to note that increasing porosity enhances abradability and thermal shock tolerance but may also compromise mechanical strength and bonding performance [56].
3.1.2. Spray parameter optimization
During coating deposition, adjustments to APS parameters can significantly influence microstructure and functional properties. Lynam [37] demonstrated that by modifying plasma power and spray distance during YbDS coating deposition, one can precisely control porosity, phase composition, and hardness. Reducing spray power keeps particle temperatures below the melting point of YbDS, promoting the formation of high-porosity, low-hardness ASCs.
Aussavy [20] investigated YSZ-based coatings by adjusting both the content of polyester pore-forming agents and APS parameters. As shown in Table 4, their results indicated that pores larger than 40μ m were predominantly determined by polyester particles, whereas those smaller than 40μ m were mainly governed by APS parameters. Among these, arc current and spray distance had the most significant effects. These parameters influence the temperature and velocity of the particles upon impact with the substrate, thereby determining pore content and size. Lower arc currents and longer spray distances yielded coatings with higher porosity and larger pore sizes, beneficial for abradability and thermal insulation. However, excessive porosity may reduce the coating's Young's modulus, adversely affecting its erosion resistance.
Table 4 Influence of manufacturing process parameters on coatings microstructure and properties[20]. |
| Influence relative to the reference spraying parameters set of spraying parameters on coatings' structural attributes and properties | |||
|---|---|---|---|
| High | Medium | Low | |
| Void content | |||
| Increase | None | None | |
| Decrease | | I+,Ar- | |
| Void size | |||
| Increase | | I- | |
| Decrease | | I+ | |
| Wear erosion resistance | |||
| Increase | I+ | | H2 +,Ar-,Ar+ |
| Decrease | I- | | |
| Calculated Young modulus | |||
| Increase | | I-,Ar+ | I+,H2 +,H2 -,Ar- |
| Decrease | None | | |
| Calculated thermal conductivity | |||
| Increase | | I+,Ar+ | H2 +,H2 -,Ar- |
| Decrease | | I- | |
*I: Arc current intensity; Ar: Argon plasma forming gas flow rate; H: Hydrogen plasma forming gas fraction; Dspray : Spraying distance; dpowder: powder feed rate. ** + :Increase; -: Decrease. |
3.1.3. Feedstock powder structure design
In thermal spraying, molten or semi-molten particles accumulate on the substrate to form a lamellar structure. During cooling, residual stresses often lead to the formation of lamellar pores parallel to the substrate surface [57]. These flat defects create stress concentrations, allowing cracks to propagate along internal interfaces, which can ultimately result in severe coating delamination [58]. Moreover, nearsurface regions of coatings with lamellar porosity tend to densify during service, leading to increased hardness and reduced abradability. To address these issues, Kang [59] proposed a strategy using hollow spheres as structural skeletons embedded within the coating, producing spherical pores. Fig. 6a shows the SEM image of the sprayed particles, clearly illustrating the hollow spherical structure. The optimized spraying parameters allowed the Ni shells to melt and fuse the hollow spheres together, while maintaining the porous structure. As a result, the coatings exhibited both strong interparticle bonding and superior abradability. Electrostatic spray-assisted phase transformation (ESP) has been employed to fabricate feedstock powders with hierarchical pore structures for TBC applications [60]. As reported in our earlier study [61], this method was applied to develop YSZ powders with radiating porous microstructures (as shown in Fig. 6b), resulting in coatings featuring both micron-scale pores and uniformly distributed intra-splat nanopores. Compared to hollow-sphere-derived coatings, those prepared via ESP exhibited longer thermal cycling lifetimes, enhanced sintering resistance, and lower initial thermal conductivity [62]. This micro/nano-scale dual-level porosity shows great promise for achieving coatings with high abradability and thermal shock resistance while maintaining adequate erosion resistance.

Overall, the three pore structure regulation strategies exhibit complementary features: sacrificial phase methods provide high precision but limited scalability, process-parameter control offers good tunability but relies heavily on spraying conditions, and multilayer structural design enhances applicability at the expense of structural complexity.
3.2. Nanostructured composite design
Since the 1990s, nanoceramic powders have been increasingly incorporated into thermal spray coatings. For ASCs, nanostructured composite coatings offer multiple advantageous properties. Compared to traditional lamellar thermal spray coatings, these coatings demonstrate not only improved wear resistance but also reduced hardness, which is beneficial for enhancing abradability. In addition, coatings with nanoscale features exhibit higher toughness and better resistance to crack propagation than their microscale counterparts, thereby improving thermal shock resistance during service. This improvement arises because conventional thermal spray coatings typically form a layered structure with weak interlamellar bonding, whereas in nanostructured coatings, semi-molten nanoparticles agglomerate to form dense nano-domains that enhance interfacial toughness and bonding strength [63]. The structure and performance of coatings prepared by different thermal spray techniques are compared in Table 5.
Table 5 Comparison of fabrication methods for nanocomposite coatings. |
However, the use of ultrafine powder feedstock faces significant challenges: poor flowability, strong agglomeration tendency, and difficulty in retaining nanostructure at high temperatures. These limitations render conventional APS techniques unsuitable for producing nanostructured coatings [69]. To address this, Wang et al. [70] developed YSZ-based ASCs with nanostructured features by adding YSZ nanoparticles into a YSZ precursor solution and employing solution precursor plasma spraying (SPPS). The resulting coatings exhibited a bimodal pore structure comprising both macro- and micropores. By adjusting the concentration of nanoparticles, the coating structure could be effectively tailored. Sun et al. [67] further investigated the thermal shock behavior of 8YSZ-based nanostructured ASCs prepared via SPPS. They found that the presence of fine vertical microcracks in the hybrid structure increased the coating's strain tolerance and inhibited the propagation of larger horizontal cracks along the interlamellar interfaces, thereby enhancing thermal stability.
To further compare nanostructured and conventional coatings, Sun et al. [64] fabricated a conventional abradable sealing coating (C-YSZ) using APS and a nanostructured variant (M-YSZ) using SPPS, as shown in Fig. 7. They systematically evaluated both coatings in terms of microstructure, mechanical properties, and oxidation resistance. Compared with C-YSZ, the M-YSZ nanostructured coating exhibited finer and more uniformly distributed pores, lower hardness, and reduced bonding strength. Under high-temperature oxidation, large horizontal cracks formed in the C-YSZ coating, while only fine vertical cracks were observed in M-YSZ. This behavior was attributed to the homogeneous distribution of nanoscale pores, which helped reduce the risk of coating delamination.
Fig. 7. SEM images of (a) APS coating (C-YSZ) and (b) SPPS coating (M-YSZ) [64]. |
Nevertheless, SPPS also presents inherent drawbacks. Due to the high solvent content in the precursor solution, significant thermal lag occurs during spraying as energy is consumed for solvent evaporation, reducing the thermal energy available for solute decomposition, which leads to low deposition efficiency. To address this limitation, Wang et al. [68] introduced the sol-precursor plasma spraying (Sol-PPS) technique for coating fabrication. Compared to SPPS, the Sol-PPS approach provided YSZ-based coatings with a more stable and loosely packed microstructure, while also lowering the friction coefficient, enhancing bonding strength, and preserving surface hardness. This approach is considered an effective strategy to improve both and overall performance of ASCs.
3.3. Incorporation and modification of lubricating phases
Ceramic coatings are typically characterized by high hardness and brittleness, which often result in high friction coefficients and poor wear behavior. To improve the tribological performance of ASCs, the incorporation of appropriate solid lubricants is essential. The lubricating phase in ASCs serves multiple key functions:(1) acting as a "soft phase" within the matrix to modulate coating strength; (2) disrupting matrix continuity to ensure sufficiently fine wear debris; (3) providing self-lubrication to reduce the friction coefficient; (4) increasing strain tolerance, thereby improving fracture resistance and thermal stability. Importantly, due to the high-temperature service environment and the thermal spray deposition process, the lubricating phase must exhibit excellent thermal stability. As shown in Table 6, commonly used solid lubricants for ASCs and their performance comparisons are presented.
Table 6 Comparison of lubricating phase materials for high-temperature coatings. |
| Lubricating phase | High-Temperature stability | Friction coefficient | Abradability enhancement | Oxidation stability | Drawbacks | References |
|---|---|---|---|---|---|---|
| h-BN | Moderate | Low | Significant improvement | Poor | Easily forms oxides above 900∘C | [23,38,71,72] |
| CaF2 | High | Low | Good | Good | Melts at high temperatures; prone to infiltration | [73-75] |
| Ti3AlC2 | High | Moderate | Good | Good | Partial decomposition during spraying | [76-78] |
| LaPO4 | High | Moderate | Moderate | Good | Limited compatibility with YSZ | [79] |
Hexagonal boron nitride (h-BN), with its graphite-like layered structure and excellent corrosion resistance, is frequently used in high-temperature sealing coatings. Zhang et al. [23] incorporated h-BN into a YSZ matrix and reported a significant reduction in the coating's friction coefficient. Qin et al. [38] fabricated YbDS coatings containing various amounts of h-BN using APS, and found that h-BN effectively lowered hardness and created transition layers that reduced the friction coefficient and increased the volume wear rate-features beneficial to abradability. However, excessive h-BN content led to structural loosening and compromised coating stability. Despite its advantages, h-BN tends to oxidize above 900∘C, limiting its use in ultra-high temperature applications. In contrast, calcium fluoride (CaF2) is widely recognized as an ideal high-temperature lubricant due to its excellent thermal stability, low hardness, and low friction coefficient. Wang et al. [75] investigated the microstructure and properties of YbDS-CaF2 coatings prepared by APS. They observed that increasing CaF2 content led to higher porosity, reduced hardness, and lower friction coefficient. At room temperature, the dominant wear mechanism was abrasive wear, whereas at 900∘C, adhesive wear became prevalent.
Ali et al. [76] studied the tribological properties and wear mechanisms of YSZ-based ASCs by introducing a small amount of MAXphase Ti3AlC2 as a lubricating phase. During plasma spraying, partial decomposition and oxidation of Ti3AlC2 produced hard secondary phases that filled voids and enhanced overall hardness. As the Ti3AlC2 content increased, the coating's volume wear rate decreased, resulting in improved wear resistance. An optimal balance between abradability and wear resistance was achieved at 10wt%Ti3AlC2. Similarly, Hajian Foroushani et al. [79] incorporated LaPO4 into YSZ as a high-temperature lubricating phase, which not only improved frictional performance but also enhanced ablation resistance and increased porosity.
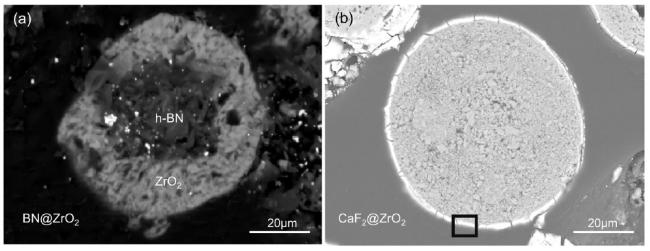
To improve compatibility with ceramic matrices and reduce combustion or oxidation losses during plasma spraying, coating the lubricating phase within the feedstock powder has proven to be an effective strategy, as illustrated in Fig. 8. As reported in our earlier study [71], ZrO2-coated h-BN powders were prepared and subsequently blended with YSZ, followed by deposition using APS. The coating approach significantly reduced h-BN degradation during spraying and improved compatibility with the ceramic matrix. Compared to uncoated systems, the modified coatings exhibited enhanced abradability and thermal stability. Zeng et al. [73] applied a similar strategy by coating CaF2 particles with ZrO2 and reported comparable improvements in performance.
3.4. Binder phases and self-healing mechanisms
Research on plasma-sprayed ceramic-based ASCs faces two major challenges: (1) the extremely low deposition efficiency of ceramic coatings, typically only 10-15%, which is significantly lower than the average 30-50 % efficiency of general thermal spray coatings; and (2) premature failure of the ceramic topcoat, including cracking and delamination during thermal cycling. These issues largely arise from the complex multilayer architecture of ASCs and the harsh service environments in which they operate. Introducing low-melting-point binder phases has proven to be an effective strategy to address both problems.
Nickel (Ni) is commonly used as a binder phase due to its low melting point and good bonding with both the substrate and the transition layer. Kang et al. [59] coated hollow spherical YSZ particles with a thin Ni film. During plasma spraying, the Ni melted and acted as a binder, forming a continuous spherical pore structure, which significantly improved the coating's bonding strength and thermal stability. Similarly, Zhang [23] introduced a small amount of Ni powder into an APS-deposited YSZ-based abradable coating and achieved enhanced bonding strength and thermal shock resistance, along with a deposition efficiency exceeding 70%.Cheng et al. [80] selected low-melting-point ceramic phases such as alumina (Al2O3), yttrium aluminum garnet (Y3Al5O12,YAG), and magnesium aluminate spinel (MgAl2O4) as high-temperature binders and mixed them into YSZ powder. As shown in Table 7, Plasma-sprayed coatings incorporating these phases showed improved deposition efficiency, with the YAGcontaining coatings achieving the highest improvement. Compared to pure YSZ coatings, the YAG-containing composite exhibited a 43.68% increase in thermal cycling life. As ceramic coating delamination is typically driven by the brittle nature of ceramics and the accumulation of thermal stress-induced cracks during cycling, the dispersion strengthening effect of YAG helped suppress crack growth and extend service life. Notably, failure locations in these composite coatings shifted toward the inner YSZ layers adjacent to the substrate. To further improve coating toughness, Cheng et al. [81] incorporated SiC whiskers into the YSZ matrix. These whiskers retained their structural integrity and remained uniformly dispersed after plasma spraying, further enhancing the thermal cycling performance of the YSZ-based sealing coatings. The toughening mechanisms of these SiC-reinforced coatings include residual stress relaxation due to the porous structure and crack bridging and pull-out effects of the whiskers [82].
Table 7 The functions of different binding phases[80]. |
| Deposition efficiency | Thermal cycles | Fracture toughness | Failure mechanism | |
|---|---|---|---|---|
| None | 10.37 % | 67.3 | 1.66MPa⋅m1/2 | Brittle fracture |
| Al2O3 | 18.23 % | - | - | - |
| MgAl2O4 | 29.19 % | 96.7 | 2.32MPa⋅m1/2 | Ductile fracture |
| YAG | 16.51 % | - | - | - |
In corrosion resistance and failure mechanism studies, it has been observed that ASCs tend to fail through crack propagation parallel to the coating surface, mainly due to their continuous porous structure. To mitigate this issue, researchers have explored crack self-healing strategies to promote localized sintering and close large pores, especially horizontal ones, thereby enhancing coating toughness and extending service life [83]. Self-healing approaches in ceramics are typically classified into two types:(1) the addition of special phases that oxidize at high temperatures to form glassy products, which fill and seal cracks; (2) the use of sintering aids to promote grain growth and densification at elevated temperatures, thereby redistributing internal defects.
However, for highly porous coatings like ASCs, relying on a single mechanism may not achieve effective self-healing.
For ASCs, h-BN is a common solid lubricant, but it tends to oxidize at around 1000 ∘C, forming B2O3. In view of the dual requirements of abradability and mechanical stability in ASCs, our group previously developed an APS coating using 8YSZ as the ceramic matrix, polyester as a porogen, and h-BN as a self-lubricating phase, forming a cartilageinspired porous architecture [84]. As illustrated in Fig. 9, a smooth glaze-like surface layer resembling cartilage is formed at high temperatures due to the presence of h-BN and its oxidation product B2O3. Meanwhile, the porous structure generated by the burnout of the porogen mimics the underlying bone-like framework. In service environments, B2O3 also acts as a sintering aid to promote crack healing, effectively enhancing the high-temperature stability of the coating. The synergy between the lubricating "cartilage" layer and the supporting porous "bone" structure significantly improves the high-temperature abradability of the ASC.
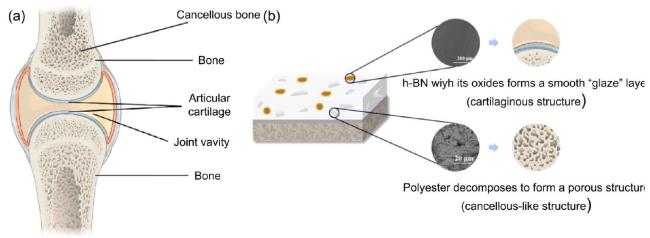
Fig. 9. The diagram of (a) knee articulation and (b) YSZ-based ASC with an articulation mimicking structure [84]. |
In the early development of EBCs, Nguyen et al. [85,86] incorporated 10vol%SiC nanoparticles into sintered YbDS/YbMS ceramic composites. Upon crack formation at 1250∘C, the SiC fillers reacted with ambient oxygen to produce viscous amorphous SiO2, which could infiltrate and seal the cracks. Subsequently, the SiO2 reacted with YbMS in the system to form YbDS, thereby achieving a crack-healing effect. Similar self-healing behavior of SiC was also demonstrated by Kim et al. [87] in the Sc2Si2O7/SiC system. While these studies highlight the potential of SiC as a self-healing phase, the dense microstructure of sintered ceramics differs significantly from the porous structure of thermally sprayed coatings. Moreover, SiO2 tends to react with steam at temperatures as low as 1200∘C to form volatile Si(OH)4, which is considerably below the expected service temperature of EBCs. If the kinetics of this volatilization reaction are faster than those of the SiO2-YbMS reaction forming YbDS, the intended self-healing mechanism may be rendered ineffective under high-temperature service conditions.
Due to their unique layered crystal structure and bonding characteristics, MAX phases have attracted significant attention for their self-healing capabilities. During plasma spraying or high-temperature service, MAX phases can oxidize to form Al2O3 and rutile-type TiO2 [77]. The volume expansion under compressive stress facilitates crack and pore closure. Additionally, TiO2 can dissolve into Al2O3 to form numerous cation vacancies, promoting solid-state diffusion and accelerating densification. Lee et al. [78] incorporated Ti2AlC MAX phase particles into mullite- YbMS composites and observed that the MAX phase acted as both a sintering aid and a self-healing agent. This significantly reduced the temperature and time required for crack healing and fully restored mechanical strength post-healing. Huang et al. [46,88] developed an abradable coating system using LaMgAl11O19 (LMA) as the structural matrix, polyester as the porogen, and Ti3AlC2 MAX phase as both lubricant and self-healing agent. After a high-temperature self-healing treatment at 1200∘C, the coatings were subjected to CMAS corrosion testing at 1300∘C for 2 h and 12 h. As shown in Fig. 10, increasing the content of Ti3AlC2 (TAC) led to a decrease in porosity, an increase in coating density, and the transformation of interconnected pores into isolated ones. Cracks gradually closed during the self-healing process. When the TAC content reached a threshold, the composite coating significantly reduced CMAS infiltration depth, demonstrating excellent corrosion resistance. Studies have demonstrated that the introduction of self-healing phases can effectively repair microcracks and significantly enhance the corrosion resistance and thermal shock resistance of coatings. However, most existing investigations have focused on ceramic sintered bodies or TBCs, leaving the question of how to implement this strategy in ASCs with abundant porous structures unresolved. Ensuring a uniform distribution of the self-healing phase and sufficient availability at the sites requiring repair will be crucial in determining its practical applicability in ASCs.
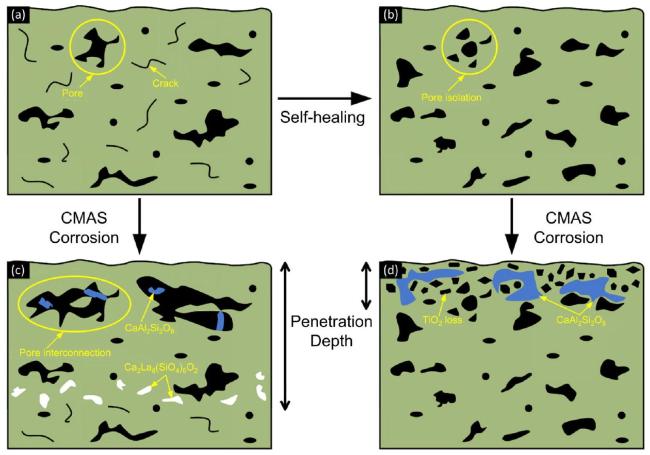
Fig. 10. Schematic diagram of the self-healing mechanism of porous LMA-based ASCs and CMAS corrosion behavior [88]. |
3.5. Multilayer structural design
For ASCs, especially those applied to CMCs, multiple functional requirements must be satisfied simultaneously-including abradability, high-temperature oxidation resistance, and environmental corrosion resistance. These often cannot be achieved using a single-layer coating, thereby driving the development of multilayer coating architectures to achieve multifunctional integration. A typical high-temperature ASC system generally includes a porous abradable topcoat and a bond coat underneath. For coatings on CMC substrates, an additional EBC layer must be introduced between the bond coat and the topcoat to prevent hydrothermal corrosion.
Due to mismatches in the CTE between the porous ceramic abradable layer and the CMC substrate, a bond coat is essential to provide both CTE compatibility and enhanced interfacial adhesion. However, after long-term service, reactions with atmospheric oxygen lead to the formation of a thermally grown oxide (TGO) layer between the bond coat and the topcoat. The TGO layer is a known weak link in multilayer coating systems. Once it reaches a critical thickness, cracking and coating failure may occur. Therefore, suppressing the formation and growth of TGO is crucial for enhancing coating durability, and the bond coat plays a pivotal role as the primary oxidation barrier [89]. On metallic substrates such as Ni-based superalloys, mature MCrAlY (M = Ni,Co, or Ni+Co) bond coats are widely used [20,73]. In contrast, for CMCs, Si-based bond coats are more common due to their CTE compatibility.
The incorporation of a Si bond coat significantly enhances the interfacial adhesion strength of EBCs and serves as a sacrificial layer during high-temperature service by forming a protective SiO2-based TGO layer. However, under thermal cycling conditions, the reversible α-β quartz phase transformation within the TGO layer can lead to approximately 5% volume shrinkage, potentially inducing cracking within the oxide layer [90]. In recent years, NASA [91] proposed a composite bond coat consisting of HfO2 and Si. In oxidative environments, Si preferentially oxidizes to form SiO2, which subsequently reacts with HfO2 to generate the HfSiO4 phase.
Table 8 summarizes the coefficients of thermal expansion (CTEs) of the individual phases in the HfO2-Si system, demonstrating that this reaction pathway avoids CTE mismatch while mitigating the volumetric instability associated with the SiO2 phase transformation [92]. Deijkers et al. [93] investigated the formation mechanism of HfSiO4 and found that its formation significantly reduces the thickness of the SiO2 layer, thereby improving thermal cycling resistance. Zhu [94] further reported that HfO2-Si bond coats exhibit high strength and fracture toughness, with a service temperature capability up to 1400∘C.
Anton et al. [99] fabricated Si-HfO2 bond coats with varying HfO2 doping levels via magnetron sputtering, and observed excellent thermal cycling performance without delamination caused by phase transformations. However, it has been noted that HfO2 doping in Si bond coats does not effectively suppress the growth rate of the TGO layer. The continuous HfO2 network provides rapid oxygen diffusion pathways, and excessive HfO2 content can accelerate the oxidation of silicon. Li et al. [92], using atmospheric plasma spraying (APS), prepared HfO2-Si bond coats with different compositions, and confirmed that those with lower HfO2 content exhibit superior thermal shock resistance at 1300 ∘C. Due to the relatively high Si content, oxidation of HfO2-Si bond coats is unavoidable in high-temperature air or steam environments. In steam at 1371 ∘C for 31 h, complete oxidation of elemental Si was observed, with TGO growth rates exceeding those in dry air.
Harder [98] employed plasma spray-physical vapor deposition (PSPVD) to prepare an EBC system with a HfO2/Si bond coat and a YbDS top coat. The coating exhibited excellent oxidation and steam corrosion resistance, and the presence of HfO2 effectively reduced TGO thickness and improved the bond coat's oxidation resistance. To further inhibit TGO growth and prolong coating lifespan, Lee et al. [99] modified APSdeposited Si/YbDS EBCs by incorporating various oxide additives. Their results indicated that low concentrations of TiO2,Al2O3, or Al2O3-containing compounds (e.g., mullite and YAG) effectively suppressed TGO growth, reducing its thickness by more than 80% under steam cycling conditions.
For ASC systems applied to CMC substrates, multiple performance requirements must be simultaneously met. Abradability demands a loose and porous microstructure; resistance to water vapor and CMAS corrosion requires a relatively dense structure that can prevent corrosive species infiltration; meanwhile, adequate interfacial bonding strength is also essential. These conflicting demands pose significant challenges to coating design. A multilayer coating architecture offers a straightforward yet effective solution. By stacking a bond coat at the bottom, an EBC in the middle, and an abradable top coat, such trilayer structures can simultaneously achieve water vapor resistance and abradability.
In studies of EBC systems, Fan [100] employed APS to fabricate a trilayer thermal environmental barrier coating (T-EBC) system composed of Si/YbDS/LMA, demonstrating effective protection of CMC substrates under high-temperature water vapor environments. Building upon this, Huang et al. [30,101] further deposited a porous YSZ top coat on the existing Si/YbDS/LMA system, and a thick porous LMA layer on a Si/YbDS/YbMS system, respectively. These multilayer coatings exhibited both favorable abradability and excellent corrosion resistance. Notably, the CTEs of Si,YbDS,YbMS, and LMA increase progressively (4.1, 5.5,7.5, and 9.2×10⁻⁶ K-1, respectively), bridging the thermal expansion mismatch between the CMC substrate and the YSZ top layer. This gradation effectively mitigates interfacial thermal stresses and reduces the risk of cracking.
Additionally, Guo [33] designed a multilayer structure comprising Si/80 % mullite + 20% BSAS/dense BSAS/porous BSAS (Fig. 11a). The system showed good abradability at 1100 ∘C, offering effective protection to both the CMC substrate and the rubbing blade tip. However, this study lacked in-depth evaluation of failure mechanisms and longterm thermal stability under extended high-temperature service. While multilayer architectures enable functional integration, they also introduce issues such as thermal expansion mismatch across interfaces and cracking during thermal cycling, which must be addressed in future work.
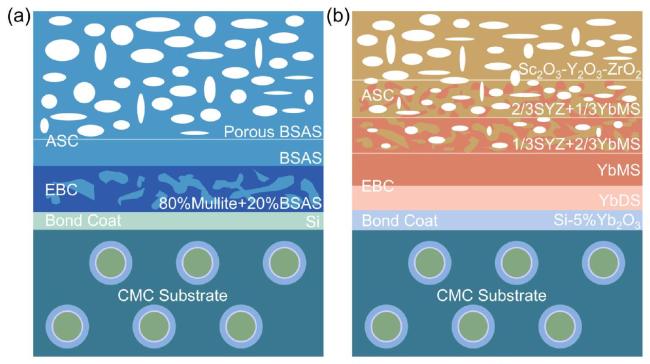
Gradient coating design is an effective strategy to alleviate the CTE mismatch in multilayer structures and prevent cracking during thermal cycling. As shown in Fig. 11b, Jing et al. [48] developed a graded abradable top layer composed of Sc2O3-Y2O3-ZrO2 on the EBC interlayer of a CMC substrate, which effectively relieved the CTE mismatch between the intermediate and surface layers. Compared with the nongraded structure, the graded coating exhibited enhanced interfacial bonding strength and improved thermal shock resistance.
YbMS possesses superior corrosion resistance, while YbDS exhibits a CTE that more closely matches that of CMC substrates. Their combination has been explored as a way to simultaneously achieve corrosion resistance and thermal compatibility in EBC systems [43]. However, in practice, it is difficult to precisely control the phase ratio of the two silicates during deposition. Although YbMS offers low thermal conductivity, excellent high-temperature phase stability, and strong resistance to steam and CMAS attack, its CTE mismatch with the substrate limits its application as a standalone EBC layer.
To address this issue, our team [102] proposed a compositional gradient EBC composed of YbDS-YbMS, with a bottom layer rich in YbDS to match the substrate's CTE, an intermediate layer with a balanced phase composition to transition CTE across the interface, and a top layer rich in YbMS to ensure excellent corrosion resistance. As schematically illustrated in Fig. 12, the water vapor corrosion mechanism of the graded coating is highly dependent on phase composition and distribution. For example, after heat treatment, the 75YbD-S-25YbMS composition primarily contains two phases: YbDS and YbMS, whereas the 25YbDS-75YbMS composition contains a ternary phase mixture of Yb2O3,YbDS, and YbMS.

Fig. 12. Schematic illustration of the single-layer 75YbDS-25YbMS, 25YbDS-75YbMS, and gradient EBC after water vapor corrosion [102]. |
As shown in Fig. 12a, the 75YbDS-25YbMS coating exhibited higher corrosion rates due to the inferior steam resistance of YbDS, leading to the rapid formation of a porous corrosion layer. This layer facilitated the ingress of steam and oxygen, accelerating the growth of the TGO layer at the interface between the bond coat and the top coat. Although a certain thickness of TGO is beneficial for substrate protection, excessive growth and the accompanying phase transformation shrinkage of SiO2 may result in crack formation and eventual coating spallation.
In contrast, as illustrated in Fig. 12b, the single-layer 25YbD-S-75YbMS coating demonstrated excellent corrosion resistance due to its high YbMS content; however, its significant CTE mismatch led to thermal stress accumulation and top coat cracking during service. The graded coating shown in Fig. 12c combined the advantages of both systems. The YbDS-rich bottom layer effectively relieved thermal stress during thermal cycling, while the YbMS-rich top layer enhanced corrosion resistance by suppressing oxygen and steam diffusion into the coating, resulting in a much thinner TGO. After 100 h of exposure, the graded EBC showed no signs of cracking or spallation, indicating excellent structural integrity.
Interestingly, although pores generated by steam corrosion in the top layer may be detrimental to long-term corrosion resistance, they may conversely benefit the abradability of the coating, which is favorable for ASC applications.
3.6. Surface texturing treatment
Due to the functional complexity of multilayer coatings-particularly abradable sealing coatings applied on CMCs-the optimal approach is to deposit an abradable top layer on the EBC. However, such coating systems (EBC + abradable layer) often suffer from excessive thickness and poor stress tolerance, making them prone to delamination under harsh high-temperature service conditions, which poses a significant risk to engine safety [103]. Therefore, one of the greatest challenges in multilayer coating systems is enhancing the interfacial bonding strength. As a critical step in thermal spraying processes, surface pretreatment with optimized topography can significantly increase the contact area between the substrate and coating particles, thereby improving bonding quality. Grit blasting is a common pretreatment method used to roughen the substrate and enhance adhesion. Nevertheless, it may also introduce microcracks and entrapped grit particles, which could weaken the adhesion between the bond coat and the underlying layer [104]. Compared to the uncontrollable nature of grit blasting, laser surface texturing (LST) offers a programmable and precise approach for fabricating defined surface patterns on substrates while avoiding issues such as residual abrasive particles. LST is commonly classified into nanosecond (NS), picosecond (PS), and femtosecond (FS) laser systems, which differ significantly in their pulse durations and energy delivery. Among these, PS and FS lasers allow for highly controllable, accurate, and complex micro-texture fabrication due to their ultrashort pulse durations, and have been extensively applied to enhance tribological properties and coating adhesion in engineering surfaces [105].In contrast, NS lasers, due to their relatively long pulse durations, often lead to uncontrolled melting and re-solidification of the target material, resulting in recast layers that are undesirable for texture definition and may degrade interfacial properties. Therefore, NS lasers are generally not suitable for precise surface micro-structuring. On the other hand, PS and FS lasers can produce well-defined, high-resolution surface textures with minimal thermal damage, making them ideal for micro-texturing and fine surface modification [106]. LST technology enables the generation of periodic surface roughness on the substrate, which significantly enhances the mechanical interlocking and bonding strength between the substrate and thermally sprayed particles [105].
Typical laser-generated textures include dot arrays, grooves, square lattices, and hexagonal patterns [107,108]. Moreover, parameters such as texture size, depth, and spacing also play crucial roles in determining interfacial adhesion. To address coating damage during service, many researchers have conducted extensive studies on surface texturing. Lamraoui et al. [109] investigated the influence of geometric texture features on the adhesion strength of thermal-sprayed coatings on aluminum substrates and found that both the geometry and spatial distribution of textures significantly impact adhesion. Zheng et al. [110] used laser to etch micro-pits on alumina surfaces, resulting in twice the bond strength compared to chemically roughened samples. Tan et al. [111] studied the influence of pit diameter-to-spacing ratio, which was found to markedly affect adhesion strength. Reza et al. [112] reported that surface microstructures with optimized surface coverage not only enhanced interfacial bonding but also helped release residual stresses within the coating. Jing et al. [113] applied laser etching to create grooves on the substrate surface, followed by multilayer coating deposition. The results showed a 42.2% increase in adhesion strength, with tensile failures occurring primarily within the abradable layer itself. Heyl et al. [114] used nanosecond-pulsed lasers to fabricate square-grid textures on CoNiCrAlY bond coats, significantly improving thermal cycling life by approximately 180%. Matějíček et al.[115] conducted a systematic investigation into the effects of different laser surface textures, as illustrated in Fig. 13a-d, on interfacial and shear bonding strength. Their results demonstrated that LST significantly enhances coating adhesion. However, due to the fact that interfacial bonding strength exceeded the cohesive strength of the substrate, failure predominantly occurred within the substrate itself, thereby obscuring the direct influence of specific texture geometries on bonding performance. Zhan et al. [116] used atmospheric plasma spraying to deposit MoS2 coatings on grit-blasted and biomimetic micro-textured substrates (as shown in Fig. 13f) and evaluated the effect of texture spacing. Compared with grit blasting, regular textures improved coating adhesion by over 21.1%, with optimal performance achieved when the texture occupied 70-80 % of the surface area. Our team [117] employed nanoscale laser engraving to fabricate a square microtexture with a checkerboard pattern (as shown in Fig. 13g) on the substrate. The bond strength between the CMC substrate and the Si- HfO2 bond coat increased by more than 200% compared to conventional gritblasted samples. Cai et al. [118] employed hybrid laser manufacturing to design a multi-layered bioinspired surface structure inspired by monitor lizard skin, as illustrated in Fig. 13e. This architecture integrates sub-millimeter-scale skeletal frames with micron-scale anchoring features. The resulting multiscale hierarchy significantly enhanced the bonding strength at the coating-substrate interface. General guidelines for LST suggest that the texture volume should approximately match the average volume of spray particles, with texture angles exceeding 70∘ and aperture sizes larger than the particle diameter. To further elucidate the bonding enhancement mechanism of LST, Qu et al. [119] conducted fracture surface analyses and attributed the improved adhesion to a combination of mechanical interlocking and metallurgical bonding induced by thermal spraying. Additionally, Kromer et al. [120] investigated the influence of laser texturing on the thermo-mechanical fatigue behavior of bondcoat-less TBCs. Their findings demonstrated that laser-induced textures can deflect crack propagation above the interface, thereby improving the long-term durability of the coating system.
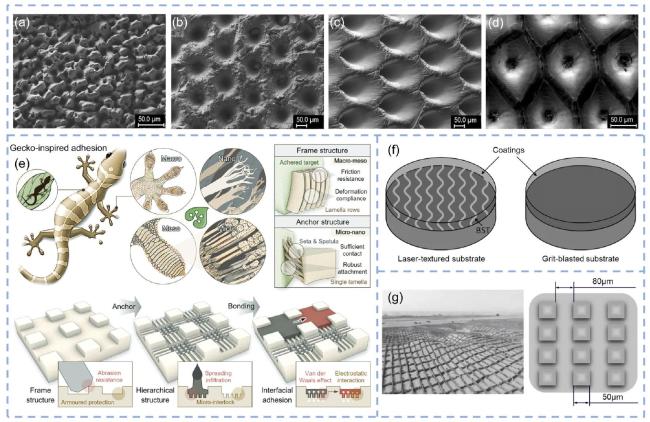
Fig. 13. Surface micro-textures for enhanced coating adhesion: SEM and schematic representations. (a) Random micro-texture pattern;(b) Regular circular pore array;(c) Inclined hole texture;(d) Hexagonal texture array;(e) Schematic of multi-scale hierarchical bioinspired structure;(f) Comparative schematic of bioinspired micro-texture versus grit-blasted substrate with top coating;(g) Square-grid micro-texture schematic. [116,115,118]. |
Currently, research on the influence of surface texture geometry on coating adhesion has made significant progress, particularly in optimizing laser processing parameters, material compatibility, and establishing correlations between texture dimensions and adhesion strength. However, studies on surface texturing for geometrically complex components, as well as the long-term stability of textured interfaces under thermal fatigue and oxidative environments, remain limited. Future work should integrate bioinspired structural design, finite element simulation, and high-precision fabrication methods to explore the mechanisms of multi-physics coupling at the textured interface, which will advance the engineering application of surface texturing in abradable sealing coatings.
4. Evaluation Methods
To reduce clearance and enhance sealing performance, thereby improving engine efficiency, ASCs must achieve a delicate balance between abradability and wear resistance. During operation, the coatings must be capable of being worn away without causing damage to themselves or the rotating components due to high-speed gas flow or rubbing. At the same time, ASCs must possess sufficient stability to remain intact under harsh high-temperature conditions, enduring prolonged exposure without cracking, delamination, or failure due to physical or chemical degradation. However, such general performance requirements are vague and lack specificity. Before developing and testing coatings, it is essential to define these requirements through several quantifiable performance metrics. These measurable indicators form the basis for evaluating and optimizing the actual performance of ASCs under simulated service conditions in the laboratory.
4.1. Tribological performance
4.1.1. Fundamentals of tribology
In the operating environment of aero-engines, the wear behavior between blade tips and abradable sealing layers is highly complex, involving mechanisms such as cutting, smearing, adhesive transfer, fracture, melting, corrosion, and oxidation [121]. Historically, due to limited material data and inadequate research tools, ASC design has been largely empirical, lacking scientific theoretical guidance [16]. Recent advances in testing technologies, however, have made it possible to investigate wear mechanisms in detail. Bounazef et al. [122] simulated high-speed friction between alu-minum-based sealing coatings and titanium alloy blades using a highspeed tribometer. They found that high linear speeds and high incursion rates typically resulted in minor material transfer and smooth cutting paths, while lower speeds and incursion rates led to severe material transfer and rougher wear tracks. These findings were corroborated by Stringer et al. [123], who monitored blade tip length using high-speed cameras. Building upon this, Fois et al. [124] reproduced the wear mechanisms occurring between blade tips and abradable materials in compressors and confirmed that adhesive wear was negatively correlated with linear speed and incursion rate.
Taylor et al. [125] studied the wear mechanisms between Ni-based superalloy blades and Ni-based ASCs, revealing that the wear process is dynamic and complex. When the incursion depth is either very small or very large, blade wear tends to be minimal, while intermediate values result in more severe wear. Under high shear stress, the abradable coating surface exhibits compaction and an increase in residual surface metal. Gao et al. [126] investigated the high-speed friction and wear behaviors of Ni- and Al-based seal coatings, identifying heating rate and peak surface temperature as key factors affecting both blade and coating wear resistance. When the metal phase of the coating has a low melting point and high thermal diffusivity, it softens before the blade, thereby reducing blade wear. Conversely, premature blade softening leads to severe blade damage. Yan et al. [127] used finite element simulations to examine the frictional wear behavior of metal-based honeycomb ASCs, concluding that linear speed and incursion rate are the two dominant factors influencing wear behavior. Overall, adhesive wear is the primary mechanism for metal-based ASCs, and selecting compatible tribo-pairs with appropriate thermal properties can significantly improve abradability.
Sporer et al. [10] briefly described the wear severity of metal blades against YSZ-based ASCs and the coatings' macroscopic wear patterns but did not analyze the mechanisms in detail. As shown in Fig. 14, Yang et al. [128] studied the tribological behavior and wear mechanisms of Ni-based superalloy blades rubbing against YSZ ASCs and discovered that ceramic ASCs exhibit entirely different wear mechanisms compared to metal ones. In ceramics, linear speed plays a dominant role, while incursion rate has minimal impact. Furthermore, wear occurs predominantly through subsurface fracture, likely due to the inherently low fracture toughness of ceramic materials [129]. Qin et al. [38] used a tribometer to analyze the wear behavior of ytterbium disilicate-based ASCs using bearing steel pins as counter-bodies. They found that fatigue and abrasive wear were the primary mechanisms, with mild adhesive wear under specific conditions. Huang et al. [101] tested the tribological performance of YSZ-based ASCs using GCr15 steel and Si3 N4 ceramic balls as counter-bodies. Their findings showed that the dominant mechanisms were adhesive and fatigue wear, which depended on the properties of the counter-body. For the soft, high-thermal-conductivity GCr15, a smear layer formed under low loads, reducing the friction coefficient. Under higher loads, adhesive wear occurred, resulting in coating detachment. When using the hard, low-thermalconductivity Si3 N4 counter-body, scratch marks appeared under low loads, while increasing the load enhanced compaction and polishing effects.
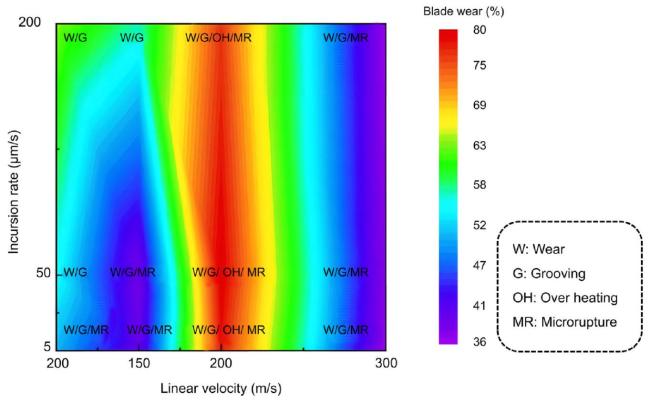
Fig. 14. Typical wear map of ceramic-based ASCs [128]. |
To explain the wear behavior of ceramic coatings, Ghasripoor et al. [130] developed a brittle release model based on experimental results. As illustrated in Fig. 15, during engine operation, the blade tip contacts the ASC surface, and kinetic energy is transferred from the blade to the coating. Part of this energy causes plastic deformation in ceramic particles, while another portion is stored as elastic energy between particles. Due to the presence of uniformly distributed soft phases and porosity, the continuity of the ceramic matrix is disrupted, weakening inter-particle bonding. When the applied force exceeds the bonding strength, the particles detach and form wear debris. Huang et al. [11] proposed that deformation-induced compaction on the coating surface is detrimental, leading to smear layers and reduced abradability. In contrast, particle detachment is beneficial as it dissipates energy and forms micro-scale wear gaps that maintain both blade integrity and sealing performance. The generated wear debris can affect the wear process in two primary ways: (1) Remaining at the friction interface and inducing three-body wear, thereby increasing the coating's wear rate; (2) Becoming compacted and transferred onto the sliding surface, forming a lubricating transfer layer that protects the coating and reduces the friction coefficient, especially in the presence of lubricating phases.
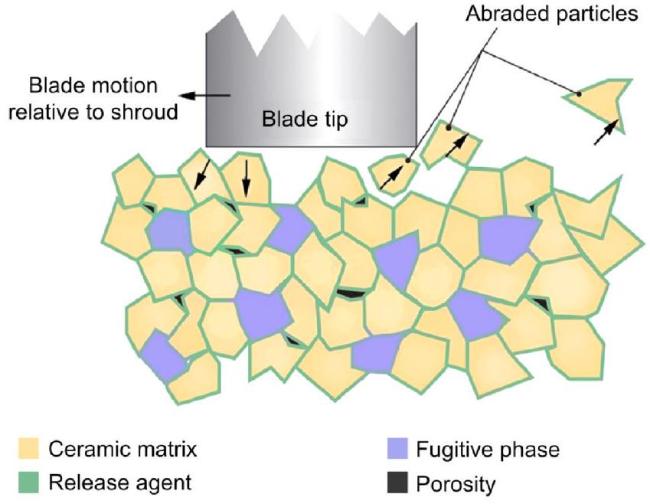
Fig. 15. Wear mechanism model of ceramic-based ASCs [130]. |
4.1.2. Abradability
Abradability is a key performance indicator for ASCs, referring specifically to a coating's ability to be worn away preferentially during contact with a blade. The fundamental requirement is that, when contact occurs between the coating and the blade, the coating should wear away first, while blade wear should be minimal or negligible. Unlike conventional wear resistance, the quantitative assessment of abradability encompasses not only material loss but also considers factors such as rubbing forces, energy dissipation, surface evolution, and wear debris characteristics under high-speed and high-temperature conditions. Abradability reflects the overall performance of the tribological system and is closely related to the physical, chemical, and mechanical properties of both the blade and the coating. It is also affected by factors including applied load, wear rate, environmental conditions, and temperature [131].
Currently, a variety of methods exist for evaluating abradability, as listed in Table 9. In earlier studies, coating adhesion strength and hardness were the primary evaluation metrics-it was generally believed that lower hardness and bonding strength corresponded to better abradability. Over time, more advanced methods have been developed, such as scratch testing, scribing hardness, turning tests, and sliding wear tests [132]. Among them, scratch testing and scratch hardness methods are simple and convenient but fail to replicate real service conditions of ASCs. Turning and disk machining tests lack temperature control and thus cannot be used to assess abradability at elevated temperatures. Impact wear methods remain largely theoretical, and their evaluation criteria are not yet well established. While sliding wear tests offer conditions somewhat closer to real engine operation, they generally involve low linear speeds, which limits their ability to simulate the high-speed interactions between blades and the engine casing.
Table 9 Domestic evaluation methods for the abradability of seal coatings. |
| Method | Principle Description | Advantages | Disadvantages |
|---|---|---|---|
| Scratch Method | Measures mass loss caused by a stylus scratching the coating under a constant load; greater mass loss indicates better abradability. | Simple and easy to implement | Significant deviation from actual service conditions |
| Scratch Hardness Method | Uses an indenter of defined shape to create scratches on the coating surface; abradability is characterized by scratch hardness related to scratch width. | Simple and easy to implement | Significant deviation from actual service conditions |
| Turning Method | A blade is used to machine a rod coated with the sealing layer at a cutting depth of 0.6 mm ; the time required to cut this depth is used to evaluate abradability. | Simple and easy to implement | Lacks heating and temperature control devices |
| Impact Wear Method | Uses an impact wear tester to measure the wear energy of the coating; lower wear energy indicates better abradability. | Introduces a quantitative evaluation standard | Far from actual service conditions; suitable only for theoretical research |
| Sliding Wear Method | Employs a ring-on-block wear tester to measure the wear rate between a metallic block and a coated block under specific conditions. | Closely simulates service conditions | Low linear velocity; still deviates from actual conditions |
| Disc Milling Method | The sealing coating is applied to the end surface of a pin, which is then tested against a rotating disc; abradability is characterized by the measured wear rate. | Higher linear velocity ( | Lacks heating and temperature control; deviates from actual conditions |
| Bench Test Method | Simulates real engine operation; abradability is evaluated based on coating performance and blade condition. | Closely simulates service environment | High cost; lacks standardized evaluation criteria |
In recent years, test rig methods (as shown in Fig. 16) have been increasingly adopted to evaluate ASC abradability. These methods closely simulate actual operating conditions but are expensive and often lack clear criteria for evaluating wear performance. In practical research, hardness measurements are still frequently used due to their convenience and comparability. For instance, Yi et al. [133] found that in medium-temperature ASCs based on Al-Si, abradability improved as hardness decreased, indicating that hardness remains a useful index for comparing abradability.

Fig. 16. Schematic diagram of the abradability test rig[134]. |
However, hardness or bonding strength alone is far from sufficient to comprehensively evaluate abradability. To address this, researchers have introduced other quantitative indicators such as the Intrusion Depth Ratio (IDR), Intrusion Quality Ratio (IQR), Specific Wear Rate (W) and Wear Mechanism Maps [135].
IDR is defined as the ratio between the change in blade height and the change in ASC coating thickness after a period of rubbing:
where ΔDb is the average height change of the counter-body (μm), and ΔDs is the average friction depth of the ASC (μm).
IQR refers to the ratio of mass change in the counter-body to the mass change in the ASC coating before and after rubbing:
where ΔMb is the average mass change of the counter-body (g), and ΔMs is the average mass loss of the ASC (g). IDR and IQR values close to zero indicate excellent wear resistance. A positive value suggests predominant blade wear, whereas a negative value indicates material transfer from the coating to the blade tip, resulting in blade height gain.
Specific wear rate refers to the ratio of the radial wear volume of a sliding bearing to the product of the nominal contact pressure and the sliding distance. It is expressed by the following equation:
where V is the wear volume of the coating (m3),L is the applied load (N), and S is the sliding distance (m).
Wear Mechanism Maps combine information such as dominant wear mechanisms, blade wear amount, rubbing linear velocity, and incursion rate into a visual representation. While they provide rich, intuitive insights and are highly suitable for evaluating ASC abradability, generating them requires extensive experimental data and complex procedures. As a result, their use in practical coating development remains limited.
As shown in Table 10, the comparative characterization of abradability for several ceramic-based ASCs is presented. Through comprehensive assessment of multiple metrics, a straightforward perspective on the coating's abradability performance can be obtained. At present, abradability is most commonly assessed using a combination of hardness testing, sliding wear methods, and high-speed rubbing simulators. Surface hardness provides a straightforward and low-cost way to estimate abradability but offers little insight into the wear process itself. Sliding wear tests yield quantitative data on friction coefficient and wear volume, enabling deeper analysis of wear mechanisms-though they still deviate somewhat from real operating conditions. Each method has its advantages and limitations, and in practice, researchers should select one or more methods based on practical constraints and research goals to comprehensively evaluate ASC performance.
Table 10 The abradability performance of several typical ceramic-based ASCs. |
| Coating system | Coefficient of friction (COF) | Specific wear rate (cm3/(N⋅m)) | Incursion depth ratio (IDR) | Reference |
|---|---|---|---|---|
| Ni-YSZ | 0.22(700∘C) | - | - | [136] |
| YSZ/ BN@ZrO 2 | 0.5 (RT) | 6.58±0.24×10⁻⁴ | 13 % (RT) | [71] |
| 0.3(1000∘C) | 64%(1000∘C) | |||
| YSZ/BN-polyester | 0.42 (RT) | 1.01±0.25×10⁻³ | 8 % (RT) | [84] |
| 0.22(1000∘C) | 66%(1000∘C) | |||
| | 0.65 (RT) | 6.5×10⁻³ | - | [101] |
4.1.3. Erosion resistance
In service environments, ASCs must also possess sufficient strength to withstand erosion caused by high-velocity airflow and entrained particles. This necessitates coatings with high density and hard-ness-properties that often conflict with the requirement for good abradability [137]. Currently, there is no universally accepted standard for evaluating erosion resistance. In general, gas-solid particle erosion test rigs are employed, where alumina or silica sand particles are propelled by compressed air to impact the coating surface at a specified angle and velocity. The coating's erosion resistance is then evaluated by measuring mass loss and analyzing surface erosion morphology. As shown in Fig. 17, test systems are commonly constructed based on either the ASTM G76 standard [138] or the General Electric (GE) company specification E50TF121CL [103,139]. The main difference between these two lies in the angle between the nozzle and the target surface-ASTM G76 uses a perpendicular (90∘) impact, while the GE standard typically uses an oblique angle of less than 30∘. Yi et al. [137] found that the erosion rate peaks at an impact angle of around 60∘, and coatings with lower hardness are more susceptible to erosion under near-vertical (≈90∘) conditions. However, erosion angles below 30∘ better simulate actual operating conditions in aero-engines. Under a 30∘ impact angle, erosion mechanisms include micro-cutting, plowing, and tunnel formation through pores and non-metallic phases.
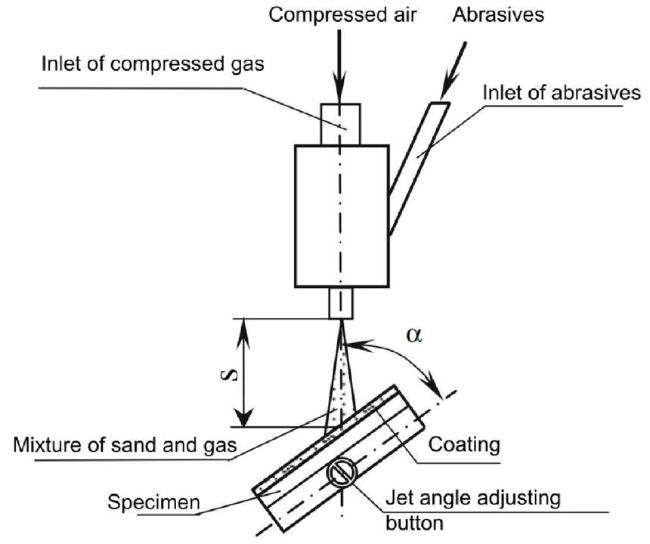
Fig. 17. Schematic diagram of the erosion test apparatus [139]. |
The erosion resistance of ASCs is often assessed using GE-defined "erosivity numbers," including $E\#$ and $Ew$ , which are calculated as follows:
Here, $E\#$ indicates the time required to erode a unit depth of coating, while $Ew$ reflects the mass loss per unit mass of eroding particles. Higher $E\#$ and lower $Ew$ values signify superior erosion resistance.
4.2. Mechanical properties
4.2.1. Surface rockwell hardness
Due to the lack of a simple and unified evaluation metric for both abradability and erosion resistance, it is often challenging to perform straightforward lateral comparisons during practical coating development. Rockwell hardness (HR), which can approximately reflect the overall tribological performance of the coating, is frequently used as a macroscopic index for performance comparison.
According to ASTM E18, the hardness test typically employs the HR15Y scale. A 12.9 mm diameter tungsten carbide ball is used as the indenter. An initial minor load of 3 kgf is applied to measure the preliminary indentation depth h1. The load is then increased to a total major load of 15 kgf and maintained for approximately 10 s. After removing the major load, the final indentation depth h2 is measured. The Rockwell hardness is calculated as follows:
To ensure effective sealing during operation, ASCs must achieve a delicate balance between abradability and erosion resistance. Abradability ensures that the coating can be easily cut without damaging the rotor, while erosion resistance allows the coating to withstand high-speed gas flow and solid particle impingement without structural failure. To achieve this balance, the surface hardness of ASCs is typically maintained within the range of 30-80 HR15Y. Hardness values below this range may result in insufficient erosion resistance, whereas excessively high hardness may lead to excessive wear of the rotor blade tips. For metal-based ASCs, maintaining relatively low hardness is feasible. However, for ceramic-based ASCs intended for high-temperature applications, it is more difficult to reduce surface hardness. For example, porous YSZ coatings prepared via APS with porosities ranging from 15% to 30% may exhibit hardness values exceeding 80 HR15Y, and in some cases, even reaching 95 HR15Y. Furthermore, the inherently low thermal conductivity of ceramic materials leads to rapid surface temperature rise during friction, causing severe overheating that can result in significant damage to the blade tips [9,11,139]. This presents new challenges and requirements for the development of ASCs designed for blade tip applications.
4.2.2. Bond strength
For ASCs, bonding performance is primarily reflected in the adhesion strength between the porous top coating and the underlying metal or ceramic substrate, or in the tensile strength of the porous coating material under tensile loading. Several methods are available to evaluate bond strength, including tensile adhesion testing, scratch testing, and bend testing. However, each method has its own applicable scope and limitations. For ASCs, bond strength is typically assessed according to the internationally recognized ASTM C633 standard [116,117]. In this method, the ASC coating is thermally sprayed onto the flat surface of a cylindrical substrate with a cross-sectional area of A(mm2) and then polished flat. An adhesive is used to bond the coating surface to the mating face of a counter-sample. After curing, the bonded assembly is subjected to a uniaxial tensile load using a universal testing machine until failure occurs. The maximum applied load Lm( N) is recorded, and the bond strength S (MPa) is calculated as:
It is important to note that the coating thickness must exceed 0.38 mm, and the thickness variation should be less than 0.025 mm. Additionally, the tensile strength of the adhesive must be at least equal to that of the coating or its bond strength. For porous ASCs, liquid adhesives may penetrate the coating during bonding, potentially affecting test results. To mitigate this, samples should be inverted during curing so that the coated surface is positioned above the adhesive layer. As a comprehensive mechanical performance index, bond strength reflects the overall performance of ASCs. Excessively low bond strength may result in premature delamination of the coating from the substrate during engine operation. Conversely, if the bond strength is too high, it may indicate excessive cohesion within the coating, making it difficult for individual particles to detach during blade rubbing [117].
4.3. Thermal shock resistance
During aircraft operation-including takeoff, acceleration, deceleration, and landing-the engine experiences rapid and repeated temperature fluctuations. These abrupt thermal changes can lead to coating spallation or failure. As a key indicator for assessing the durability of coatings under complex service conditions, thermal shock resistance is governed by intrinsic thermophysical properties of the material, fabrication process, and microstructural characteristics. To evaluate the thermal shock resistance of coatings, a common experimental method is employed: specimens are first heated to a target high temperature and held for a specified dwell time. Subsequently, rapid cooling is performed using water quenching or forced air cooling to bring the sample down to a designated low temperature. The coating is subjected to multiple heating-cooling cycles, and the number of cycles required for visible delamination is recorded as a quantitative measure of thermal shock resistance.
In recent years, numerical simulation techniques have also been applied to evaluate the thermal shock performance of coatings. For example, Svenia [27] conducted a detailed numerical analysis of the failure modes of YSZ ASCs under thermal loading, examining the stress distribution during thermal shocks. Tsui [140] established a three-dimensional model of the abradable coating and simulated the residual stress evolution under thermal gradients. Building on this, Johnston [141] explored the influence of coating material parameters on residual stress distribution during thermal shock, providing theoretical support for performance evaluation and optimization of coating systems.
Thermal gradients between the coating and the substrate induce thermal stresses within the material. When subjected to cyclic thermal loading, accumulated thermal stress may lead to crack initiation and propagation, thereby shortening the service life of the high-temperature coating. At present, two dominant theories explain thermal shock-induced damage mechanisms: thermoelastic theory and energy-based theory.
The thermoelastic theory suggests that during heating and cooling, constrained thermal expansion and contraction generate internal stress. When this thermal stress exceeds the inherent strength of the coating, cracks initiate and propagate [142]. However, this theory assumes a flawless, pore-free coating and does not consider the influence of preexisting microcracks, making it less applicable to ASCs, which inherently contain numerous pores and micro-defects. In contrast, the energy-based theory assumes the presence of intrinsic microcracks or pores in the material. During thermal cycling, differences in thermal expansion coefficients between the coating and substrate induce both axial and radial stresses at the interface. Axial stress cyclically opens and compresses existing microcracks and pores, while radial stresses cause localized stress concentrations at pore edges, promoting crack initiation and propagation [143]. This often results in the formation of horizontal cracks. As the number of thermal cycles increases, these horizontal cracks coalesce, ultimately leading to partial spallation of the coating.
For thermally sprayed porous ASCs, the presence of numerous horizontally oriented pores and cracks presents a significant challenge to thermal shock resistance and must be carefully considered during design and material selection.
4.4. Corrosion resistance
4.4.1. CMAS corrosion
During service, aero-engines inevitably ingest silicate particles such as volcanic ash, dust, and sand. These particles melt in the combustion chamber and are carried by high-temperature, high-velocity, and high-pressure gases, subsequently impacting and depositing onto the surface of TBCs. Due to their relatively low melting point (∼1200∘C), molten CMAS readily wet the coating surface and penetrate into the TBCs through cracks or pores via capillary action. This leads to a reduction in strain tolerance and mismatch in the CTE, thus promoting delamination of the coating [144]. For TBCs and EBCs, improved coating density is often employed to resist CMAS attack, and research typically focuses on the chemical interaction between CMAS and the coating phases [145]. However, ASCs, which generally possess higher porosity and more structural defects, offer faster pathways for CMAS infiltration. As such, the microstructural morphology of ASCs plays a critical role in CMAS resistance [39].
To evaluate the CMAS corrosion resistance of coatings, CMAS powders are mixed with ethanol to prepare a slurry of a specific concentration and uniformly applied to the polished surface of the test specimen at a loading of approximately 20mg⋅cm-2. After drying, the specimens are subjected to heat treatment at elevated temperatures for a designated period. The changes in phase composition, microstructure, and mechanical properties before and after heat treatment are analyzed to assess the corrosion resistance [39,88,145].
4.4.2. Water vapor corrosion
The pursuit of higher thrust-to-weight ratios in aero-engines necessitates both higher turbine inlet temperatures and lighter engine components. CMCs are gaining attention as structural materials for hot-section components due to their excellent high-temperature properties. Under dry high-temperature conditions, SiCf/SiC composites form a protective SiO2 layer upon oxidation, effectively shielding the substrate from further degradation. However, in realistic atmospheric conditions, water vapor reacts with the SiO2 layer to form volatile Si(OH)4 species, which accelerates material recession and degradation [33]. To protect the CMC substrate, EBCs must exhibit excellent resistance to water vapor oxidation. For ASCs applied over CMCs, the ability to block oxygen and water vapor ingress is also crucial to prevent corrosion of the underlying structure.
The most effective method to evaluate the water vapor corrosion resistance of ASCs is through full-environment testing. NASA [146] has developed several environmental simulation facilities, such as the gas burner rig, Mach-heated ring, and laser-heated steam ring, which can simulate real service conditions at temperatures up to 1650 ∘C, total pressures of 4-12 atm, and gas velocities of 10-30 m.s-1, while enabling real-time data acquisition. Although these facilities can accurately reproduce service environments, their high cost and complexity limit their widespread application in coating development. To conduct water vapor corrosion studies at lower cost, Ridley et al. [147] used a highvelocity steam jet furnace to study the thermochemical stability and microstructural evolution of YbDS at 1200-1400∘C and gas velocities of 115-125 m⋅ s-1. Bakan et al. [148] conducted similar tests on bulk YbDS and YbDS-based EBCs at 1400∘C under 90 m⋅ s-1 water vapor flow. Additionally, as shown in Fig. 18, researchers have developed modified tube furnace systems for low-cost simulation of water vapor corrosion environments. For example, Wang et al. [43] investigated the hightemperature stability and water vapor resistance of YbMS and YbDSbased EBCs in a tube furnace equipped with a steam generator at 1400∘C and a gas velocity of 2.5×10⁻⁴ m⋅ s-1. Our team [149] employed a high-temperature steam corrosion apparatus to evaluate the water vapor corrosion resistance of (Y1-xYbx)2SiO5 bulk materials under 50%H2O-50%O2( g) conditions at 1300 ∘C,1400 ∘C, and 1500 ∘C. Although such low-cost steam testing platforms are suitable for preliminary corrosion studies, their gas velocities differ significantly from those in actual combustion chambers. Moreover, there is still a lack of well-established evaluation standards for assessing the water vapor corrosion resistance of ASCs.
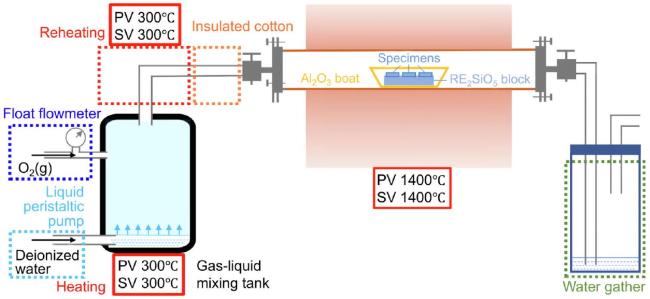
Fig. 18. Schematic diagram of the water vapor corrosion testing apparatus [149]. |
5. Conclusion and outlook
In recent years, as the performance of aero-engines continues to improve, traditional metal-based ASCs have increasingly approached their limits under high-temperature conditions. Owing to their excellent thermal stability and structural tunability, ceramic-based high-temperature ASCs have become a focal point of current research. This review provides a comprehensive overview of ceramic-based ASCs in terms of material systems, design strategies, and performance evaluation methods. Special attention is given to key structural design strategies, including porosity control, nanocomposite architecture, lubricating phase modification, bonding phase enhancement, multilayer coating design, and surface texturing. Furthermore, a clear mapping between performance objectives and structural design strategies is established, offering systematic theoretical guidance for the development of multifunctional ceramic-based ASCs.
5.1. Current challenges
5.1.1. Trade-off between abradability and mechanical strength
To achieve excellent abradability, the coating is typically designed with a high level of porosity to reduce its mechanical strength, thereby allowing it to wear preferentially and protect the blade tips. However, this also significantly weakens the coating's ability to resist high-velocity particle erosion and thermal flow impact. Excessive porosity further provides fast diffusion pathways for oxygen, water vapor, and molten CMAS, which can severely compromise coating durability and lead to premature failure. In addition, the thermal conductivity of the coating is closely related to its pore structure. While high porosity benefits thermal insulation, it also increases the risk of thermal shock-induced cracking. Therefore, how to reconcile abradability with erosion resistance, corrosion resistance, and thermal stability-while maintaining high-temperature structural integrity and thermomechanical compatibility-remains one of the core challenges in the design of ceramic-based ASCs.
5.1.2. Thermophysical compatibility between coating, substrate, and interlayers
In high-temperature service environments, ceramic-based ASCs are often designed with multilayer architectures to achieve synergistic integration of multiple functionalities. However, this multilayer structure causes severe thermal stress mismatch, leading to premature cracking of the coating. In particular, while the formation of a relatively dense TGO layer can effectively protect the substrate from oxidation and corrosion, an excessively thick or dense TGO layer may induce pronounced thermal gradients. This, in turn, leads to stress concentration at the interface and promotes microcrack propagation, ultimately causing coating delamination or failure. Therefore, constructing ASC systems with good thermophysical compatibility requires comprehensive consideration of thermal expansion behavior, interfacial bonding strength, chemical compatibility, and stress mitigation mechanisms. These factors collectively play a decisive role in determining the service life and reliability of the coating.
5.1.3. Corrosion failure mechanisms in porous coatings
The operating conditions of aeroengines subject ASCs to extremely corrosive environments, where they simultaneously face high-temperature oxidation, CMAS corrosion, and water vapor corrosion. Unlike TBCs and EBCs, which typically have relatively dense microstructures, ASCs are characterized by their porous architecture-a feature that greatly increases their environmental sensitivity. The presence of pores provides preferential pathways for corrosive substances to penetrate rapidly, significantly accelerating the corrosion of porous coatings and resulting in corrosion mechanisms that differ markedly from those of dense coatings. In ceramic-based ASCs, corrosion evolves through a complex interplay of chemical reactions, physical infiltration, and structural degradation. These coupled processes lead to gradual deterioration of the coating's integrity and performance. However, comprehensive studies integrating these mechanisms remain scarce, and a deeper understanding of the corrosion behavior in porous ASC systems is still lacking.
5.1.4. Incomplete performance evaluation system
Current evaluation methods for coating abradability are able to simulate certain service conditions, but they fall short of accurately representing the complex and variable environments encountered in actual operation. This limitation hinders reliable prediction of coating lifespan and performance under realistic engine conditions. Moreover, the test equipment designed to replicate service environments often suffers from high cost, inconsistent specifications, and lack of standardization, making it difficult to perform direct comparisons across different research approaches. Therefore, the establishment of a unified and standardized evaluation framework for ASC performance-capable of supporting low-cost, reproducible, and broadly applicable testing-is an urgent challenge that must be addressed to advance both fundamental research and practical implementation.
5.2. Potential solutions and technological prospects
5.2.1. Compositional optimization and multiscale synergistic structural design
Future ASC composition design should focus on overcoming the current limitations in high-temperature stability and lubrication functionality by innovating and modifying the ceramic matrix phase, pore-forming agents, and lubricating phases to achieve controllable improvements in coating performance. Emphasis should be placed on the role of self-healing phases during service to suppress crack propagation and enable autonomous repair. From both macroscopic coating architecture and microscopic pore structure perspectives, synergistic optimization of coating properties can be realized through approaches such as gradient layering, nanocomposites, and controlled pore structure and distribution.
5.2.2. Simulation-guided design
Simulation-assisted materials design has transformed the development process of advanced materials. At the microscale, molecular dynamics simulations can support corrosion lifetime prediction, while at the macroscale, finite element analysis and COMSOL-based multi-physics coupling enable evaluation of thermo-mechanical-corrosive interactions and prediction of interfacial stress evolution. For the development of ASCs, it is essential to establish a multiscale modeling framework that bridges atomic-scale mechanisms with macroscopic behavior, providing effective guidance for coating structure design and performance optimization.
5.2.3. Improvement of coating performance evaluation system
From the perspectives of tribology, corrosion, and high-temperature performance, a comprehensive simulation platform for ASCs should be developed to predict the performance and lifespan of multilayer coatings under complex service conditions. Corresponding testing standards should be established to facilitate effective communication among researchers and between researchers and engineering practitioners. By integrating experimental validation with multi-property simulation, reliable predictive relationships among wear resistance, hardness, and wear volume can be constructed, thereby providing a theoretical foundation for coating design and optimization.
5.3. Summary and outlook
Ceramic-based ASCs are currently undergoing rapid development but are also facing numerous challenges. Future development requires a synergistic approach integrating materials design, structural engineering, and simulation-assisted optimization to address emerging challenges under extreme service conditions. By selecting high-temperature-resistant materials and employing multiscale structural design strategies, the comprehensive performance of coatings can be significantly enhanced. Coupled with advanced computational simulations, in-depth investigations into the multi-physics failure mechanisms of coatings will pave the way for the successful implementation of ceramic-based ASCs in next-generation propulsion systems for aerospace applications.
CRediT authorship contribution statement
Dechang Jia: Resources. Yu Zhou: Supervision. Leyao Wang: Writing - original draft, Formal analysis, Data curation. Shuqi Wang: Writing - review & editing, Project administration, Conceptualization. Guoliang Chen: Writing - review & editing, Conceptualization. Yongchun Zou: Project administration. Shuang Yu: Resources, Conceptualization. Enyu Xie: Data curation. Qingyuan Zhao: Formal analysis. Ye Zhiyun: Visualization. Jiahu Ouyang: Conceptualization. Yaming Wang: Writing - review & editing, Supervision, Resources, Project administration, Funding acquisition.
Declaration of Competing Interest
The authors declare that they have no known competing financial interests or personal relationships that could have appeared to influence the work reported in this paper.