

1. Introduction
Gas turbine engines are considered the “heart” of aircraft, continuously evolving toward higher thrust-to-weight ratios and greater efficiency to enhance maneuverability and economic performance [1,2]. Increasing the turbine inlet temperature is a key strategy for achieving these objectives [3,4]. The turbine inlet temperature of the aircraft engine, as shown in Fig. 1, has evolved over several decades from 1600~1700K in F100 to 2400K in AVENT, posing significant challenges for the longevity of hot-section components [5]. Fig. 2 illustrates the evolution of superalloy, thermal barrier coating, environmental barrier coating and ceramic matrix composite used in critical hot-section components of gas turbine engines [6]. Superalloys used as turbine blades have evolved from polycrystalline to single crystal to progressively improve the resistance to creep and high-temperature strength [7]. However, even high-performance nickel-based single-crystal superalloys are limited to a maximum temperature of approximately 1100 ℃, which remains insufficient to meet the temperature requirement of high-performance gas turbine engines [8,9]. To address this limitation, thermal barrier coatings (TBCs) have been developed to protect superalloys, which own low thermal conductivity and high melting points. TBCs help reduce the surface temperature of superalloys, thereby extending the service life of turbine blades [10]. With the advancement of TBC systems, the gas turbine engine of aircraft is continuously aiming for higher efficiency by pushing the turbine inlet temperature above 1400 ℃ [11]. However, as the demand for improved performance grows, the combination of thermal barrier coatings and superalloys struggles to deliver greater thrust.
Fig. 1 Development trend of the engine and its combustor. Reproduced with permission from Ref. [5], © Elsevier 2023. |
Fig. 2 The progression and projection of temperature capabilities of Ni-based superalloy, TBC, EBC and CMC gas-turbine engine materials, and maximum allowable gas temperatures with cooling [6]. |
Ceramic matrix composites (CMCs), which demonstrate exceptional high-temperature resistance, are anticipated to replace superalloys as preferred materials for hot-section components [12]. Although CMCs require less thermal insulation, their surfaces still necessitate an environmental barrier coating (EBC) to protect against corrosive water vapor [13]. Consequently, EBCs must possess compatible thermal expansion coefficients and excellent resistance to water vapor corrosion. Rare earth silicate ceramics are emerging as promising candidates due to their excellent resistance to water vapor corrosion and low thermal expansion coefficient [14].
Both superalloy and CMC blades depend on functional thermal or environmental barrier coatings to protect them from external damage [2,15]. In recent years, it has been discovered that foreign contaminants such as sand, dust, and volcanic ash (referred to as CMAS) can be ingested by gas turbine engines [16]. These contaminants originate from sources like deserts, sandstorms, volcanic eruptions, and airport runways [17]. Several notable CMAS corrosion events have occurred in aeroengines, such as engine failure in C17 military aircraft and NAVY V-22 rotorcraft, and volcano ash threats in Iceland as shown in Fig. 3 [18⇓-20]. At high temperatures, these deposits easily melt and react with thermal or environmental barrier coatings, leading to reduced strain tolerance, increased elastic modulus, and coating delamination, as shown in Figs. 4 and 5 [21]. Additionally, highly flowing CMAS molten salts can penetrate along the interface of column grains in the coating, ultimately approaching the substrate. As a result, CMAS corrosion has become a prominent research focus for developing protective coatings in gas turbine engines [22].
Fig. 3 (a) C-17 military aircraft ingesting sand during take-off on unimproved runway Inset: Gas turbine engine vanes with molten CMAS deposits, (b) NAVY V-22 rotorcraft performing landing maneuver under severe ‘brown-out’ heavy dust/sand conditions, (c) Dust storm across the Red Sea May 13, 2005, (d) A plane passing through a cloud of volcanic ash, and (e) Volcanic ash deposited on aircraft. Reproduced with permission from Ref. [18], © Sage 2021. |
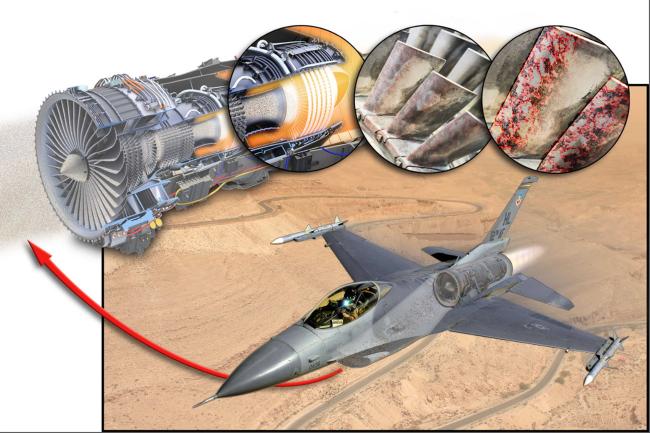
Fig. 4 Military aircraft flying during a sand storm in an arid region. Image insert—mineral dust particles passing through the gas-turbine and corroding the ceramic coatings and metallic surfaces of the hot section components. Reproduced with permission from Ref. [21], © Wiley Online Library 2019. |
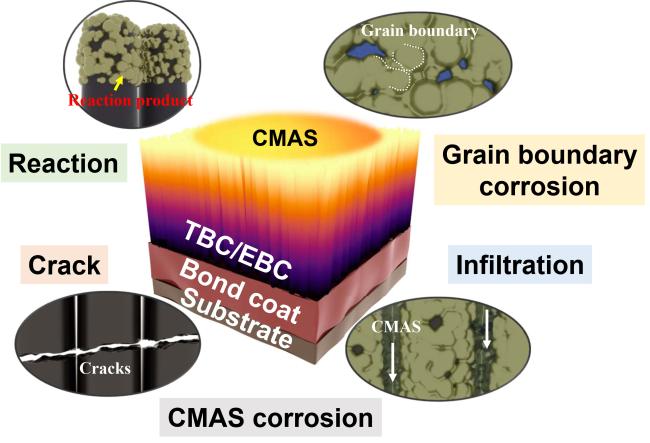
Fig. 5 Schematic diagram of failures caused by CMAS on TBCs and EBCs. |
This article provides a historical overview of CMAS corrosion and summarizes recent research on CMAS corrosion mechanisms of thermal and environmental barrier coating materials. Given the challenges posed by CMAS corrosion, various mitigation strategies are also discussed. Finally, the article provides conclusions and future research perspectives in this evolving field.
2. Historical overview of CMAS corrosion and characteristics of CMAS
2.1. Historical overview of CMAS corrosion
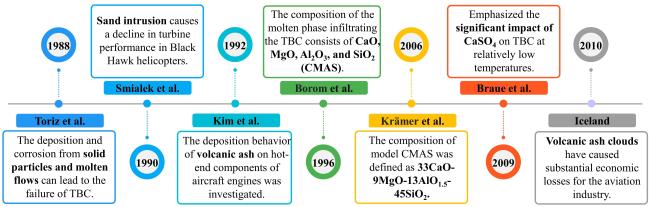
Research into CMAS-induced corrosion has spanned over three decades. Fig. 6 illustrates the historical overview of this issue. Initial insights and research on coating corrosion due to environmental deposits were conducted by Toriz et al. [23], who identified that TBCs on turbine blades are exposed to extreme service conditions. Key failure mechanisms include thermal cycling, bond coat oxidation, and the deposition and corrosion caused by solid particles and molten debris in the gas stream. Subsequently, during the 1990 Gulf War, a decline in turbine performance was observed in Black Hawk helicopters [24]. Engine teardown and rehabilitation tests revealed that sand intrusion was the primary factor behind this performance degradation. In a sandy environment, fine particles (less than 10 μm) can bypass the particle separators and enter the cooling and combustion systems, not only depositing on the turbine blades but also blocking the cooling passages. Smialek et al. [24] found that the composition of sand varies by region but typically consists of calcium aluminum silicate glass, SiO2, (Ca, Mg)CO3, CaCO3, and NaCl. In addition to sand, several commercial aircraft experienced engine failure after encountering volcanic ash clouds, including blockages of turbine blades and cooling passages. In response, Kim et al. [25] employed a Hot-End Test System to study the deposition behavior of volcanic ash on the hot-end components of aircraft engines. At elevated temperatures, volcanic ash can melt and adhere to blades. Thus, turbine inlet and blade surface temperatures are key factors influencing deposition behavior. Borom et al. [26] found that deposits from various environments and regions can melt at high temperatures, infiltrate TBCs, and cause their spallation. Electron probe microanalysis confirmed that the composition of the molten phase infiltrating the TBC included CaO, MgO, Al2O3, and SiO2 (CMAS). The deposition and corrosive effects of CMAS can have potentially catastrophic consequences. For example, the eruption of the Eyjafjallajökull volcano in Iceland in 2010 generated vast ash clouds that caused widespread disruptions to air traffic, leading to significant economic losses for the aviation industry [27]. Over time, the complexity and severity of CMAS-induced corrosion have become increasingly evident. Therefore, comprehensive research into CMAS corrosion remains crucial.
2.2. Characteristics of CMAS
The composition of CMAS is highly complex and varies depending on operating conditions and geographic location. Moreover, the composition of the molten phase that infiltrates into the coating is not entirely consistent with that of the initial deposits, suggesting partial melting of the latter [30]. Smialek et al. [24] analyzed sands from Saudi Arabia and deposits from turbine engines, finding that SiO2 was the dominant component, followed by smaller amounts of Al2O3, CaO, NiO, Fe2O3, MgO, and K2O. Bansal et al. [31] examined dust samples from Middle Eastern countries, identifying the composition as 27.8% CaO, 4% MgO, 5% Al2O3, 61.6% SiO2, 0.6% Fe₂O₃, 1% K2O. Aygun et al. [32], using X-ray fluorescence spectroscopy, confirmed that the composition of sand was 50% SiO2, 38% CaO, 5% MgO, and 4% Al2O3, with trace amounts of Na2O, K2O, and Fe2O3. Fig. 7 presents a summary of the CMAS composition from various sources, as compiled by Ericks et al. [33]. A comparison of these findings reveals that, despite the complexity and variability of these dust and deposit samples, their primary components—CaO, MgO, Al2O3, and SiO2—are consistent, hence the acronym CMAS.
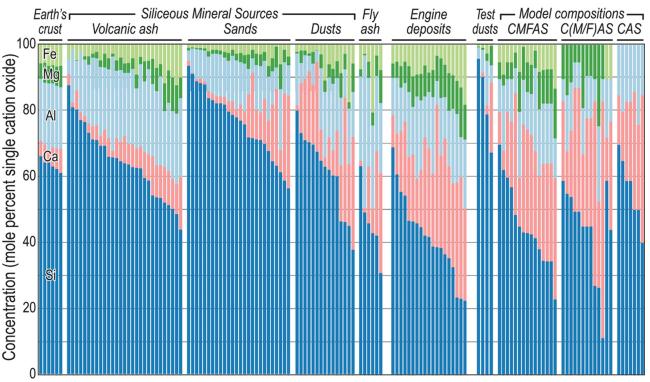
Fig. 7 The composition of CMAS from different sources. Reproduced with permission from Ref. [33], © Wiley Online Library 2022. |
The diversity of CMAS compositions also leads to differences in their physical and chemical properties, particularly the melting point, which is one of the most crucial characteristics. Smialek et al. [24] found that the melting point of the deposits was 1137 ℃. After conducting differential thermal analysis on environmental deposits, Borom et al. [26] determined that the initial melting temperature was 1195 ℃. Naraparaju et al. [34] reported melting points of volcanic ash from Japan and Iceland at 1170 ℃ and 1150 ℃, respectively. Fig. 8 presents the differential scanning calorimetry (DSC) curve of CMAS with a composition of 33CaO-9MgO-13AlO1.5-45SiO2, as reported by Guo et al. [35] The CMAS fully melts at approximately 1230 ℃ and undergoes self-crystallization below its melting point. Poerschke et al. [22] conducted a systematic study on the effects of CMAS composition on its melting temperature and liquid constitution. Calculations and experimental measurements indicate that the melting temperature of CMAS with different compositions falls within the range of 1100~1250 ℃. Based on the ternary phase diagram of CaO-MgO-AlO1.5, the influence of deposit composition on melting behavior and liquid constitution is clearly illustrated (Fig. 9) [36]. At 1300 ℃, some deposits are completely converted into liquid, while others are only partially molten. Variations in the Ca/Si ratio within the liquid phase occur at a relatively constant AlO1.5 concentration, suggesting that, at this temperature, the Ca/Si ratio may be the most relevant parameter in determining the liquid behavior. Additionally, the inclusion of MgO significantly alters the stability range of the liquid composition (Fig. 9 (b) and (c)). Therefore, changes in CMAS composition have a profound impact on its melting behavior, thereby influencing its interaction with the coating.
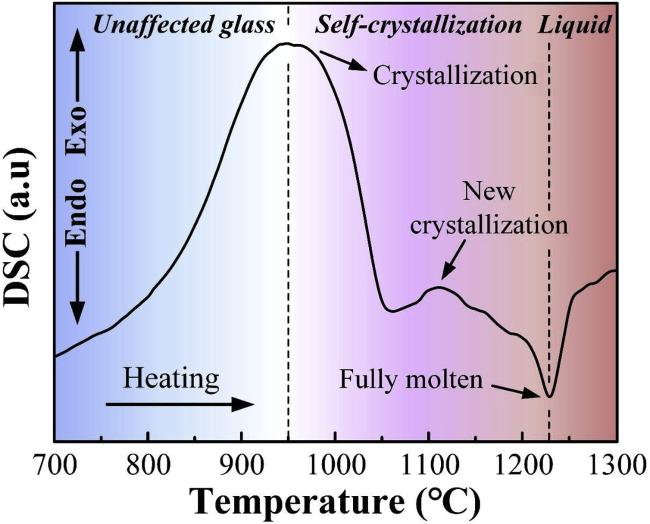
Fig. 8 The DSC curve of CMAS with a composition of 33CaO-9MgO-13AlO1.5-45SiO2 . Reproduced with permission from Ref. [35], © Elsevier 2020. |
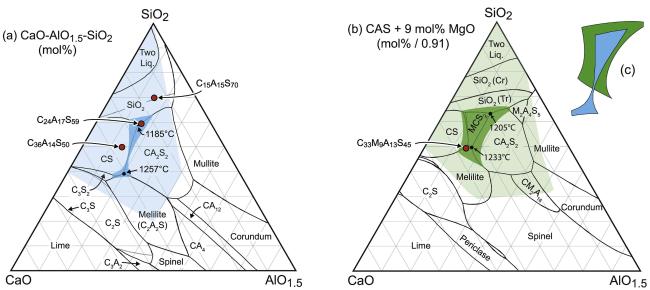
Fig. 9 (a) Phase diagram of the CaO-MgO-AlO1.5 ternary system at 1300 ℃; (b) Phase diagram of the CaO-MgO-AlO1.5 ternary system with the addition of 9 mol% MgO; (c) The effect of MgO addition on the shape and extent of the liquid field. Reproduced with permission from Ref. [36], © Elsevier 2016. |
At high temperatures, once CMAS melts on the surface of coatings, it undergoes a liquid flow stage and spreads out. Song et al. [37] collected volcanic ash from different regions and systematically studied its melting behavior. The melting process of volcanic ash can be divided into four stages based on geometric characteristics: shrinkage, deformation, hemisphere, and flow, as shown in as shown in Fig. 10 (a, c). Initially, the volcanic ash shrinks due to sintering, then adheres to the surface upon melting, followed by spreading and wetting on the surface, and finally, viscous flow. The transition temperature for each stage varies depending on the composition of the volcanic ash (Fig. 10 (b)). In-situ observations of the melting process of a typical model CMAS (33CaO-9MgO-13AlO1.5-45SiO2) were conducted as illustrated in Fig. 11. Similarly, as the temperature increases, CMAS first undergoes deformation (partial melting), then transitions to a molten phase rapidly, and finally completely melts, quickly wetting the substrate. As a result, the interaction between CMAS and the thermal or environmental barrier coating is predominantly influenced by its wettability and flowability on the coating surface.
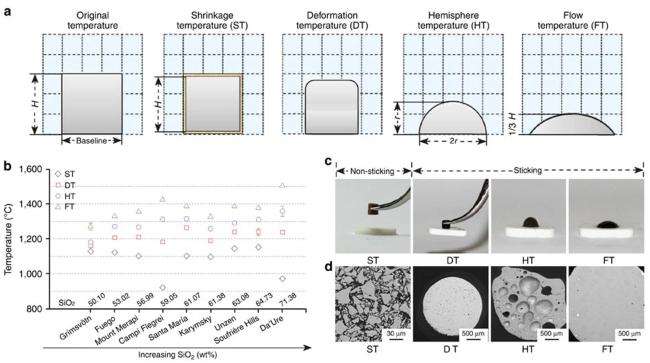
Fig. 10 (a) Schematic diagram of the volcanic ash melting process; (b) Transition temperatures of volcanic ash with different compositions at various stages; (c) Photographs of volcanic ash at different melting stages; (d) Backscattered electron images of volcanic ash at various melting stages. Reproduced with permission from Ref. [37], ©The Author(s) 2016. |
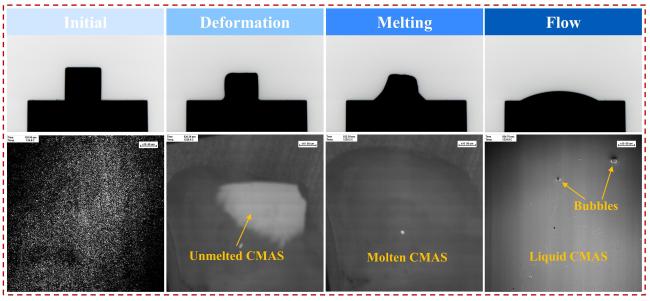
Fig. 11 In-situ observation of the melting process of CMAS. |
The wettability and flowability of CMAS are closely related to its viscosity, making the investigation of its viscosity essential. Bansal et al. [31] calculated the viscosity of CMAS (7.8CaO-4MgO-5Al2O3-61.6SiO2-0.6Fe2O3-1K2O) using the Vogel-Fulcher-Tamman equation and Giordano’s model and found that viscosity decreases with increasing temperature. Webster et al. [38] tested the viscosity of CMAS with different compositions (Fig. 12). They observed that a reduction in the CaO/SiO2 ratio corresponds to a significant increase in viscosity, an effect similarly observed with elevated AlO1.5 levels or diminished MgO content. In contrast, the inclusion of FeO1.5, YbO1.5, and TiO2 caused only minimal changes to the viscosity of CMAS. Meanwhile, the viscosity of CMAS calculated by the FactSage model aligns well with experimental results.
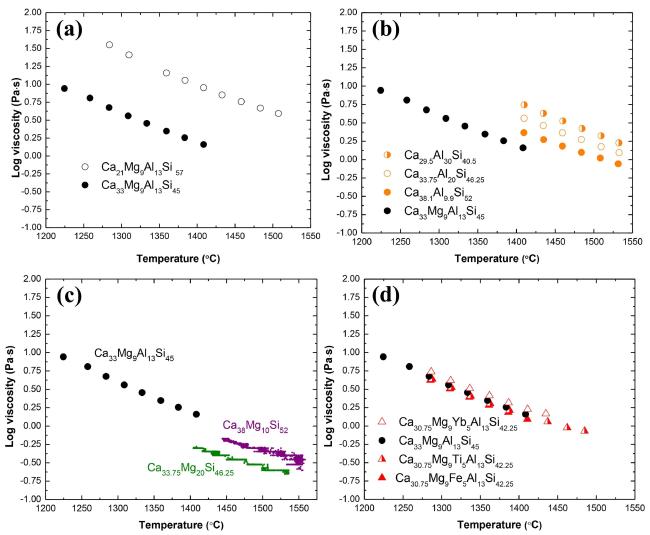
Fig. 12 The relationship between viscosity and temperature for CMAS with different compositions. (a) Different CaO/SiO2 ratios; (b) Different AlO1.5 contents; (c) Different MgO contents; (d) Addition of other oxides. Reproduced with permission from Ref. [38], © Elsevier 2022. |
Additionally, Bansal et al. [31] conducted a systematic study of the thermomechanical properties of CMAS (7.8CaO-4MgO-5Al2O3-61.6SiO2-0.6Fe2O3-1K2O). They found that its density is 2.69 g/cm³, with a Young's modulus of 92 GPa and a shear modulus of 36 GPa. The Vickers hardness was reported as 6.3 ± 0.4 GPa, while the glass transition temperature and softening point were 706 ℃ and 764 ℃, respectively. CMAS remains amorphous even after being held at 850 ℃ for 10 hours; however, crystalline phases of CaSiO3 and Ca2Mg0.5AlSi1.5O7 begin to precipitate at temperatures above 900 ℃. Zhang et al. [39] investigated the microstructural changes of CMAS (33CaO-9MgO-13AlO1.5-45SiO2) below its melting point, discovering that self-crystallization occurs at 1000 ℃. As temperature increases and holding time extends, both the number of crystalline phases and the thickness of crystal layers increase. At 1050 ℃, diopside and anorthite phases precipitate from CMAS, and at 1150 ℃, wollastonite also appears. Prolonged holding times cause diopside to transform into wollastonite and anorthite.
3. Interaction between CMAS and TBCs at high temperatures
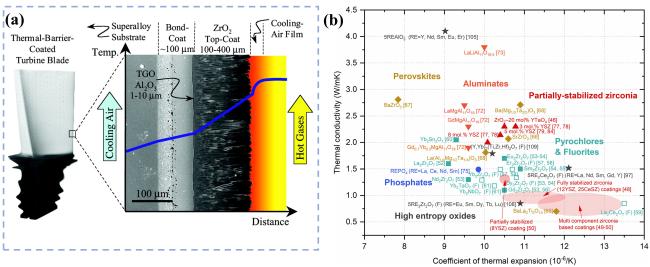
As early as the 1950s, the National Advisory Committee for Aeronautics and the National Bureau of Standards in the US conducted a series of studies on frit enamel ceramic coatings aimed at aerospace applications, identifying alumina and zirconia-calcia as among the most successful [40]. In the 1960s, the National Aeronautics and Space Administration first applied CaO-ZrO₂/NiCr-type TBC to the exhaust nozzle of the X-15 aircraft, marking the debut of TBCs on manned spacecraft [41]. Since the 1970s, yttria-stabilized zirconia (YSZ), containing 7-8 wt.% Y₂O₃, emerged as the most widely used TBC material, owing to its low thermal conductivity and a thermal expansion coefficient compatible with the metallic substrate [42,43]. The TBC system comprises a superalloy substrate, bond coat, and top coat, as illustrated in Fig. 13 (a) [10]. However, ZrO₂ undergoes phase transformation at approximately 1200 ℃, inducing volumetric expansion and limiting its applicability at elevated temperatures. As turbine inlet temperatures continue to rise, the demand for advanced TBC materials to replace YSZ has intensified [44,45]. New TBC candidates, such as RE2Zr2O7, RETaO4, and REPO4, are gaining significant attention [9,42,46]. Their thermal conductivity and thermal expansion coefficient have been thoroughly investigated (Fig. 13 (b)) [47] demonstrating significant potential for practical application. In service, TBCs are highly susceptible to CMAS corrosion, which can lead to cracking and spallation of the coating [48,49]. Currently, CMAS corrosion is a key factor limiting TBC development, and improving CMAS resistance remains a pivotal area of future research.
3.1. CMAS corrosion mechanism of ZrO2-based TBC
Pure ZrO2 undergoes a transformation from a tetragonal to a monoclinic phase at approximately 1200 ℃, accompanied by a volumetric expansion of 3% to 5% [50,51]. This transformation generates thermal stress between the layers, potentially resulting in interlayer failure [52,53]. As a result, ZrO2-based coatings typically require the addition of stabilizing agents, such as CaO, MgO, or Y2O3, to maintain the stability of ZrO2 at low temperatures. Under the influence of CMAS, ZrO2-based coatings often experience damaged caused by both thermomechanical and thermochemical mechanisms [54]. In terms of the thermomechanical mechanism, Tseng et al. [55] found that the expansion strain caused by CMAS infiltration along pores and phase transformation in zirconates are the primary factors contributing to coating damage and spalling. Fang et al. [56] conducted experiments involving the coupling of thermal cycling and CMAS exposure on three types of coatings: YSZ, Yb2O3 and Y2O3 co-stabilized ZrO2, and Gd2Zr2O7. The results indicated that under thermal cycling, CMAS corrosion is mainly driven by channel cracks in the ceramic layer. As illustrated in Fig. 14, molten CMAS gradually infiltrates the pores of the top coat and solidifies upon cooling, leading to thermal mismatch and reducing the TBC’s strain tolerance. The channel cracks continue to expand, ultimately causing the progressive delamination of the TBC. The blockage of cooling holes by CMAS melt represents another thermomechanical damage mechanism, when CMAS melt adheres to the blade surface and blocks the cooling holes, the cooling efficiency of the blades decreases, and the mismatch in the coefficient of thermal expansion in the CMAS and the alloy readily induces cracks [57,58]. Qadeer et al. [59] characterized a nozzle guiding vane after CMAS corrosion. EDS analysis confirmed the coating to be YSZ, which was observed in SEM, along with cracks caused by CMAS infiltration. Notably, SEM also identified CMAS melt blocking the cooling holes and cracks resulting from cooling holes merging caused by the blockage (Fig. 15).
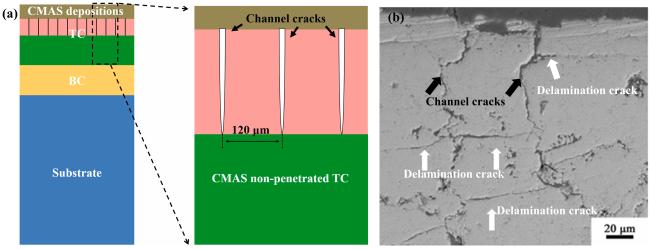
Fig. 14. (a) Schematic diagram of CMAS-penetrated TBC model with channel cracks and (b) channel and delamination cracks of YSZ on cross-section. Reproduced with permission from Ref. [56], © Elsvier 2023. |
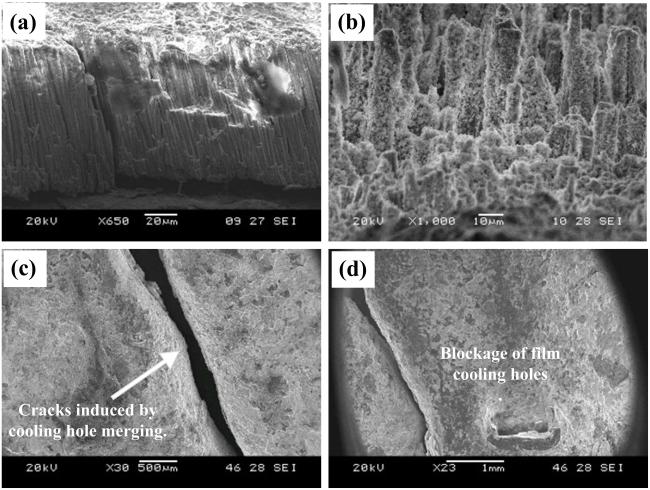
Fig. 15. (a) The columnar morphology and cracks of TBC in the nozzle guiding vane, (b) infiltration of CMAS in TBC, (c) crack formed due to merging of cooling holes and (d) choking of cooling hole. Reproduced with permission from Ref. [59], © Autuor(s) 2018. |
Regarding thermochemical mechanisms, Wu et al. [60] observed preferential grain boundary corrosion at the grain boundary in YSZ. As shown in Fig. 16, the composition within the grains remains close to that of 8YSZ, while EDS analysis at the grain boundaries reveals CMAS infiltration in these regions. This phenomenon is attributed to the tendency of the Y element to segregate at grain boundaries, increasing CMAS reactivity in these areas. Furthermore, the extent of corrosion becomes more severe with increasing Y2O3 content.
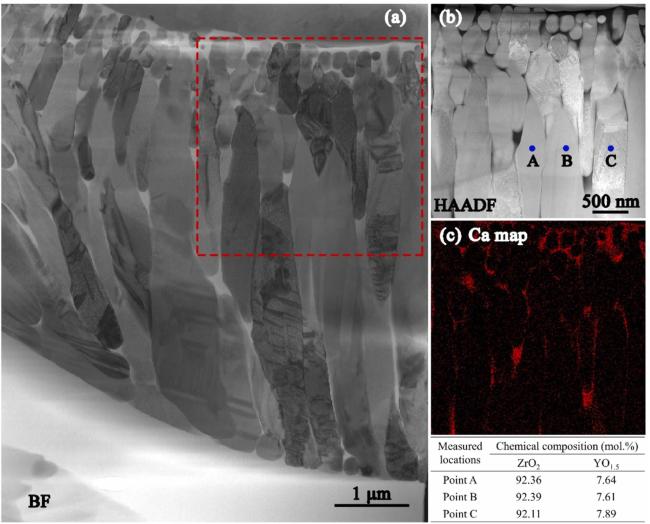
Fig 16. (a) Bright-field TEM image of CMAS infiltration front at 1250 ℃ for 2 h in 8YSZ TBC, (b-c) HAADF image, and the corresponding Ca mapping of the dashed rectangle area in (a). The table at the bottom right lists the chemical compositions of points A, B, and C in (b). Reproduced with permission from Ref. [60], © Elsvier 2022. |
Li et al. [61] discovered the formation of a reaction layer between CMAS and YSZ during CMAS corrosion, as illustrated in Fig. 17 (a). The thickness of this reaction layer gradually increases with prolonged corrosion time (Fig. 17 (b)), and Y3+ ions are gradually depleted within the layer. This depletion weakens the suppression of ZrO₂ phase transformation, ultimately leading to the failure of the TBC [62,63]. Pujol et al. [64] further demonstrated that the dissolution-recrystallization reaction between YSZ and molten CMAS is a significant contributor of failure. Both ZrO2 and Y2O3 dissolve in molten CMAS, and when ZrO2 solubility in CMAS is exceeded, ZrO2 grains re-precipitate through a recrystallization process (as shown in Fig. 17 (d)). In the absence of stabilizing effects from Y2O3 during this process, a transformation from the tetragonal phase to the monoclinic phase occurs, causing volume expansion. The stress generated by this phase expansion induces cracks propagate, ultimately leading to TBC delamination [62].
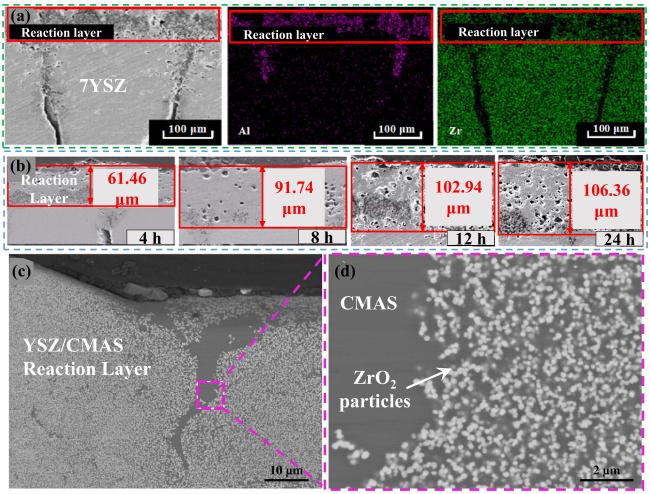
Fig. 17. (a) SEM and EDS images of the interaction layer on cross-section, (b) the thickness of the reaction layer at different holding times, and (c-d) cross-section of the CMAS/YSZ interaction zone in the dissolution/reprecipitation process. Reproduced with permission from Ref. [61] for (a, b), © Author(s) 2021. Ref. [64] for (c, d), © Elsvier 2013. |
TBCs are predominantly fabricated using atmospheric plasma spraying (APS) or electron beam physical vapor deposition (EB-PVD), and the microstructures produced by these two methods are shown in Fig. 18 [65]. TBCs prepared by APS exhibit a distinct layered structure with minimal vertical cracks, which is effectively in mitigating CMAS infiltration. In contrast, TBCs fabricated by the EB-PVD method display a characteristic feather-like columnar crystal structure, though the vertical gaps within this structure facilitate CMAS infiltration. Shan et al. [66] studied the CMAS corrosion behavior of YSZ coatings produced by APS, as illustrated in Fig. 18 (c). Notably, some larger spherical pores in the YSZ remained unfilled by CMAS, suggesting that incorporating larger spherical pores could enhancing CMAS corrosion resistance by consuming CMAS. Wellman et al. [67] investigated the CMAS corrosion mechanisms in TBCs prepared by the EB-PVD method and observed that CMAS preferentially infiltrates the vertical gaps between the columnar grains (Fig. 18 (d)). This infiltration initiates corrosion at the column tips, propagating cracks into adjacent columns and ultimately leading to delamination of the ceramic layer. Although coatings fabricated by the EB-PVD method exhibit higher bond strength and damage tolerance, the vertical gaps between grains facilitate CMAS infiltration, thereby accelerating corrosion.
Overall, under high-temperature and CMAS exposure, YSZ experiences grain boundary corrosion due to the segregation of Y at the grain boundaries. Additionally, the dissolution and recrystallization process of ZrO₂ within the CMAS reaction layer induces phase transformations accompanied by volumetric expansion, compromising coating stability. Furthermore, the inherent vertical gaps between grains in YSZ provide channels for CMAS infiltration, exacerbating CMAS corrosion.
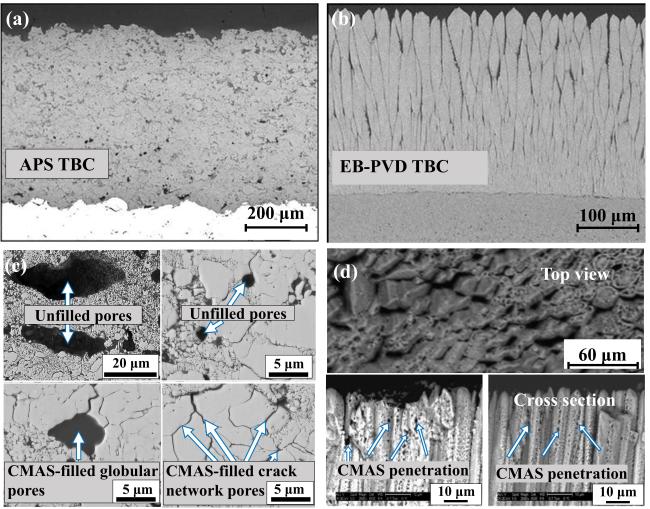
Fig. 18. Typical microstructure and the microstructure after CMAS of TBC prepared by APS and EB-PVD: (a) 7YSZ TBC prepared by APS and (b) EB-PVD, (c) microstructures of 8YSZ APS TBC after CMAS corrosion at 1250 ℃ for 3 h and (d) microstructures of 7YSZ EB-PVD TBC after CMAS corrosion at 1300 ℃ for 4 h. Reproduced with permission from Ref. [65] for (a, b), © Springer Nature 2008. Ref. [66] for (c), © Elsvier 2020. Ref. [67] for (d), © Elsvier 2010. |
3.2. CMAS corrosion mechanism of RE2Zr2O7
Although YSZ has been used for several decades, it undergoes phase transformation at temperatures above 1200 ℃. As turbine inlet temperatures continue to rise, YSZ’s applicability at temperatures above 1200 ℃ is considerably restricted. Rare earth zirconates (RE2Zr2O7) exhibit lower thermal conductivity and similar thermal expansion coefficients compared to YSZ (as shown in Table 1 [68]) and lack phase transformations below their melting point, offering high phase stability, making them promising TBC candidates [69]. RE2Zr2O7 can be categorized into two structural types: defective fluorite and pyrochlore, depending on the ionic radius ratio of RE3+ to Zr4+. Pyrochlore-structured RE2Zr2O7 ceramics possess compatible thermal expansion coefficients with the superalloy, which making them extensively studied as promising TBC materials.
Stephan et al. [70] investigated the CMAS corrosion behavior of Gd2Zr2O7 at 1300 ℃. Their results revealed that Gd2Zr2O7 dissolved in the CMAS melt and formed an apatite phase predominantly composed of Gd8Ca2(SiO4)6O2 and a fluorite phase rich in ZrO2. This process involved substantial consumption of calcium and silicon from the melt, while magnesium and aluminum oxides precipitated as spinel within the melt (Fig 19 (a) and (b)). The combination of these three crystalline phases filled the crystal gaps, hindering further penetration of the remaining CMAS. The type of RE element significantly influences the CMAS corrosion behavior of RE2Zr2O7. In Schulz et al.’s study [71], La2Zr2O7 (which has a larger ionic radius of RE3+) exhibited superior resistance to CMAS corrosion compared to Gd2Zr2O7, suggesting a correlation between the ionic radius of the RE element and CMAS corrosion resistance. Wu et al. [72] examined the CMAS corrosion resistance of Sm2Zr2O7, Gd2Zr2O7, and Yb2Zr2O7. Their findings revealed that needle-like apatite and spherical cubic ZrO2 were the main crystalline products formed in the CMAS melt. Additionally, the amount of apatite product increased with the cation radius of RE and decreased with a reduction in the CaO: SiO2 ratio in the CMAS, as shown in Fig 19 (c). These observations provide guidelines for designing next-generation RE2Zr2O7 ceramics with enhanced CMAS resistance.
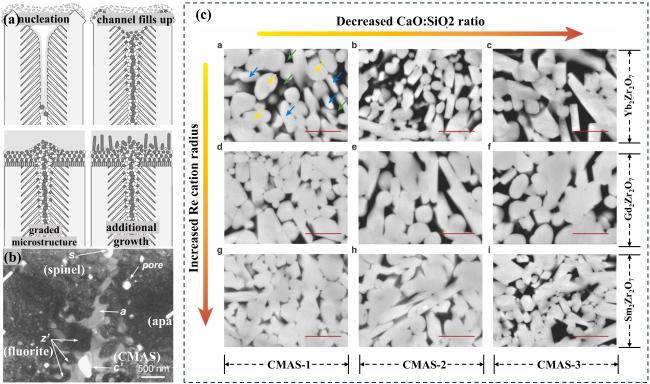
Fig. 19. (a) Schematic representation of the envisaged mechanism leading to the microstructure of the RE2Zr2O7 reaction layer, (b) bright field TEM micrograph of the corrosion reaction zone of the RE2Zr2O7. Phases: z’: fluorite, a: apatite, s: spinel, p: pore, c’: CMAS, (c) Back-scattering SEM images demonstrating the crystallization products in different RE2Zr2O7-CMAS systems from high-temperature reaction experiments conducted at 1300 ℃/30 min. Reproduced with permission from Ref. [70] for (a, b), © John Wiley & Sons - Books 2008. Ref. [72] for (c), © Elsvier 2023. |
Guo et al. [73] further investigated the corrosion resistance of Gd2Zr2O7 under Fe-containing environments (CMAS-Fe) as shown in Fig. 20. The results demonstrated that Gd2Zr2O7 continuously precipitated needle-like Gd-oxygen apatite, while calcspar precipitated in low iron content melts. The precipitation of calcspar reduced the Ca ratio in the melt, increasing the melt viscosity and slowing the penetration rate of CMAS. In the CMAS melt with the highest Fe content, garnet formed, which had a minimal effect on the viscosity on the melt viscosity and was ineffectively in resisting CMAS infiltration, leading to the weakest CMAS corrosion resistance. Moreover, during cyclic CMAS-Fe corrosion, Gd in the reaction layer continuously reacted with CMAS-Fe, and the re-deposition of molten CMAS-Fe altered the chemical composition of the reaction layer. This process converted the residual CMAS-Fe into a low-viscosity melt, which created penetration pathways for the re-deposition of CMAS-Fe, thereby diminishing the corrosion resistance of the ceramic layer. These findings revealed the shortcomings of Gd2Zr2O7 in CMAS-Fe corrosive environments, providing direction for future modification strategies tailored to specific corrosive conditions for Gd2Zr2O7.
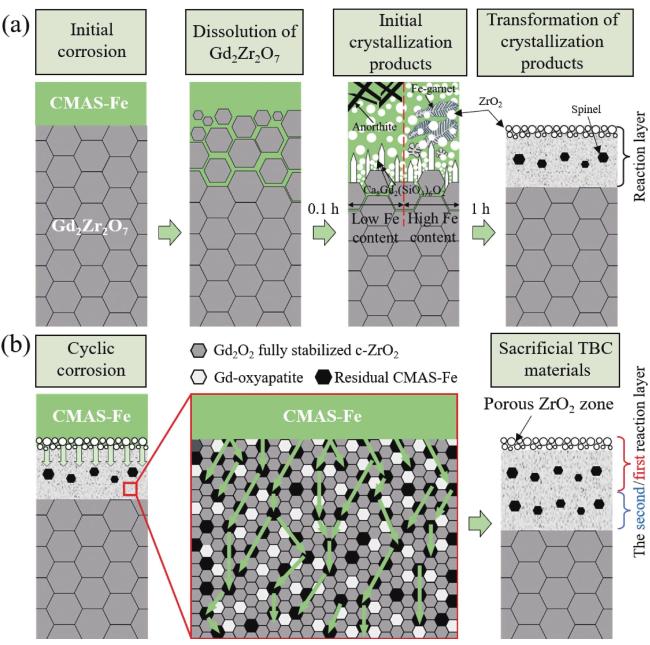
Fig. 20. Schematic diagram of formation and growth of reaction layer of Gd2Zr2O7 coating under CMAS-Fe corrosion. Reproduced with permission from Ref. [73], © Author(s) 2024. |
Table 1 Thermal conductivity and thermal expansion coefficient of RE2Zr2O7 [68] |
| Compound | Thermal conductivity (W·m-1·K-1) | Thermal expansion coefficient (10-6·K-1) |
|---|---|---|
| La2Zr2O7 | 1.60(700 °C) | (8~9)×10-6(RT~1000 °C) |
| Nd2Zr2O7 | 1.60(700 °C) | (9~9.5)×10-6(RT~1200 °C) |
| Sm2Zr2O7 | 1.50(700 °C) | 10.9×10⁻⁶(RT~1000 °C) |
| Gd2Zr2O7 | 1.40(800 °C) | 11.5×10⁻⁶(1000 °C) |
| Dy2Zr2O7 | 1.34(800 °C) | (8~11)×10-6(RT~1000 °C) |
| Er2Zr2O7 | 1.50(800 °C) | (7.7~11)×10-6(RT~1200 °C) |
| Yb2Zr2O7 | 1.40(800 °C) | (7.6~10.7)×10-6(RT~1200 °C) |
| 8YSZ | 2.30(800 °C) | (10~11)×10-6(RT~1000 °C) |
Overall, rare earth zirconates dissolved in CMAS melts primarily form an apatite phase composed of RE8Ca2(SiO4)6O2 and a ZrO2-enriched fluorite phase. The apatite phase fills crystal gaps, thereby hindering further infiltration of residual CMAS. The formation of the apatite phase is influenced by both the type of RE element and the composition of CMAS. Specifically, the amount of apatite increases with the growing ionic radius of the RE element, thereby improving the CMAS corrosion resistance of RE2Zr2O7. Conversely, a decrease in the CaO: SiO2 ratio in CMAS reduces apatite formation, which in turn diminishes the CMAS corrosion resistance. Moreover, in iron-containing CMAS melts, RE2Zr2O7 form a garnet phase, which does not effectively resist CMAS attack.
3.3. CMAS corrosion mechanism of RETaO4
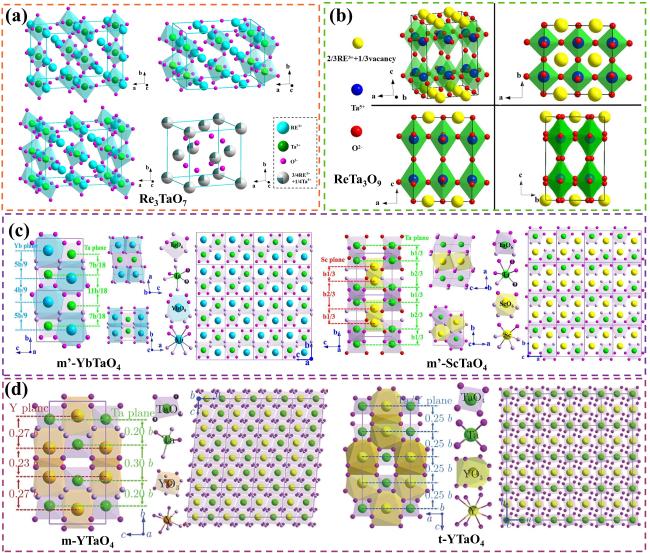
Rare earth tantalates are considered promising candidates for next-generation high-temperature TBC due to their low thermal conductivity (1.4~2.1 W·m⁻¹K⁻¹ at 900 ℃), high melting points, and good phase stability [74,75]. Depending on the stoichiometric ratio between RE2O3 and Ta2O5, rare earth tantalates can be classified into three types of ceramic materials: RETaO4, RE3TaO7, and RETa3O9, with their crystal structures illustrated in Fig. 21 [76⇓⇓-79]. Among these, RETaO4 is distinguished by its ferroelastic toughening properties, as its grains are composed of layered ferroelastic domains [75,78]. These domains reduce the energy required for phase transformation and efficiently absorb fracture energy during crack propagation, thereby enhancing the material’s fracture toughness.
Yang et al. [80,81] evaluated the CMAS corrosion resistance of GdTaO4, YbTaO4 and YSZ at 1350 ℃. The interface microstructure of GdTaO4 and CMAS is shown in Fig. 22 (a), with the main reaction product confirmed to be Ca2Ta2O7. The surface state of the samples indicated that CMAS could not infiltrate the GdTaO4 substrate, instead accumulating on the surface to form a CMAS glass. Furthermore, CMAS contact angle tests demonstrated that GdTaO4 has poorer wettability than YSZ (Fig. 21 (b)), which contributes to reduce degradation at high temperatures. As a result, GdTaO4 exhibits superior CMAS corrosion resistance compared to YSZ. Similarly, the main CMAS corrosion product of YbTaO4 is also Ca2Ta2O7. The dense layer formed on the surface of this product effectively hiders CMAS penetration. Under the same exposure duration, YbTaO4 shows a thinner reaction layer thickness compared to GdTaO4, as shown in Fig. 22 (d) which can be attributed to the lower cohesive energy (Fig. 22 (c)).
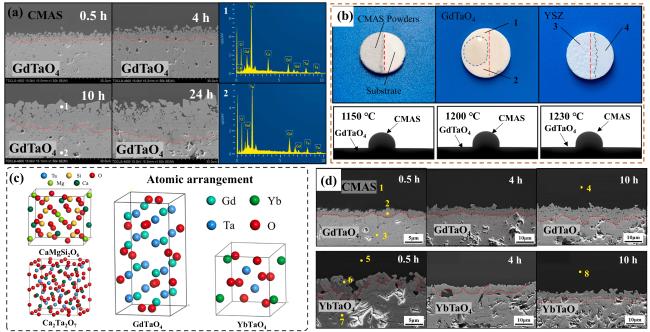
Fig. 22. The interface microstructure, wetting process on-line photographs and atomic arrangement of GdTaO4 and YbTaO4: (a) the interface microstructure of GdTaO4 and CMAS (33Ca-9Mg-13Al-45Si) at 1350 ℃ for different time, (b) the surface state of GdTaO4 and YSZ before and after high-temperature reaction, (c) the atomic arrangement of CaMgSi2O6, Ca2Ta2O7, GdTaO4 and YbTaO4 and (d) images of the reaction interface between residual CMAS and substrate. Reproduced with permission from Ref. [81] for (a, b), © Elsevier 2021. Ref. [82] for (c, d), © Elsevier 2022. |
Tian et al. [82] studied the CMAS corrosion behavior of YTaO4 (Fig. 23), and the primary corrosion product was identified as the solid solution (Ca2-xYx)(Ta2-y-zMgyAlz)O7. In addition, intergranular corrosion was observed in M-YTaO4. This form of corrosion provides a rapid pathway for CMAS infiltration and dominates the entire corrosion process (Fig. 23 (a) and (b)). Typically, the interaction between CMAS and TBC reduces strain tolerance, leading to the formation of cracks. However, even after 80 hours of corrosion at 1300 ℃, no delamination cracks were observed in M-YTaO4 (Fig. 23(a)). To investigate the mechanical properties of the interface, nanoindentation test was performed (Fig. 23 (c)). The modulus decreases smoothly from the reaction layer to M-YTaO4 without significant modulus mismatch across the layers, demonstrating good reliability during CMAS corrosion.
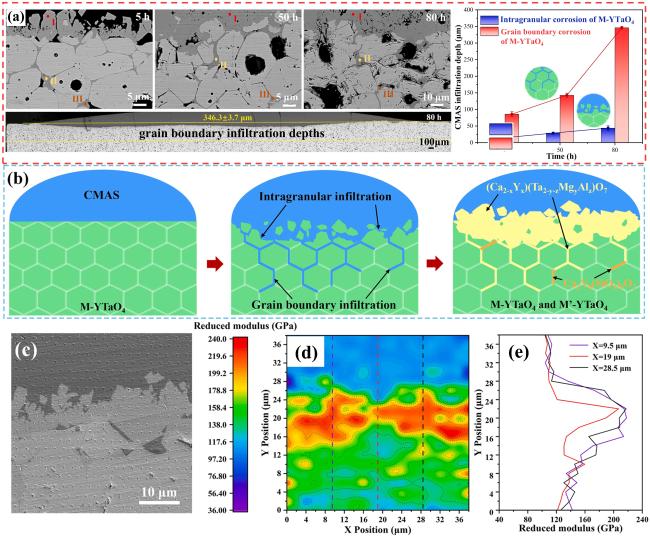
Fig. 23. Corrosion mechanism of M-YTaO4: (a) images of cross-sections and grain boundary infiltration depths of M-YTaO4 after CMAS corrosion, (b) schematic diagram of CMAS corrosion of M-YTaO4, (c) the interface between residual CMAS melt and M-YTaO4 substrate after CMAS corrosion at 1300 ℃ for 5 h, (d) Mapping and (e) section lines of reduced moduli corresponding to (c). Reproduced with permission from Ref. [83], © Elsevier 2024. |
RETaO4 exhibits excellent resistance to CMAS infiltration due to its inert reaction and poor CMAS wettability. Additionally, its intrinsic ferroelastic toughening characteristic makes RETaO4 a promising candidate for next-generation ultra-high-temperature TBCs. However, further research should focus on grain boundary CMAS corrosion to enhance its overall applicability.
3.4 CMAS corrosion mechanism of REPO4
Rare earth phosphates are also promising candidate materials for TBCs due to their unique chemical and thermal stability [83]. Song et al. [84] studied the CMAS corrosion resistance of LaMgAl11O19/GdPO4 (LMA/ GdPO4). CMAS reacted with GdPO4 to form the apatite-phase compound Ca2+xGd8-x(PO4)x(SiO4)6-xO2. Observation of the cross-sectional view of the reaction layer (Fig. 24 (a-c)) revealed that a higher GdPO4 content in the system led to a thinner reaction layer. This findings suggests that increasing the amount of GdPO4 in the LMA/GdPO4 system enhances CMAS corrosion resistance. Meng et al. [85] found that the reaction layer exhibited a dual-layer structure, consisting of a needle-like upper layer and a dense lower layer in the CMAS-attacked GdPO4 sample. The discontinuous needle-like upper layer suppressed CMAS diffusion, while the lower layer effectively inhibited CMAS infiltration (Fig. 24 (d-g)). Surface energy calculation results indicated that GdPO4 has the lowest surface energy, which is favorable for its CMAS wetting resistance.
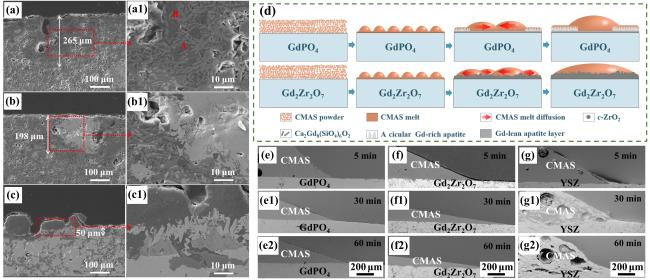
Fig. 24. (a-c) SEM images of the cross-sectional morphologies of LMA/GdPO4 after CMAS corrosion, (d) Schematic diagrams of CMAS wetting behavior of GdPO4 and Gd2Zr2O7, and cross-sectional images of contact angles of CMAS droplets on (e-e2) GdPO4, (f-f2) Gd2Zr2O7, and (g-g2) YSZ. Reproduced with permission from Ref. [85] for (a-c), © Elsevier 2023. Ref. [86] for (d-g), © Author(s) 2024. |
Qin et al. [86] studied the CMAS corrosion resistance of LaPO4 at 1250 ℃ and found that LaPO4 reacted with CMAS early in the process, forming a protective layer of Ca8LaMg(PO4)7 apatite. Additionally, an interlayer was formed between the reaction layer and LaPO4 due to solution substitution and atomic rearrangement at the LaPO4-CMAS interface (Fig. 25 (c)). To explain this reaction layer, which differs from the “dissolution-precipitation process”, a solution/diffusion-recrystallization theory was proposed (Fig. 25 (d)). This dual-layer structure prevents the formation of cracks or pores between LaPO4 and the reaction layer, thereby ensuring the sealing effect of the reaction layer against CMAS. Due to its low surface energy and dual-layer reaction structure formed during CMAS corrosion, LaPO₄ demonstrates high resistance to CMAS wetting and infiltration, making it a promising candidate for next-generation TBCs.
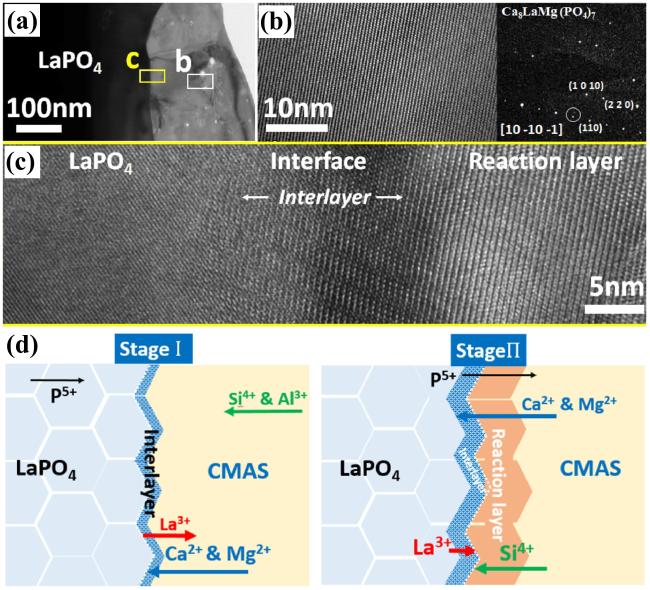
Fig. 25. (a) Bright-field TEM image of LaPO4 and its reaction layer with CMAS after CMAS attack at 1250 ℃ for 5min, (b) HRTEM image of the reaction layer in (a), with an inset image of the diffraction pattern of the reaction layer, (c) HRTEM image of interlayer, and (d) schematic of the transport mechanisms associated with the formation of a transient interlayer and reaction layer across the LaPO4-CMAS interface when exposed to CMAS attack at 1250 ℃. Reproduced with permission from Ref. [87], © Author(s) 2024. |
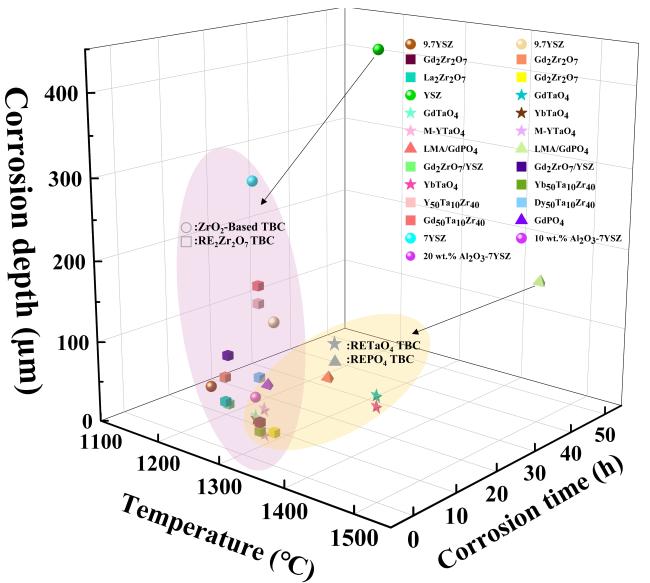
A comparison of the CMAS corrosion resistance among the discussed TBCs is presented in Fig. 26. Under similar corrosion temperatures and exposure times, RETaO4 and REPO4 exhibit lower corrosion depths compared to ZrO₂-based and RE2Zr2O₇ TBCs, demonstrating their superior resistance to CMAS corrosion. However, grain boundary CMAS corrosion was found in RETaO4, indicating the need for further improvement. Therefore, more extensive research is needed to explore the factors influencing CMAS corrosion, understand the underlying corrosion mechanisms, and develop methods for enhancing corrosion resistance, which will aid in the design and optimization of TBCs.
4. Degradation of EBCs caused by CMAS at high temperatures
Despite significant advancements in TBC technologies, nickel-based superalloys remain insufficient for meeting the extreme temperature requirements of next-generation gas turbine engines. SiCf/SiC composites, with their exceptional high-temperature performance, offer a viable alternative for use in hot-section components of gas turbines. EBCs were developed to ensure material longevity and performance integrity [92⇓⇓⇓-96]. Researchers have made substantial progress in the development, fabrication techniques, and performance evaluation of EBC materials, which has led to the evolution of multiple generations of EBC systems [2]. The first- and second-generation EBCs were primarily based on mullite (3Al2O3·2SiO2) and BSAS (1-xBaO-xSrO-Al2O3-2SiO2, 0≤x≤1) as core materials. However, their stability at high-temperature is limited, rendering them prone to destabilization and spalling. As a result, these coatings are restricted to service temperatures below 1300 ℃ [97,98]. Currently, rare earth silicates (RE2SiO5 and RE2Si2O7) are widely recognized as the preferred EBC systems due to their superior high-temperature stability and corrosion resistance [99].
4.1. CMAS corrosion behavior of rare earth monosilicate (RE2SiO5)
RE2SiO5 consists of [SiO4] tetrahedra and [REOx] polyhedral, with its crystal structure illustrated in Fig. 27. It typically forms the X1 phase with larger RE elements (La ~ Gd), while the X2 phase forms with smaller RE cations (Tb ~ Lu) [100,101]. The distinction between X1-RE2SiO5 and X2-RE2SiO5 lies in the coordination numbers of the RE atoms: in X1-RE2SiO5, the RE ions are coordinated in 9- and 7- coordination arrangements, whereas in X2-RE2SiO5, they are coordinated in 7- and 6- coordination arrangements, respectively.
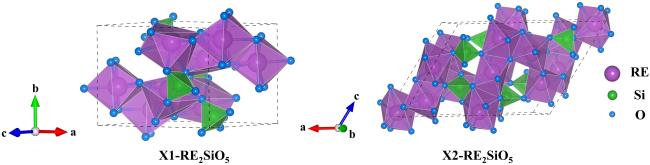
Fig. 27 The crystal structures of RE2SiO5. |
Given the diversity of RE elements and their effects on crystal structure, the specific RE element species play a crucial role in influencing the CMAS corrosion behavior of RE2SiO5. Cao et al. [102] studied the CMAS corrosion behavior of Y2SiO5 and Yb2SiO5 at 1300 ℃. Y2SiO5 exhibited a much more vigorous reaction with CMAS than Yb2SiO5. After 32 hours, the reaction layer thickness of Y2SiO5 was four times that of Yb2SiO5. Additionally, Cao et al. [103] compared the CMAS corrosion resistance of Y2SiO5 and Yb2SiO5 at 1400 ℃, finding that after 12 h, the reaction layer thickness of Yb2SiO5 was less than half that of Y2SiO5. This difference is attributed to the greater optical basicity (OB) difference between Y2SiO5 and CMAS compared to that of Yb2SiO5, leading to a higher reactivity of Y2SiO5 with CMAS. Zhong et al. [104] compared the CMAS corrosion behaviors of X1-Gd2SiO5, X2-Y2SiO5, and X2-Er2SiO5 coatings. The CMAS corrosion resistance of the three was ranked as follows: X2-Er2SiO5 > X2-Y2SiO5 > X1-Gd2SiO5. The primary product of CMAS corrosion was Ca2RE8(SiO4)6O2, and since the ionic radius of Gd is closer to that of Ca, X1-Gd2SiO5 is more prone to reacting with CMAS to form Ca2RE8(SiO4)6O2, resulting in poorer CMAS corrosion resistance. Furthermore, the crystal structure suggests that X1- Gd2SiO5 has a weaker crystal field strength and weaker chemical bonds, making it more susceptible to corrosion. In contrast, X2-Er2SiO5 generates garnet-like substances during corrosion, which help form a dense apatite layer, thereby enhancing its CMAS corrosion resistance.
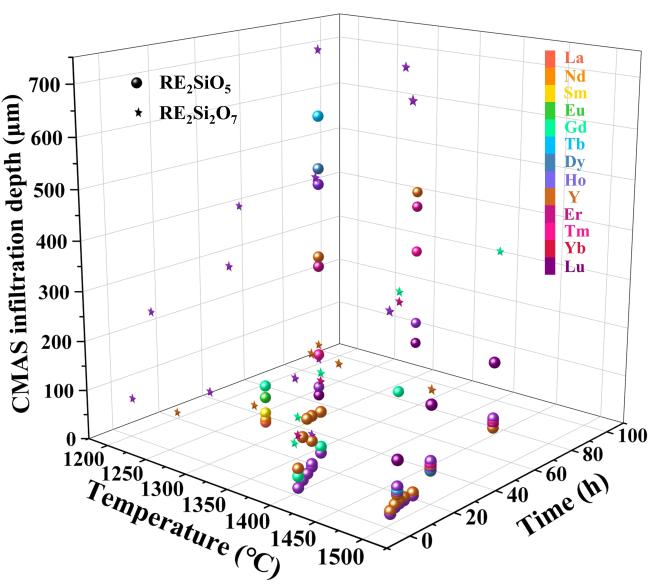
Tian et al. [100,105] systematically studied the CMAS corrosion behavior of X1-RE2SiO5 (RE = La, Nd, Sm, Eu, Gd) and X2-RE2SiO5 (RE = Tb, Dy, Ho, Er, Y, Tm, Yb, and Lu) ceramics at 1300 ℃. After 25 hours of interaction with CMAS, the thickness of the recession layer in X1-RE2SiO5 ceramics increased with decreasing RE ionic radius, as shown in Fig. 28 (a). This indicates that the CMAS corrosion resistance of X1-RE2SiO5 ceramics is related to the RE element species, with larger RE ionic radii correlating to better corrosion resistance [100]. In contrast, for X2-RE2SiO5 ceramics, the recession layer thickness after 50 and 100 hours of corrosion at 1300 ℃ exhibited a linear relationship with the RE ionic radius, as shown in Fig. 28 (b). Based on the CMAS corrosion behavior of X2-RE2SiO5, three distinct groups can be identified (Fig. 28 (c)). For RE elements with relatively larger ionic radii, such as Tb2SiO5, Dy2SiO5, and Ho2SiO5, the CMAS is almost entirely consumed, resulting in the thickest reaction layer. This indicates an intense interaction between the CMAS and RE2SiO5. In contrast, for RE elements with smaller ionic radii, such as Tm2SiO5, Yb2SiO5, and Lu2SiO5, a considerable amount of residual CMAS remains, the reaction zone is comparatively thin, and no cavities are observed, suggesting a mild CMAS corrosion process [105]. During the CMAS corrosion process of X2-RE2SiO5, the main reaction product was Ca2RE8(SiO4)6O2. Research by Costa et al. [106] found that as the RE ionic radius increased, the formation enthalpy of Ca2RE8(SiO4)6O2 became more exothermic, indicating improved stability. Thus, X2-RE2SiO5 with a larger RE ionic radius tends to react more readily with CMAS to form Ca2RE8(SiO4)6O2, resulting in poorer corrosion resistance. On the other hand, the reactivity of X2-RE2SiO5 with CMAS can also be assessed by the difference in their OB [107]. A smaller OB difference indicates lower reactivity. Calculations reveal that as the RE ionic radius decreases, the OB difference between X2-RE2SiO5 and CMAS molten salt becomes smaller, leading to lower reactivity and thus better CMAS corrosion resistance.
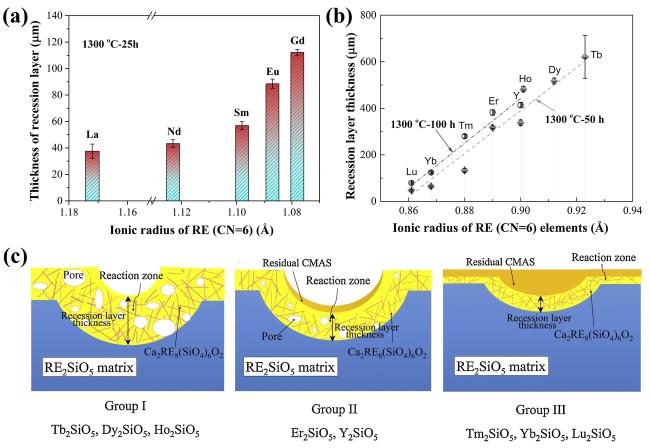
Fig. 28 (a) The recession layer thickness of X1-RE2SiO5 (RE = La, Nd, Sm, Eu, Gd) after CMAS corrosion at 1300 ℃ for 25 h; (b) The recession layer thickness of X2- RE2SiO5 (RE = Tb, Dy, Ho, Er, Y, Tm, Yb, and Lu) after CMAS corrosion at 1300 ℃for 50 h and 100 h; (c) Schematic diagram of CMAS corrosion of X2-RE2SiO5 at 1300 ℃. Reproduced with permission from Ref. [101] for (a), © Elsevier 2019. Reproduced with permission from Ref. [106] for (b, c), © Elsevier 2019. |
Since temperature significantly affects the rate of chemical reactions, Tian et al. also [108,109] investigated the CMAS corrosion behavior of RE2SiO5 (RE = Tb, Dy, Ho, Y, Er, Tm, Yb, and Lu) at 1500 ℃. The corrosion product was consistently apatite, Ca2RE8(SiO4)6O2. In RE2SiO5 (RE = Tb, Dy, Ho, Y, Er, Tm, and Yb), apatite displayed a random orientation, and high-temperature in-situ observations indicated that numerous smaller, laterally arranged apatite crystals precipitated during the cooling process. Conversely, in Lu2SiO5, apatite was predominantly aligned longitudinally, as illustrated in Fig. 29. As the temperature increases, the viscosity of CMAS decreases, leading to accelerated reaction rates and more severe CMAS-induced corrosion of RE2SiO5 at 1500 °C relative to its behavior at 1300 ℃. Under consistent corrosion durations, the CMAS infiltration depths in RE2SiO5 (RE = Tb, Dy, Ho, Y, Er, Tm, and Yb) exhibit a slight reduction with increasing RE ionic radius (Fig. 30), suggesting that the CMAS corrosion behavior is minimally influenced by the RE element species. However, Lu2SiO5 demonstrates superior resistance to CMAS corrosion at 1300 ℃ but undergoes the most significant degradation at 1500 ℃ (Fig. 31 (a)). At 1300 ℃, a small amount of disorderedly arranged apatite forms at the reaction interface (Fig. 31 (b)). In contrast, at 1500 ℃, Lu2SiO5 undergoes decomposition into Lu2Si2O7 and Lu2O3. The Lu2Si2O7 preferentially reacts with CMAS, and the vertically arranged apatite further facilitates rapid CMAS penetration, allowing the molten CMAS to infiltrate along the grain boundaries of Lu2SiO5 (Fig. 31 (c)), exacerbating its CMAS corrosion resistance.
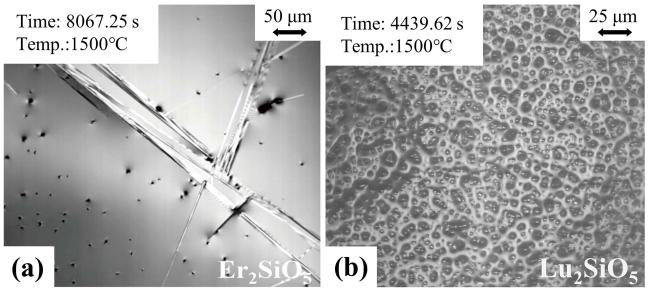
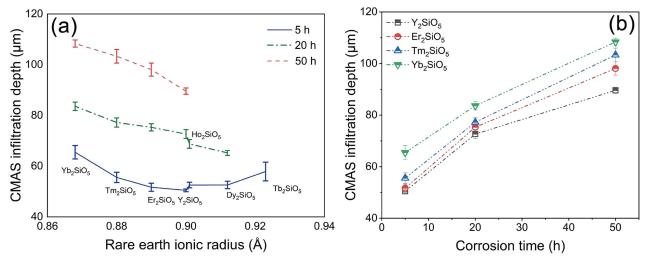
Fig. 30 The CMAS infiltration depth of X2-RE2SiO5 (RE = Tb, Dy, Ho, Er, Y, Tm, and Yb) after CMAS corrosion at 1500 ℃. Reproduced with permission from Ref. [110], © The Author(s) 2023. |
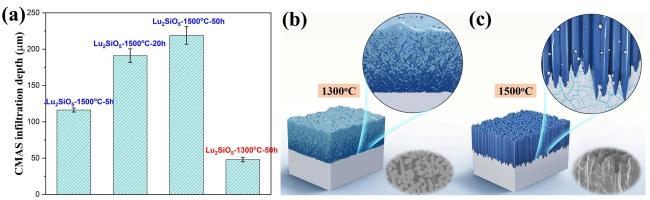
Fig. 31 (a) CMAS infiltration depth of Lu2SiO5 at 1300 ℃ and 1500 ℃. Schematic diagram of the CMAS corrosion behavior of Lu2SiO5 at (b) 1300 ℃ and (c) 1500 ℃. Reproduced with permission from Ref. [109], © Elsevier 2024. |
X2-RE2SiO5 demonstrates superior CMAS corrosion resistance compared to X1- RE2SiO5. Larger RE elements in RE2SiO5 facilitate the formation of Ca2RE8(SiO4)6O2 apatite in corrosion products. At relatively low temperatures, the CMAS corrosion resistance of X2-RE2SiO5 shows a negative linear correlation with the RE ionic radius. However, at higher temperatures, X2-RE2SiO5 ceramics undergo more severe corrosion, and their CMAS resistance becomes less sensitive to the RE element species, instead being influenced by the distribution and structure of corrosion products.
4.2. CMAS corrosion behavior of rare earth disilicate (RE2Si2O7)
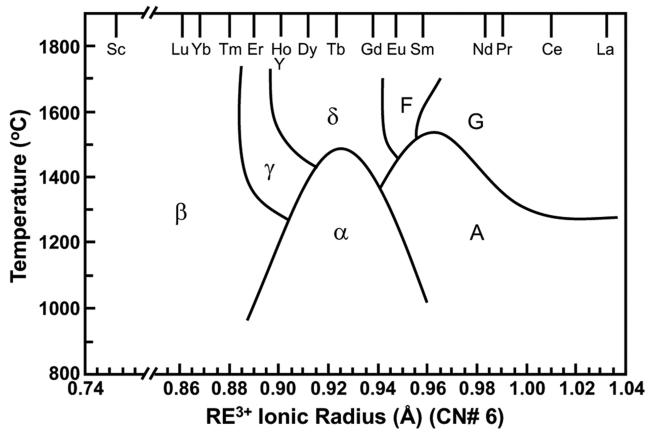
Fig. 32 The relationship between the polymorphism of RE2Si2O7 and the temperature as well as the RE ionic radius. Reproduced with permission from Ref. [100], © Elsevier 2018. |
Kim et al. [110,111] studied the CMAS corrosion behavior of δ-Gd2Si2O7 and β-Er2Si2O7. The reaction product was determined to be Ca2RE8(SiO4)6O2. Under the same conditions, the thickness of the reaction layer in β-Er2Si2O7 was slightly lower than that in δ-Gd2Si2O7, exhibiting better corrosion resistance. This improvement is attributed to the smaller ionic radius of Er, which results in a greater difference with Ca, thus hindering the formation of apatite. Wolf et al. [112] compared the CMAS corrosion behavior of Yb2Si2O7 and Y2Si2O7 ceramics. After 8 h at 1400 ℃, the reaction layer thicknesses of Yb2Si2O7 and Y2Si2O7 were 100 ± 6 μm and 255 ± 9 μm, respectively, with Yb2Si2O7 showing significantly better CMAS corrosion resistance. This is because Yb2Si2O7 has a smaller OB difference with CMAS, resulting in lower reactivity, and it requires more Ca to form stable apatite during the reaction process with CMAS.
Tian et al. [113] investigated the CMAS corrosion behavior and mechanism of RE2Si2O7 (RE = Y, Yb, and Lu) ceramics at 1300 ℃ and 1500 ℃. After 50 h at 1300 ℃, an apatite-rich reaction layer developed within γ-Y2Si2O7, as depicted in Fig. 33 (a). This reaction layer, positioned beneath the residual CMAS melts, exhibits a compact microstructure with minimal porosity, reaching an approximate thickness of 155 μm, effectively impeding further CMAS infiltration. Corrosion of β-Yb2Si2O7 similarly resulted in the formation of an apatite reaction layer, although it was localized on the sample surface, with coarser apatite grains. The CMAS accumulated beneath this layer, characterized by the presence of numerous cracks and voids, and having a reaction zone thickness of approximately 125 μm (Fig. 33 (b)). For β-Lu2Si2O7, no corrosion products were detected after CMAS corrosion, yet the CMAS extensively infiltrated along the grain boundaries, with near-complete CMAS consumption and abundant voids within the reaction zone, which exhibited a thickness of about 330 μm (Fig. 33 (c)). The comparative CMAS corrosion resistance ranks as follows: γ-Y2Si2O7>β-Yb2Si2O7>β-Lu2Si2O7. At an elevated temperature of 1500 ℃, the CMAS is fully consumed, penetrating predominantly along the grain boundaries and permeating the entire sample, leading to “blister” cracks throughout the structure (Fig. 34). The temperature-dependent internal friction of γ-Y2Si2O7, β-Yb2Si2O7, and β-Lu2Si2O7, shown in Fig. 34 (d), indicates low internal friction and a brittle nature below 1300 ℃. Under these conditions, the grain boundaries and interiors exhibit comparable strength, allowing for the gradual dissolution of RE2Si2O7 into CMAS with subsequent apatite precipitation. Above 1300 ℃, however, internal friction increases significantly, signaling an elastic-plastic transition as grain boundary strength diminishes relative to grain interiors. Consequently, at 1500 ℃, CMAS preferentially infiltrates along grain boundaries, rapidly permeating the entire sample.
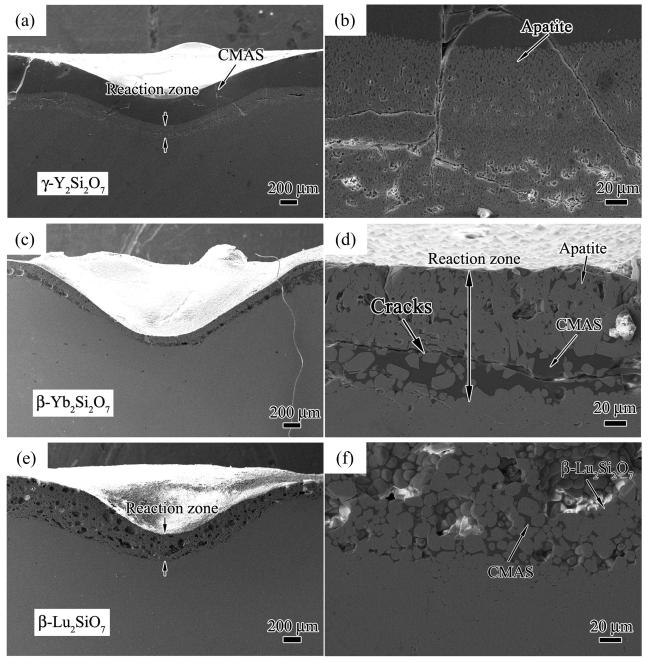
Fig. 33 Cross-sectional morphologies after CMAS corrosion at 1300 ℃: (a, b) γ-Y2Si2O7, (c, d) β-Yb2Si2O7, and (e, f) β-Lu2Si2O7. Reproduced with permission from Ref. [114], © Elsevier 2019. |
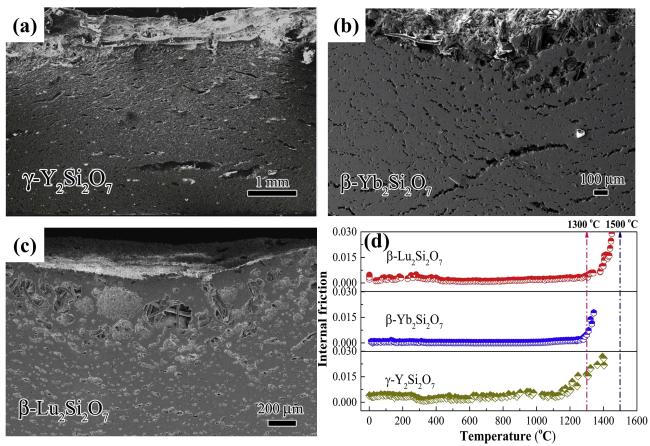
Fig. 34 (a-c) Cross-sectional morphology of RE2Si2O7 (RE = Y, Yb, and Lu) after CMAS corrosion at 1500 ℃; (d) Temperature-dependent internal friction of RE2Si2O7 (RE = Y, Yb, and Lu). Reproduced with permission from Ref. [114], © Elsevier 2019. |
Padture et al. [114,115] investigated the CMAS corrosion behavior of γ-Y2Si2O7, β-Yb2Si2O7, and β-Sc2Si2O7 at 1500 ℃, with cross-sectional morphologies illustrated in Fig. 35 (a-c). For γ-Y2Si2O7, a substantial Ca2Y8(SiO4)6O2 apatite reaction layer was formed, reaching a thickness of approximately 300 μm after 24 h. Conversely, β-Yb2Si2O7 generated only a limited amount of apatite Ca2Yb8(SiO4)6O2, while β-Sc2Si2O7 showed no reaction products and instead underwent dissolution-reprecipitation. This contrast arises is attributed to the larger ionic radius of Y, which enhances its affinity for Ca and provides a strong driving force for Ca2Y8(SiO4)6O2 formation. However, at 1500 ℃, CMAS infiltrated along the grain boundaries of both β-Yb2Si2O7 and β-Sc2Si2O7, leading to significant cracking after CMAS corrosion. This grain boundary infiltration is driven by the interfacial energy dynamics: the ceramic grain boundary energy is more than twice that of the ceramic/melt interface energy, so transforming a grain boundary into two ceramic/melt interfaces reduces the total energy of the system [116]. Additionally, CMAS infiltration along grain boundaries induces differential expansion, with more penetrated regions above expanding to a greater extent than the less-penetrated regions below. This differential expansion generates thermal stresses, leading to “blister” cracks, as shown in Fig. 35 (d). Further studies by Padture et al. [117,118] examined the microstructural and interfacial changes in β-Yb2Si2O7 before and after CMAS corrosion. They observed persistent anisotropy in the alignment of grain boundaries, facet planes, and disconnections, consistently oriented with the {110} planes of β-Yb2Si2O7 both pre- and post-corrosion. This anisotropy enhances the high-temperature stability of β-Yb2Si2O7 and actively impedes CMAS infiltration.
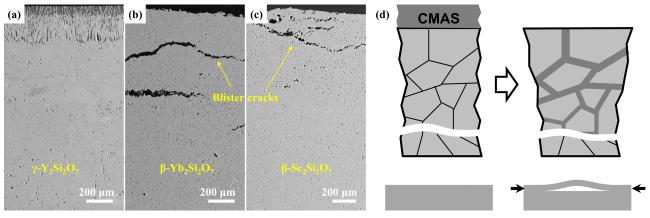
Fig. 36 (a-c) Cross-sectional morphology of γ-Y2Si2O7, β-Yb2Si2O7, and β-Sc2Si2O7 after CMAS corrosion at 1500 ℃; (d) Schematic diagram of the formation of “blister” cracks. Reproduced with permission from Ref. [116] for (a), © Elsevier 2018. Reproduced with permission from Ref. [115] for (b-d), © Elsevier 2018. |
5. Strategies to mitigate CMAS corrosion
Despite the widespread application of TBCs and EBCs to enhance the stability and durability of hot-section components in gas turbine engines, protection against CMAS corrosion remains critical. Research into CMAS corrosion protection methods is vital for improving gas turbine engine performance and enhancing aircraft reliability and safety. While EBCs and TBCs offer protection, the development of new materials and structures resistant to CMAS corrosion is essential. The design of EBCs faces challenges that require multi-layer, multi-component, or multi-scale coating designs, along with advanced coating preparation technologies. Proposed protection strategies include the design of the surface protection layer, optimization of the coating structure, modification of coating components, grain boundary engineering, and the development of new corrosion-resistant materials, as shown in Fig. 37.
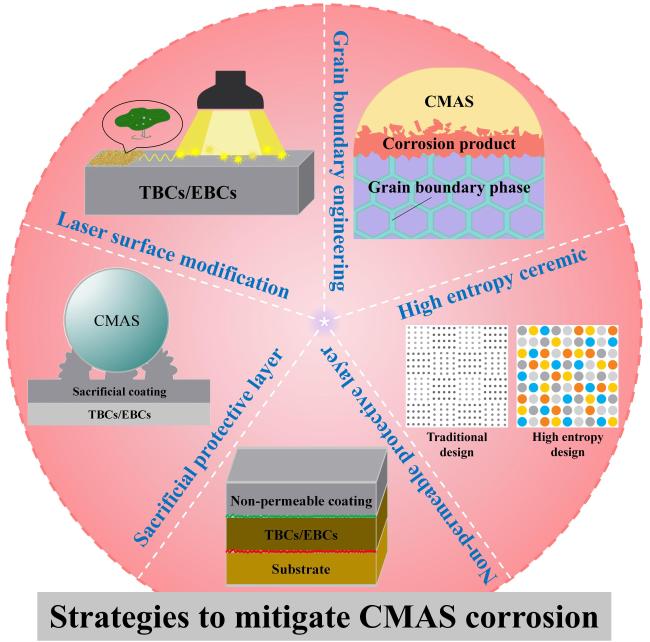
Fig. 37 Strategies to mitigate CMAS corrosion of TBCs and EBCs. |
5.1. Design the non-permeable protective coating
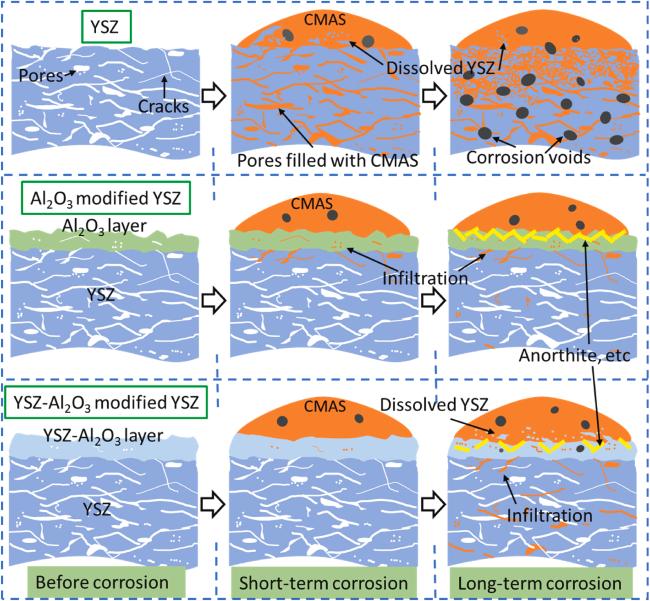
A dense, crack-free, unreactive, non-permeable protective coating can effectively block CMAS penetration. These protective layers can include oxide, non-oxide, or metal coatings, such as Pt, SiC, Al2O3, Si3N4 and their mixtures [125,126]. These materials can effectively slow down the penetration and chemical reaction of CMAS, as well as reduce CMAS adhesion to the coating surface. Yang et al. [127] investigated the CMAS corrosion resistance of Al2O3 and YSZ-Al2O3 coatings on 8YSZ (yttria-stabilized zirconia) by APS. They found that dense YSZ-Al2O3 coatings exhibited superior anti-penetration properties initially. However, over time, interactions with CMAS compromised the structure and phase stability of YSZ-Al2O3, reducing its thickness. In contrast, Al2O3 coatings demonstrated better long-term stability and protection (Fig. 38). In addition, Guo et al. [128] studied the effectiveness of Pt thin films and Gd2Zr2O7 layers in preventing CMAS corrosion. They found that Pt thin films electroplated onto YSZ coatings provided effective resistance to CMAS, while EB-PVD Gd2Zr2O7 coatings were ineffective due to large inter-columnar gaps.
Bakkar et al. [129] applied a Si3N4 impermeable layer using plasma-enhanced chemical vapor deposition. The Si3N4 seals the YSZ surface to mitigate CMAS attack. The interaction between CMAS and Si3N4 causes no cracks or delamination. The defect-free dense layer of Si3N4 presents excellent capability of protecting the YSZ by blocking CMAS infiltration.
5.2. Design the sacrificial protective coating
In contrast to the design of a non-permeable protective layer, a sacrificial protective layer can be employed to consume the CMAS and mitigate the corrosion. This layer actively reacts with CMAS to form a denser, impermeable substance, thereby protecting the underlying coating from erosion. Acting as a “sacrificial” component, it consumes harmful substances, ensuring the integrity and durability of the coating. Wang et al. [130] investigated a double ceramic layer plasma-sprayed YSZ coating that incorporates a sacrificial mullite-YSZ protective layer to suppress CMAS attacks. The double ceramic layer coating exhibits enhanced CMAS resistance due to the formation of the CaAl2Si2O8 layer. No CMAS penetration was observed in the double ceramic layer coating even after exposure for up to 12 hours. Cao et al. [131] studied the deposition of an aluminum film on YSZ TBCs by magnetron sputtering technology, and the formation of a sacrificial alumina protective layer through in-situ oxidation to improve CMAS corrosion resistance. The research shows that the alumina layer, as a sacrificial protective layer, can effectively reduce the penetration of corrosive media on YSZ coating and extend the service life of the YSZ coating (Fig. 39).
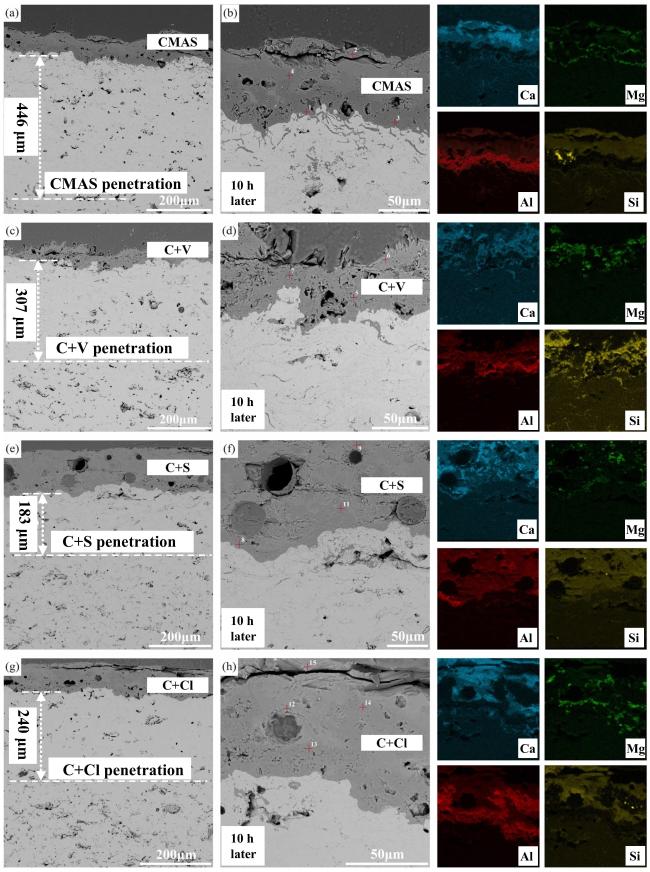
Fig. 39 A cross-sectional SEM images of the Al2O3-YSZ coating exposed to (a-b) CMAS, (c-d) CMAS+NaVO3 powders, (e-f) CMAS+Na2SO4 powders, and (g-h) CMAS+NaCl powders for 10 h, and corresponding EDS mapping results (Ca, Mg, Al, and Si elements) are also provided. Reproduced with permission from Ref. [131], © Elsevier 2024. |
5.3. Optimizing coating surface structure
In addition to blocking the CMAS corrosion through a chemical reaction, another approach is to optimize the coating structure to mitigate the interaction of CMAS with TBCs or EBCs. The coating surface can be treated with laser processing to mimic the structure of a lotus leaf, creating a superhydrophobic surface that prevents molten CMAS from wetting the surface and delays penetration. Fan et al. [132] used femtosecond laser texturing and aluminum film deposition to develop modified TBCs with excellent superhydrophobic properties at 1230 ℃. Compared to untreated TBCs, the contact angle between TBCs and molten CMAS was significantly increased, effectively inhibiting the wetting and diffusion of CMAS (Fig. 40).
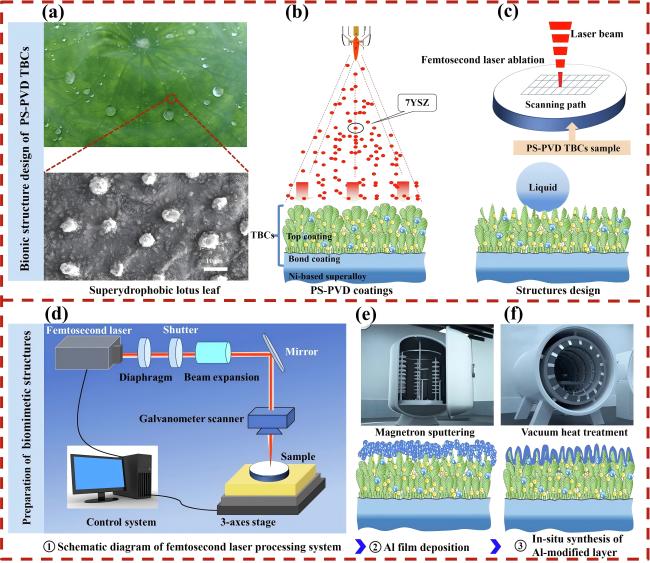
Fig. 40 (a) Superhydrophobic lotus leaf and its microstructure-the source of inspiration. (b) PS-PVD TBCs preparation. (c) Constructing the lotus leaf structure on PS-PVD TBCs surface. (d) Schematic diagram of femtosecond laser processing system and fabrication of micro-nanostructured PS-PVD TBCs. (e) Al film deposition by magnetron sputtering. (f) In situ synthesis of Al-modified layer on laser textured PS-PVD TBCs by vacuum heat treatment. Reproduced with permission from Ref. [132], ©The Author(s) 2024. |
Except for femtosecond laser technology, two other research groups introduced innovative techniques for surface modification. Similarly inspired by the natural superhydrophobic properties of the lotus leaf, Song et al. [133] employed ultrafast laser direct writing technology to create a biomimetic-structured surface on (Gd0.9Yb0.1)2Zr2O7 TBCs, which demonstrated "silicate" phobicity at high temperatures. The molten-volcanic-ash-repelling (CMAS-phobic) characteristics of the surface were attributed to the lotus-leaf-like dual-scale microstructure, particularly the presence of nanoparticles. This surface modification approach was considered a significant step toward developing next-generation aviation engines with reduced vulnerability to environmental siliceous debris (Fig. 41) [133].
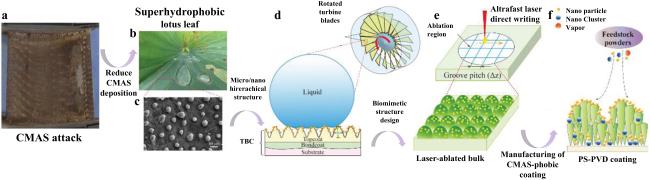
Fig. 41 (a) Volcanic ash accumulation on turbine blades leading to engine failure. (b) Lotus leaf-inspired superhydrophobicity for CMAS-phobic surface design. (c) Micro/nano hierarchical structure on TBC surface reducing CMAS deposition. (d) Biomimetic structure application on turbine blades to prevent CMAS adherence. (e) Ultrafast laser direct writing for micro/nano hierarchical structure on (Gd0.9Yb0.1)2Zr2O7 material. (f) PS-PVD process for CMAS-phobic coating with microconical papillae and nanoparticles. Reproduced with permission from Ref. [133], ©The Author(s) 2023. |
Some researchers combined laser technology with finite element analysis methods. They utilized finite element analysis to investigate the temperature field and stress distribution within the laser glazing process and subsequent exposure to CMAS within the TBCs. The results showed that a tensile stress state occurs along the laser scanning direction, and the maximum principal stress occurs at the interface between the glaze layer and the unmodified coating, which may be the key area for crack initiation and failure of the coating. In addition, the study found that when attacked by CMAS, modified TBCs exhibit high radial stress and maximum principal stress (about 1094 MPa) in the radial range of 0-6 mm, making these areas prone to cracking. The method not only improves the mechanical integrity of the TBC, but also provides insights into stress distribution that can guide future design improvements to enhance CMAS resistance. In addition to laser technology, spraying technology was applied to modify the surface morphologies [134]. Liu et al. [135] designed a unique surface on Yb-doped Y2O3 stabilized ZrO2 (YbYSZ) coatings through solution precursor plasma spraying, which leverages micro-nano structures to provide superior anti-wetting properties. These properties are crucial for preventing CMAS penetration at high temperatures. Their study investigated the structural and compositional changes in YbYSZ-SPPS coatings after prolonged thermal exposure at 1300 ℃, demonstrating the potential of the coatings for long-term use in high-temperature environments. These properties are crucial for preventing CMAS penetration at high temperatures.
5.4. Enhancing CMAS corrosion resistance via grain boundary engineering
In gas turbine engines, CMAS molten salt can infiltrate along grain boundary of TBCs or EBCs, leading to significant material performance degradation. Grain boundary engineering, a field focuses on the manipulation of grain boundaries to improve material properties, has shown potential in mitigating the effects of CMAS corrosion [136]. Grain boundary phase can react with CMAS and block its infiltration pathways. For instance, Tian et al. [137] coated Yb2SiO5 on the surface of YTaO4 powder using the sol-gel method. During high-temperature exposure, Yb2SiO5 forms at the grain boundary and act as corrosion inhibitor, effectively preventing CMAS from corroding the grain boundaries of YTaO4.
In addition to specially designed corrosion inhibitor, some materials can actively react with CMAS as sacrificial phases to inhibit the CMAS corrosion. Wang et al. pre-mixed mullite and Al2O3 with YSZ. The introduction of mullite and Al2O3 altered the grain boundary characteristics of ceramic pellets. Due to its high chemical reactivity, mullite quickly reacts with CMAS to form a sealing layer, reducing the penetration of molten CMAS (Fig. 42).
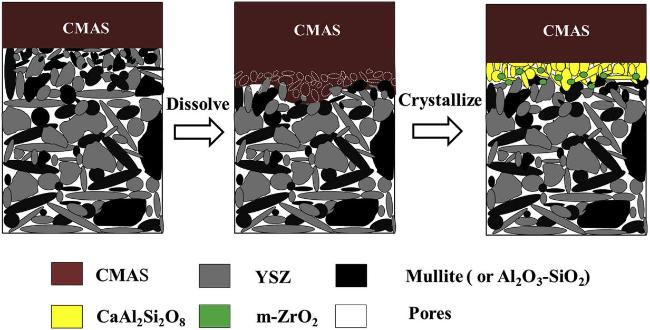
Fig. 42 The etching process of the ceramic material by CMAS. Left: CMAS initially erodes YSZ grains. Middle: CMAS dissolves YSZ to form CaAl2Si2O8 phase. On the right: CMAS crystallizes, forming the m-ZrO2 phase. Reproduced with permission from Ref. [138], ©The Author(s) 2019. |
Beyond the use of corrosion inhibitors and sacrificial agents, mixing the CMAS glass phase in the ceramic powder can effectively prevent the rapid penetration of CMAS glass. N. P. Padture et al. [114] observed that two EBC ceramic materials, β-Yb2Si2O7 and β-Sc2Si2O7 suffered from “blister” crack damage caused by the penetration of CMAS glass into their grain boundaries. To address this issue, they introduced 1 volume % of CMAS glass into β-Yb2Si2O7 powder before sintering. By incorporating the CMAS glass phase at the grain boundary, the rapid penetration of CMAS was effectively prevented avoiding the expansion gradient and reducing the interface energy. (Fig. 43).
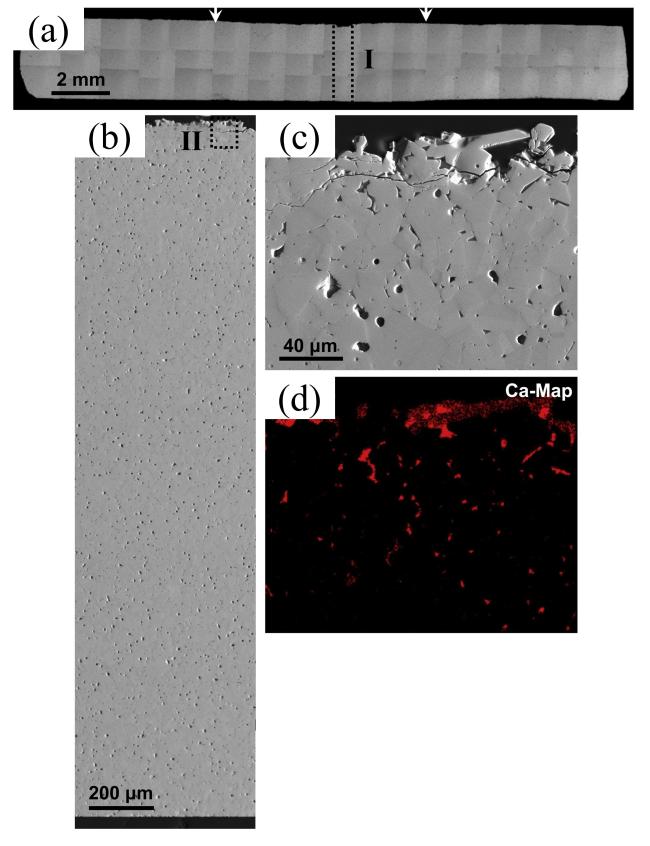
Fig. 43 (a) Collage of cross-sectional optical micrographs of β-Yb2Si2O7/1 vol% CMAS pellet that have interacted with CMAS at 1500 ℃ for 24 h. The region between the arrows is where the CMAS was applied. (b) Cross-sectional SEM image of the whole pellet from the region I. (c) Higher-magnification cross-sectional SEM image of the region II, and (d) corresponding EDS elemental Ca map. Reproduced with permission from Ref. [114], ©The Author(s) 2018. |
In summary, grain boundary engineering provides a promising strategy for the development materials with improved resistance to CMAS corrosion. By understanding and controlling the grain boundary phase, it is possible to design TBCs and EBCs that can withstand the attack of CMAS, thereby extending the service life and enhancing the performance of high-temperature components in gas turbine engines.
5.5. Development of high entropy TBCs and EBCs
The composition of TBC and EBC materials significantly impacts their resistance to CMAS. Most TBCs and EBCs contain rare earth elements, and the large family of rare earth elements offers ample opportunity for composition modification through the solid solution method. Previous studies have shown that the presence of rare earth elements is strongly correlated with resistance to CMAS. As a result, high-entropy TBCs and EBCs are particularly valuable for CMAS corrosion protection due to their flexible and customizable composition design. High-entropy materials, which form single-phase solid solutions with a variety of elements, exhibit enhanced thermal, mechanical, and corrosion-resistant properties compared to traditional single-phase materials, overcoming the limitations of conventional coatings.
Wang et al. investigated the excellent resistance to CMAS of multi-component rare earth disilicates, specifically (Er0.25Tm0.25Yb0.25Lu0.25)2Si2O7, as an EBC material at 1500 ℃. From the perspective of high-entropy materials, the focus is on the synergistic effect of multiple rare earth elements. Y and Lu as inert elements maintain phase stability, while Er and Tm as active elements promote the formation of precipitated phase formation. This rapid phase formation reduces CMAS corrosion activity and significantly enhances the material’s corrosion resistance to CMAS (Fig. 44).
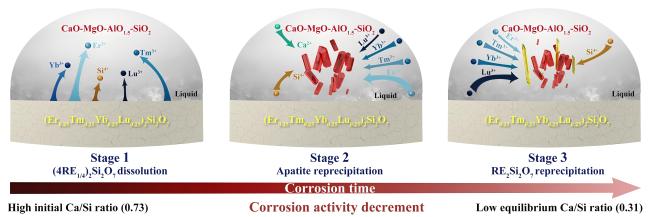
Fig. 44 Schematic diagram for the interaction between CMAS and (Er0.25Tm0.25Yb0.25Lu0.25)2Si2O7 multicomponent disilicate at 1500 ℃. Reproduced with permission from Ref. [139], © Elsevier 2022. |
By combining the stability of apatite with the synergistic effect of high entropy, Chu et al. [140] designed (Ho1/4Er1/4Dy1/4Gd1/4)2Si2O7 as a promising T/EBC material. This material exhibits superior CMAS corrosion resistance and thermal properties, including a low corrosion rate of 8.2 ± 0.14 µm/h at 1673 K. The exceptional performance is attributed to the synergistic effects of high chemical reactivity and the stability of the formed apatite in the CMAS melt. Liu et al. [141] focused on a novel high-entropy ceramic material with low thermal conductivity, (Nd0.2Gd0.2Y0.2Er0.2Yb0.2)2Zr2O7, as a potential material for TBCs. The results showed that the high-entropy ceramic formed a dense reaction layer composed of apatite and RE/Ca-ZrO2, significantly reducing the infiltration rate of CMAS at high temperatures. The study concluded that the high-entropy ceramic demonstrates exceptional resistance to CMAS corrosion, making it a promising candidate for TBCs (Fig. 45).
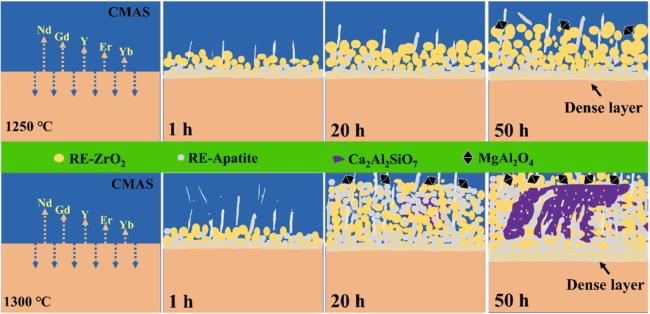
Fig. 45 Corrosion of high-entropy ceramic by CMAS at 1250 ℃ and 1300 ℃. Upper row: 1250 ℃; lower row: 1300 ℃. CMAS interaction leads to dense layers of RE-ZrO2, RE-apatite, Ca2Al2SiO7, and MgAl2O4. Reproduced with permission from Ref. [141], © Elsevier 2023. |
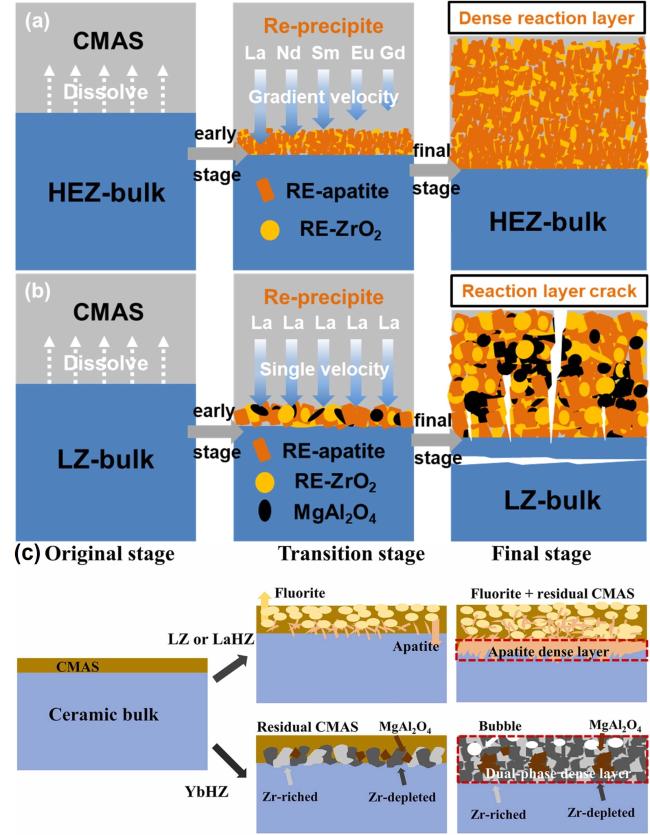
Liu et al. [142] investigated the hot corrosion behavior of (La0.2Nd0.2Sm0.2Eu0.2Gd0.2)2Zr2O7 (HEZ) ceramics when exposed to molten CMAS at 1300 ℃. The high-entropy zirconate ceramics demonstrated a graceful behavior during CMAS corrosion, with no horizontal or vertical cracks forming in either the ceramic substrate or the reaction layer. This was attributed to the lower Young's modulus and higher thermal expansion coefficient of (La0.2Nd0.2Sm0.2Eu0.2Gd0.2)2Zr2O7 ceramics, which resulted in a fine-grained reaction layer without the formation of MgAl2O4 phase. The study concluded that high-entropy rare-earth zirconate ceramics show superior resistance to CMAS corrosion at high temperatures compared to lanthanum zirconate ceramics (Fig. 46 (a) and (b)). Luo et al. [143] investigated the CMAS corrosion behavior of two high-entropy ceramics, (La0.2Nd0.2Sm0.2Eu0.2Gd0.2)2Zr2O7 (LaHZ) and (Nd0.2Sm0.2Eu0.2Gd0.2Yb0.2)2Zr2O7 (YbHZ). YbHZ demonstrated significantly reduced infiltration depths compared to La2Zr2O7. After CMAS corrosion, both LaHZ and La2Zr2O7 exhibited similar microstructures, with apatite and fluorite embedded in CMAS residue, while YbHZ formed a dense nanoscale dual-phase zirconia layer without visible CMAS residue. The study concluded that the formation of a dense and continuous fluorite Ca&RE-ZrO2 layer could provide excellent CMAS resistance, offering a promising strategy for designing CMAS-resistant TBCs (Fig. 46 (c)).
Fig. 46 CMAS-induced corrosion in HEZ and LZ ceramics. (a) HEZ: Dense RE-apatite and RE-ZrO2 layer without cracks, exhibiting graceful degradation. (b) LZ: Formation of RE-apatite, RE-ZrO2, and MgAl2O4 layer with cracks, indicating reduced CMAS resistance. Reproduced with permission from Ref. [142], © Elsevier 2022. (c) Corrosion progression of ceramic materials under CMAS exposure. Initial contact with CMAS initiates corrosion. Transition: LZ and LaHZ exhibit fluorite and apatite formation with residual CMAS and MgAl2O4. YbHZ shows the Zr-rich layer and Zr-depleted regions. Final: LZ and LaHZ develop a dense apatite layer with fluorite and CMAS residues. YbHZ forms a dual-phase layer of fluorite and pyrochlore, with enhanced CMAS resistance and no CMAS residue. Reproduced with permission from Ref. [143], © Elsevier 2024. |
6. Concluding remarks and future directions
The increase in inlet temperatures, driven by the high thrust-to-weight ratio of modern gas turbine engines, has significantly accelerated the corrosion and infiltration of CMAS, presenting a major challenge to the safe operation of gas turbine engines. This review summarizes the behavior and mechanisms of CMAS-induced corrosion in TBCs and EBCs. CMAS corrosion can result in reduced strain tolerance, increased elastic modulus, sintering, thermal expansion mismatch, crack formation, and “blister” cracks in protective coatings. Additionally, CMAS can penetrate and corrode along grain boundaries, pores, and interfaces, causing damage to the turbine blade.
Current research has highlighted the variation in corrosion behavior across different coating materials. For example, the Y element in YSZ ceramics tends to segregate at grain boundaries, promoting grain boundary corrosion. Similarly, rare earth tantalate ceramics exhibit grain boundary corrosion, although without the segregation of rare earth elements. CMAS corrosion resistance is strongly correlated with RE elements in rare earth zirconates. Among these, rare earth monosilicate ceramics show better resistance to CMAS corrosion compared to rare earth disilicates. Furthermore, studies have shown that factors such as the presence of rare earth elements and the corrosion temperature significantly influence the corrosion resistance of TBCs and EBCs. At 1300 ℃, the CMAS corrosion resistance of X2-type rare earth monosilicate ceramics improves as the rare earth ion radius decreases, though this trend diminishes at higher temperatures (1500 ℃). Rare earth disilicate ceramics exhibit milder CMAS corrosion at 1300 ℃ but develop “blister” cracks at temperatures above 1500 ℃.
To address the challenges posed by CMAS corrosion, researchers have proposed several mitigation strategies. Some approaches focus on optimizing the coating structure and composition, such as employing non-permeable layers to delay the penetration and reaction of CMAS or designing high-entropy ceramics that incorporate components with excellent CMAS resistance while maintaining desirable thermal and mechanical properties. Another approach emphasizes the structural design of the protective coatings. Given the strong flow and corrosiveness of CMAS at high temperatures, biomimetic designs that create surfaces to hinder CMAS spread can enhance corrosion resistance.
Based on the above summary, several future directions can be outlined:
(1) Current stage of research on CMAS corrosion in extreme environments typically employs high-temperature CMAS corrosion and characterization at room temperature. However, the high-temperature corrosion process is often considered a “black box”, making it difficult to observe the events occurring during this period. As a result, characterizations at room temperature need to deduce the reaction mechanism. The nucleation, growth, precipitation, movement, and solidification of CMAS corrosion products are crucial for the understanding of CMAS corrosion mechanisms and the degradation of TBCs and EBCs. Despite their importance, relevant in-situ studies remain limited. Therefore, conducting in-situ characterization of CMAS corrosion will provide deeper insights into the corrosion behavior and mechanisms, which will significantly assist in the design of effective anti-corrosion protective coatings.
(2) Most current research on CMAS corrosion in TBCs and EBCs is conducted under corrosion only by CMAS melts. However, in actual service conditions, the presence of water vapor in the combustion gases also poses a significant corrosion threat. Water vapor exhibits high corrosive capability and oxygen diffusivity at elevated temperatures, which can adversely affect both the coatings and the underlying substrates. Under the influence of high-temperature water vapor, the wetting behavior of CMAS may change, potentially enhancing its reactivity. Thus, investigating the synergistic corrosion effects of water vapor and CMAS will be crucial for accurately assessing the performance of TBCs and EBCs in the real-world combustion environment of gas turbine engines.
(3) Most TBCs and EBCs contain rare earth elements, and the extensive family of rare earth elements offers considerable design flexibility for high-entropy ceramics. However, there is currently a lack of theoretical guidance for the compositional design of high-entropy TBCs and EBCs with strong resistance to CMAS corrosion. Moreover, the synergistic effects of multiple components and the selective corrosion of rare earth elements remain poorly understood. Therefore, it is essential to investigate the role of rare earth elements in enhancing CMAS corrosion resistance and to establish design principles for constructing high-entropy TBCs and EBCs.