

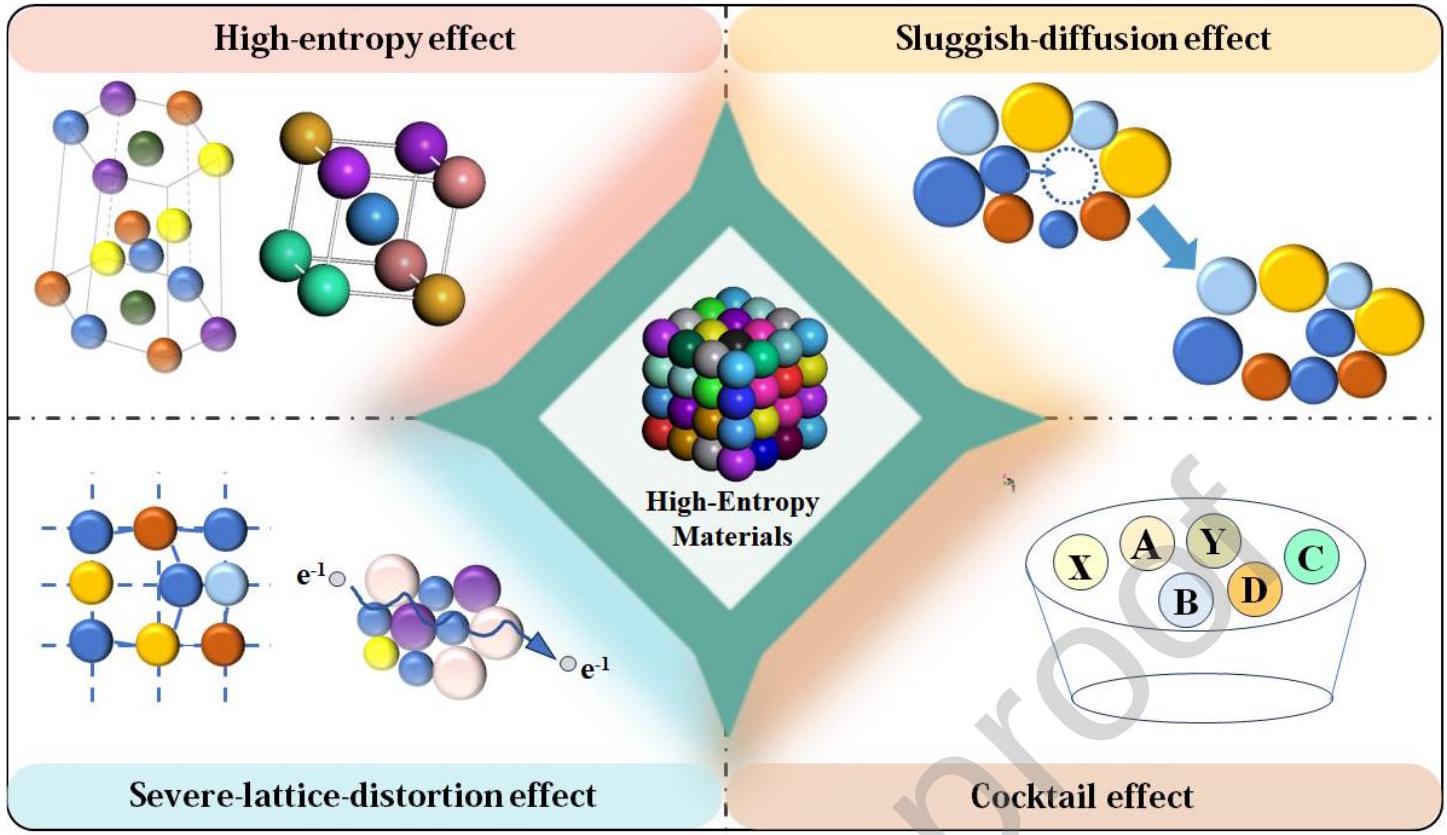
1. Introduction
With the rapid advancement of cutting-edge technologies such as hypersonic vehicles, reusable aerospace platforms, deep-sea exploration equipment, and fusion-energy systems, the demand for electromagnetic stealth and electromagnetic compatibility (EMC) is shifting from room-temperature controllability toward adaptability under extreme environments, highlighting the growing importance of high-performance electromagnetic-wave-absorbing materials [1-5].
Traditional wave-absorbing materials exhibit significant performance degradation under extreme service conditions. While conventional systems-including ferrites [68], magnetic metal microparticles [9,10], carbon-based composites [11,12], and their polymer matrices [13-15]—can achieve electromagnetic attenuation on the order of tens of decibels at room temperature, their fundamental mechanisms deteriorate significantly under extreme environments. Taking magnetic-loss materials as an example, most ferrites exhibit Curie temperatures below ; once the temperature exceeds this range, magnetic ordering gradually collapses, and the saturation magnetization decreases exponentially with temperature [16,17]. Consequently, both natural and exchange resonance effects become markedly weakened, leading to a substantial decline in magnetic loss. Similarly, magnetic metal microparticles are prone to oxidation and phase transformation at high temperatures and in oxidative atmospheres, forming nonmagnetic oxide layers on their surfaces. This not only reduces their magnetic moment but also disrupts the electrical continuity required for effective eddy current loss [18].
Compared with this, carbon materials and carbon-based composites, which rely primarily on dielectric loss, also struggle to maintain stable wave-absorbing performance under high-temperature, strongly oxidative environments [19]. Their absorption mechanisms-dependent on defect polarization, interfacial polarization, and conductive networks-are severely disrupted above due to intense oxidation. Carbon materials rapidly lose mass, their porous structures collapse, and electrical conductivity drops sharply, leading to significant attenuation of both dielectric and conductive losses.
In more complex extreme environments, such as high humidity, heavy salt spray, intense particle irradiation, and severe thermal cycling, traditional wave-absorbing materials also reveal multiple shortcomings. High-humidity conditions cause porous or carbon-based materials to absorb moisture and swell, leading to uncontrollable shifts in dielectric constant and impedance-matching parameters; salt spray accelerates corrosion of magnetic metal microparticles, degrading their magnetic and conductive properties; high-energy particle irradiation induces bond breakage, accumulation of point defects, and interfacial damage, rendering the interfacial polarization mechanisms unstable [20-22].
The emergence of high-entropy materials (HEMs) has provided a promising pathway for addressing these challenges. Generally, HEMs are defined as multi-principal element systems containing five or more principal elements, each with a concentration ranging from 5-35 at% [23,24], A key distinguishing feature of HEMs is their high mixing entropy, typically reaching the threshold of 1.5 R , which favors the formation of simple solid-solution structures (often limited to one or two phases) rather than complex ordered intermetallics. Since the initial report of high-entropy alloys by Yeh et al. [25,26] in 2004, the distinctive attributes of high-entropy systems have been increasingly recognized as conferring advantages that are difficult to replace, particularly when materials are subjected to harsh conditions such as high-temperature oxidation, thermal shock, ablation, intense irradiation, and cryogenic environments [2731].
Consequently, high-entropy alloys (HEAs), high-entropy ceramics (HECs), high-entropy MAX/MAB phases, and their derivatives have been regarded as ideal candidate systems for electromagnetic-wave absorption under extreme environments, within which excellent structural integrity and electromagnetic stability can be preserved under multi-physics coupling conditions [32-36].
In recent years, research on high-entropy wave-absorbing materials has progressed along two distinct trajectories. Compositionally, the field has advanced from early trial-and-error equiatomic alloying toward high-throughput screening guided by phasediagram calculations and machine learning, enabling precise control over the synergy between dielectric and magnetic losses as well as impedance matching [37-40]. Structurally, approaches such as core-shell architectures, layered or gradient interfaces, porous scaffolds, and 3D-printed lightweight lattices/frameworks have been developed to realize deep integration of electromagnetic dissipation pathways, thermal management, oxidation resistance, and mechanical reinforcement [41-45].
On this basis, this review focuses on recent progress in high-entropy materials for electromagnetic wave absorption under extreme environments. It systematically summarizes the absorption performance and structural evolution of HEAs, HECs, high-entropy MAX/MAB phases, and their derived structures in harsh conditions such as oxidation at , salt spray, intense irradiation, cryogenic exposure, and thermal shock. Emphasis is placed on elucidating the effects of compositional tuning, microstructure, phase-boundary characteristics, and multi-field coupling mechanisms on absorption behavior. Furthermore, future research directions-including machine learning-assisted multi-objective optimization, scalable synthesis techniques, and inservice performance evaluation frameworks-are discussed. This review aims to provide a systematic theoretical foundation, material design strategies, and technical pathways to facilitate the transition of high-entropy absorbers from fundamental research to practical engineering applications in extreme environments.
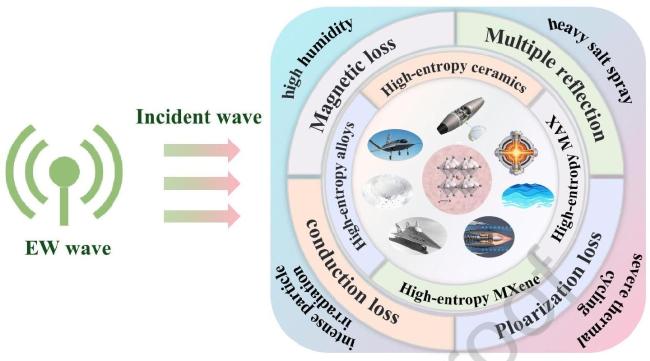
Fig. 1 Application of High-Entropy Materials in Electromagnetic Wave Absorption under Extreme Environments. |
2 Core effects of HEMs and their synergistic mechanisms in electromagnetic wave (EW) absorption
2.1 Typical characteristics and the four core effects of HEMs
The advent of high-entropy materials has fundamentally overturned the conventional design paradigm centered on one or two principal elements, inaugurating a new materials-design philosophy in which configurational entropy governs phase stability in multi-principal-element systems. In essence, the incorporation of multiple major elements introduces pronounced differences in chemical bonding, atomic size, and electronegativity, thereby constructing a highly disordered atomic-scale framework that gives rise to emergent physicochemical properties unattainable in traditional materials. Fully elucidating the tremendous potential of this materials class for electromagnetic-wave absorption hinges on a deep understanding of its four interrelated core effects: the high-entropy effect, severe lattice distortion effect, sluggish diffusion effect, and cocktail effect [24,46-48]. Collectively, these effects establish an integrated framework linking thermodynamic stability, structural features, kinetic behavior, and functional performance, providing a robust theoretical basis for elucidating the extraordinary properties of HEAs, HECs, and high-entropy MAX-phase materials.
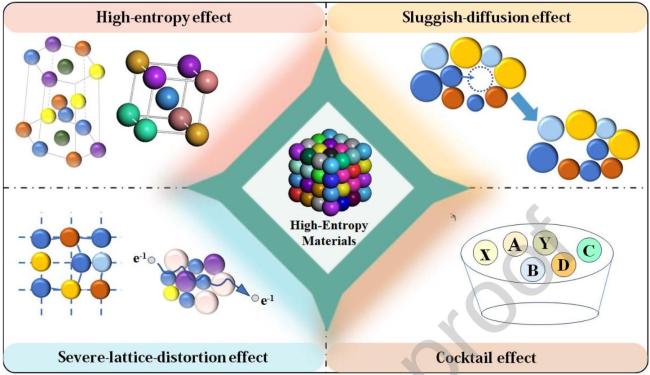
Fig. 2 The four core effects in high-entropy materials |
(1) High-entropy effect
As the thermodynamic cornerstone of HEMs, the high-entropy effect operates through a central mechanism whereby the substantially increased configurational entropy significantly reduces the Gibbs free energy of the system. According to the thermodynamic relation , the configurational entropy of a multi-component system can be evaluated using the Boltzmann formula. When five or more near-equimolar elements are mixed, the system attains a markedly increased configurational entropy (e.g., for a five-element equimolar alloy) [26,49]. Such a large entropy contribution substantially lowers the Gibbs free energy at typical synthesis temperatures, thereby overcoming the usually positive or mildly negative mixing enthalpy and promoting the formation of simple solid-solution phases rather than ordered intermetallic compounds.
For electromagnetic wave absorption, the fundamental contribution of this effect lies in promoting microstructural homogenization and stabilization. In high-entropy alloys, it promotes the formation of single-phase solid solutions-typically face-centered cubic or body-centered cubic structures-whose phase numbers are far fewer than those predicted by the Gibbs phase rule (P+F=C+2). This effectively suppresses the emergence of highly conductive intermetallic secondary phases that would otherwise cause severe impedance mismatch.
The high-entropy effect helps stabilize multi-cation solid-solution structures in high-entropy ceramics. [50,51]. Their intrinsic semiconducting nature, combined with pronounced compositional disorder, provides an ideal platform for tuning both the real and imaginary components of the dielectric permittivity. In high-entropy MAX phases, the incorporation of diverse heteroatoms into either the M sites (transition-metal layers) or A sites (main-group layers) is enabled while preserving the integrity of the lamellar crystal framework; such an inherent nanoscale layering serves as an excellent structural model for engineering interfacial polarization losses. In summary, the high-entropy effect establishes a clean, predictable, and highly tunable microstructural baseline, which is pivotal for subsequent modulation of electromagnetic parameters through lattice distortion and compositional design.
(2) Lattice distortion effect
In the solid-solution structures promoted by the high-entropy effect, severe lattice distortion emerges as the most fundamental structural feature. Because each atom is surrounded by neighboring atoms with disparate atomic sizes, electronegativities, and bonding characteristics, every lattice site is displaced from its ideal crystallographic position [52,53]. The degree of lattice distortion is commonly quantified by the atomic size mismatch parameter :
This distortion field exerts a profound influence on material properties. In terms of mechanical behavior, it introduces a pronounced solid-solution strengthening effect that substantially impedes dislocation motion, thereby markedly enhancing the strength and hardness-an attribute particularly critical for refractory high-entropy alloys and high-entropy ceramics. Regarding transport properties, the intense scattering of electrons and phonons leads to significantly increased electrical resistivity in high-entropy alloys and high-entropy MAX phases, which can be approximated by Matthiessen's rule, while simultaneously imparting ultralow thermal conductivity to high-entropy ceramics.
In terms of electromagnetic functionality, lattice distortion disrupts the periodicity of the crystal lattice, generating abundant defect dipoles that enhance dielectric polarization losses. Meanwhile, it modulates the electronic band structure and thereby tailors the electrical conductivity, providing a key mechanism for optimizing electromagnetic wave absorption performance [54].
(3) Sluggish diffusion effect
From a kinetic standpoint, the aforementioned severe lattice distortion induces the sluggish diffusion effect. Atoms migrating through the highly distorted lattice must surmount fluctuating energy barriers, substantially increasing the diffusion activation energy. Simultaneously, the formation of new phases generally requires the cooperative diffusion of multiple atomic species, rendering the kinetics considerably slower than in conventional binary systems [55]. This effect directly confers exceptional thermal stability on high-entropy materials, markedly retarding processes such as recrystallization, grain growth, and secondary-phase precipitation and coarsening. As a result, high-entropy alloys exhibit superior creep resistance and elevated recrystallization temperatures; high-entropy ceramics retain fine-grained microstructures and stable phase compositions during sintering and service; and high-entropy MAX phases preserve metastable elemental distributions and structural integrity under high-temperature conditions. This intrinsically sluggish kinetic behavior underpins the long-term reliability of high-entropy materials in extreme environments.
The exceptional thermal robustness of HEMs under extreme conditions is attributed to the synergistic effect of high configurational entropy and sluggish diffusion. Specifically, the high-entropy strategy enables the formation of a stable single-phase solid solution, which remains intact at temperatures as high as for extended periods [56,57]. Moreover, as reported by He et al., the introduction of Al atoms into high-entropy nitrides (e.g., MoTaTiCr-Al-N) facilitates the development of a self-passivating Al -rich oxide layer, acting as a robust diffusion barrier that inhibits structural degradation and elemental interdiffusion [58]. The inherently large lattice distortion in HEMs further provides superior resistance to thermal shock, ensuring that the effective absorption performance remains consistent even after severe thermal cycling [56,58].
(4) Cocktail effect
Beyond the linear superposition of individual effects, the cocktail effect reveals the core principle of performance design in high-entropy materials. It highlights that the ultimate properties of these materials arise from the complex, nonlinear synergy among constituent elements as well as between the elements and the crystal and microstructural features [59]. In high-entropy alloys, the incorporation of lightweight elements (e.g., Al, Ti) effectively reduces density, the addition of active elements (e.g., Al, Cr) enhances oxidation resistance, and the combination of refractory metals enables the construction of ultra-high-temperature structural materials. In high-entropy ceramics, precise selection of transition-metal combinations allows fine-tuning of magnetic and dielectric properties, achieving optimal electromagnetic impedance matching. In high-entropy MAX phases, element design at the M and A sites enables the synergistic optimization of mechanical properties, electrical and thermal conductivity, and oxidation resistance. The cocktail effect transforms high-entropy materials into atomic-scale composite systems, giving rise to synergistic enhancements that surpass the performance limits of conventional materials.
The four core effects of high-entropy materials-from the high-entropy effect that thermodynamically stabilizes solid-solution structures, to the resulting severe lattice distortion effect that defines intrinsic material properties, further to the sluggish diffusion effect that ensures high-temperature stability kinetically, and finally to the cocktail effect that bridges microscopic mechanisms with macroscopic performance while unlocking new material innovation possibilities-collectively form a coherent and interconnected synergistic framework [60-62]. A thorough understanding and mastery of this universal framework is crucial for advancing high-entropy materials toward broader applications.
2.2 Fundamental mechanisms of electromagnetic wave absorption
Building upon the unique structural and kinetic characteristics of high-entropy systems, it is essential to correlate these features with the fundamental mechanisms of electromagnetic wave dissipation. The core function of electromagnetic wave-absorbing materials is to dissipate incident electromagnetic energy-through dielectric loss, magnetic loss, interfacial polarization, conductive loss, and multiple scattering mechanisms-by converting it into heat or other forms of energy, thereby weakening reflected and transmitted signals and enhancing the electromagnetic stealth capability of a target [63-66]. According to Maxwell's theory, when an electromagnetic field interacts with matter, the induced perturbation alters the response of the associated electromagnetic fields, resulting in attenuation and loss of electromagnetic waves [6769]. Fig. 3 illustrates the schematic representation of the energy dissipation of an incident EW as it propagates through an absorbing material. When an incident EW enters an absorbing material, a portion of the wave is immediately reflected at the surface due to impedance mismatch, while the remaining part undergoes multiple reflections and refractions within the material, during which it is progressively absorbed and converted into heat. Ultimately, a small fraction of the undissipated EW transmits through the absorber [70].
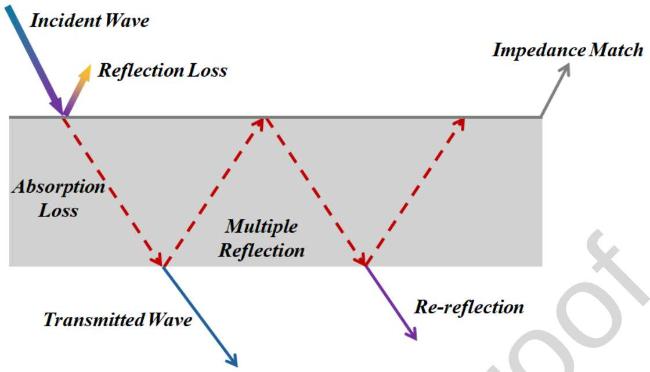
Fig. 3 Schematic diagram of the loss of incident electromagnetic wave through absorbing material. |
Electromagnetic wave-absorbing (EWA) materials dissipate incident energy through electromagnetic losses, which can be generally categorized into three mechanisms: magnetic loss, dielectric loss, and conductive loss [71-75]. Among them, magnetic loss originates from the conversion of external work into heat during the magnetization and demagnetization processes of magnetic materials, and primarily includes hysteresis loss, eddy current loss, and resonance loss [76,77]. Hysteresis loss is typically significant only under strong magnetic fields and can thus be neglected. Eddy current loss arises from electromagnetic induction generated by an alternating magnetic field, causing the magnetic flux density B to exhibit amplitude and phase lag relative to the magnetic field strength H ; its magnitude depends on the electrical conductivity and thickness of the material. Resonance loss, comprising natural resonance and exchange resonance, represents a key pathway through which magnetic materials respond to external fields within specific frequency ranges [78,79].
Under an alternating electromagnetic field, dipoles within the material undergo orientational polarization. When the frequency of the applied field becomes sufficiently high, the dipoles are unable to follow the rapid field oscillations, leading to relaxation behavior. This polarization lag results in energy dissipation of the electromagnetic waves [80,81]. In addition, lattice defects can enhance the polarization process by restricting dipole mobility, while the heterogeneous distribution of space charges at composite interfaces gives rise to macroscopic dipole moments, thereby inducing pronounced interfacial polarization and relaxation. Meanwhile, the conversion of polarization energy from the externally applied electric field to the internal polarization of the material involves charge redistribution, a process that also entails energy consumption. Therefore, defect engineering and heterostructure design can effectively intensify polarization loss, and the dielectric response can be further enhanced by introducing polar functional groups through electronegativity differences or conjugation effects.
In addition to polarization loss, conductive loss is also a key factor influencing the absorption performance. The alternating electric field drives charge carriers within the material to migrate directionally, generating induced currents and thereby promoting the dissipation of electromagnetic energy [82]. According to the free-electron theory, higher electrical conductivity leads to stronger conductive loss; however, excessively high conductivity causes severe impedance mismatch and strong reflection, thereby degrading the overall absorption performance. To maintain appropriate conductivity while achieving favorable impedance matching, various structures such as core-shell, porous, and hollow architectures have been widely designed, enabling the optimization of microscopic transport pathways and interfacial characteristics to balance electrical conduction with reflection suppression.
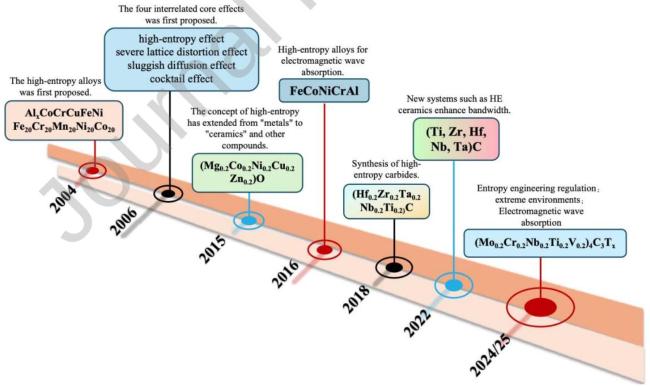
Fig. 4 Advances in High-Entropy Materials for Electromagnetic Wave Absorption |
2.3 Synergistic bridging: how high-entropy characteristics govern EW absorption
Ultimately, the superior performance of HEMs in extreme environments is not merely a result of their individual properties but stems from the profound synergy between high-entropy characteristics and EW loss mechanisms.
Specifically, severe lattice distortion provides the structural basis for enhanced dielectric loss; the displaced atoms and local charge imbalances create abundant defect dipoles, significantly intensifying polarization relaxation [53,83]. Simultaneously, the sluggish diffusion effect serves as a kinetic stabilizer for electromagnetic performance, ensuring that critical loss features-such as grain boundaries and hetero-interfaces remain stable by preventing grain coarsening or phase separation at elevated temperatures. Furthermore, the cocktail effect offers an unprecedented degree of freedom for impedance matching; by strategically combining magnetic and dielectric elements, researchers can achieve a delicate balance between electromagnetic attenuation and surface reflection [84]. This interconnected framework enables HEMs to maintain efficient and stable energy dissipation under multi-physics coupling conditions where conventional materials typically fail.
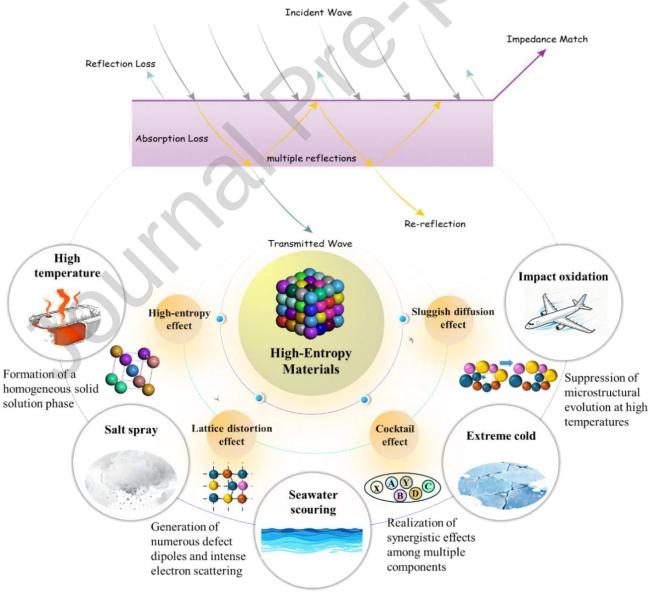
Fig. 5 The unique effects of high-entropy materials enable exceptional absorption performance under extreme conditions. |
3 High-entropy alloys
The core challenge for traditional magnetic metal micropowders (e.g., Fe-, Co-, or Ni-based alloys) is their poor service reliability under high-temperature corrosive conditions. HEAs effectively address this issue: the high-entropy and sluggish diffusion effects ensure exceptional microstructural stability, while the cocktail effect further enables broadband and tunable wave-absorption properties. These combined advantages establish HEAs as a research frontier and a leading candidate for advanced wave-absorbing materials capable of operating in extreme environments.
3.1 Compositional design and optimization
Currently, the design of HEAs wave-absorbing materials primarily focuses on compositional tuning, structural engineering, and surface modification. In terms of composition, the introduction of active elements such as , and Al can form dense protective layers of , or on the alloy surface, significantly enhancing oxidation and corrosion resistance [85]. Simultaneously, precise adjustment of the content ratios of magnetic elements ( ) and resistivity-regulating elements ( Cu , Mn , Ti) enables optimal impedance matching [86], as shown in Fig.6A [87]. Regarding structural engineering, advanced fabrication techniques such as high-energy ball milling [88], rapid melt quenching, and 3D printing can produce flake-like [89], porous [90], core-shell [91,92], or amorphous-nanocrystalline composite architectures [93], thereby extending electromagnetic wave propagation paths and promoting multiple reflections and interfacial polarization effects. For surface modification, methods including phosphidation, nitridation, oxidation, or carbon coating are commonly employed to create insulating layers or compositional gradient layers on particle surfaces, which not only effectively suppress high-temperature oxidation but also introduce additional interfacial polarization sites, further enhancing wave-absorbing performance [92].
3.2 Synergistic design of surface engineering and composite architectures
In the realm of compositional-structural co-design, Hu et al. [94] developed a green and efficient mechanochemical co-diffusion strategy that enables simultaneous strong absorption, broadband response, and environmental robustness in FeCoNiCu high-entropy alloys. As illustrated in Fig.6B, Fe, Co, Ni, and Cu metal powders were used as precursors, while cyanamide ( ) served as the dual source. Under the intense impact-shear action of high-energy ball milling, C and N atoms rapidly diffused into the alloy lattice, yielding lamellar co-diffused HEAs (S003-S010). Fig.6C further elucidates the underlying electromagnetic absorption mechanisms: the lamellar architecture promotes multiple reflections and prolongs the propagation path of electromagnetic waves; lattice distortion and abundant nanocrystalline boundaries induced by incorporation create plentiful dipole and interfacial polarization centers (dielectric loss); and the high shape anisotropy of the thin flakes activates GHz natural resonance coupled with eddy-current loss (magnetic loss). Meanwhile, co-diffusion enhances the electrical resistivity and thus improves impedance matching, enabling efficient dissipation of incident waves into heat. S003 shows a minimum reflection loss of -55.8 dB and an absorption bandwidth of 3.82 GHz at 2.38 mm thickness, while S006 exhibits a further decreased reflection loss of -61.8 dB. The corrosion current density decreases markedly from (untreated) to , and both hardness and modulus are significantly enhanced, demonstrating promising service potential in harsh environments such as marine or high-temperature conditions.
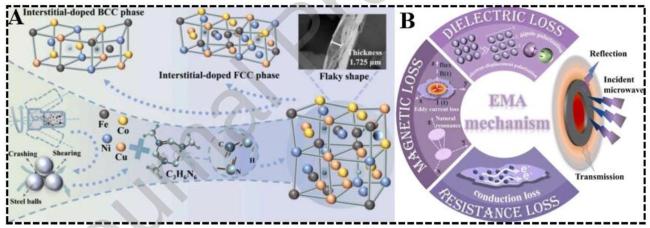
Fig.6 Schematic illustrations of the preparation of carbonitrided FeCoNiCu high-entropy alloy sheets and their electromagnetic absorption mechanism. Reproduced with permission from Ref. [94], © Elsevier 2024. |
Moreover, Liu et al. [95] employed waste polyethylene as a carbon source and developed a green mechanochemical carburization strategy to fabricate HEAs absorbers in a single step, while elucidating their structure-property relationships. According to Fig. 6A, at a thickness of 2.79 mm , sample C10 exhibits a lowest reflection loss of -65.07 dB at 8.88 GHz , whereas C50 and C90 show a significantly wider effective absorption range of up to 5.84 GHz . Fig.6B further unveils the corresponding electromagnetic absorption mechanisms: the high magnetic moment of the BCC phase, combined with lattice distortion, enhances the saturation magnetization and natural resonance loss; the lamellar structures, grain boundaries, and carbon-induced defects provide abundant interfacial polarization centers; and the moderate introduction of carbon lowers the dielectric permittivity, thereby optimizing impedance matching. These synergistic effects enable multiple internal reflections and efficient dissipation of electromagnetic energy as heat. Meanwhile, the corrosion current density is reduced from to , indicating excellent hightemperature oxidation resistance and corrosion tolerance. This work not only demonstrates a promising route for the high-value utilization of microplastic waste but also offers new insights into designing microwave absorbers capable of withstanding harsh service environments.
Surface modification strategies have likewise proven to be an effective route for enhancing the overall performance of HEA absorbers. Jin et al. [89] employed lamellar FeCoNiMn HEAs prepared via high-energy ball milling as the base material and constructed an in-situ dense phosphate insulating layer on the particle surfaces through phosphatization in a phosphoric acid/ethanol solution. This surface engineering simultaneously improved the absorption, corrosion resistance, and oxidation stability of the material. The interfacial polarization induced by phosphatization, coupled with the lattice defects generated during ball milling, forms a hierarchical network of dipolepolarization centers that significantly enhances dielectric loss. Meanwhile, natural resonance and eddy-current loss contributed by the ferromagnetic constituents provide magnetic loss. Under the phosphate-induced reduction of dielectric permittivity, these synergistic effects lead to excellent impedance matching, enabling efficient absorption and dissipation of incident electromagnetic waves into heat. As shown in the comparative results in Fig.7C, sample P50 achieves an minimum reflection loss ( ) of -62.4 dB at 10.7 GHz with an effective absorption bandwidth of 4.1 GHz - both outperforming the corresponding untreated HEAs. Additionally, its reduced corrosion current density and lower oxidation weight gain further demonstrate promising service capability in harsh environments such as marine and hightemperature conditions.
Structural-functional integration represents another important development direction. He et al. [96] investigated 3D-printed FeCoNiCrMn/PLA composites and found that the uniform distribution of high-entropy alloy particles in the PLA matrix enhances absorption performance through the synergistic effect of interfacial polarization and magnetic loss. The composite with exhibits a minimum reflection loss of -24.58 dB at 7.85 GHz with a thickness of 4.5 mm, an effective absorption bandwidth of 2.51 GHz, and maintains good mechanical properties. This approach provides a green, additively manufacturable route for structural functional integrated absorbing components in harsh environments.
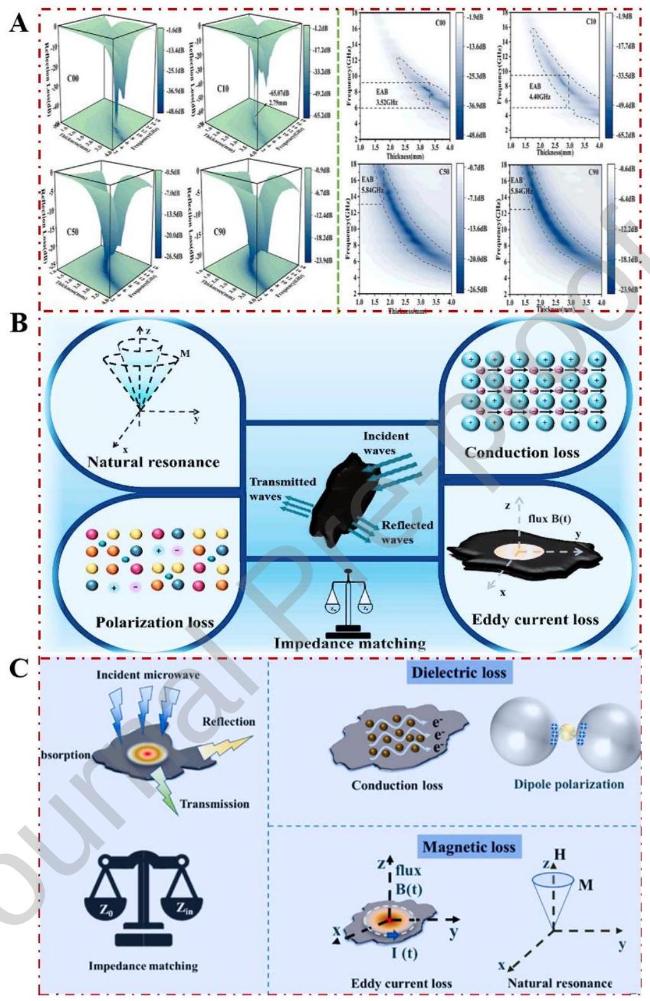
Fig. 7 (A)Three-dimensional (3D) RL, plots and 2D projections for different samples at various thicknesses. Reproduced with permission from Ref. [95], © Elsevier 2024. (B)Carburized FeCoNiMn HEAs. Reproduced with permission from Ref. [95], © Elsevier 2024. (C) Phosphated FeCoNiMn HEAs. Reproduced with permission from Ref. [89], © Elsevier 2024. |
3.3 Process innovation and performance optimization
In terms of process innovation and performance optimization, Li et al. [97] further elucidated the microstructural regulation effects of pulsed magnetic fields on alloys. Magnetic-field-induced grain refinement, enhanced crystallinity, and increased particle-size heterogeneity significantly strengthened the dielectric response, leading to a reflection loss of -46.3 dB under a 6 T field and a increase in effective bandwidth. Their work also confirmed the synergistic contributions of dipole polarization, interfacial polarization, and natural resonance to the overall attenuation mechanism. From a compositional-design perspective, Duan et al. [98] systematically investigated the influence of Cr content and annealing treatment on the electromagnetic properties of alloys. Increasing Cr content enhanced surface polarization and dielectric loss, while annealing further improved magnetization strength, enabling the RL of the sample to increase markedly from -26.88 dB to -47.55 dB . A multi-mechanism synergistic model was established to clarify the corresponding loss pathways. Chen et al. [99] fabricated flake-like, weakly magnetic high-entropy alloys through a melting-gas-atomization-shortduration ball-milling process. The resulting materials achieved ultrathin, broadband absorption at the millimeter and even sub-millimeter scale ( thickness covering a bandwidth) and exhibited corrosion resistance far superior to that of carbonyl iron powders, offering a new material platform for scalable manufacturing of broadband stealth components for marine and other harsh environments. In addition, Wu et al. [100] realized the in-situ construction of a dense oxide layer and an phase transition in FeCoNiCr alloys through surfacegradient oxidation. After oxidation at , the material exhibited a minimum reflection loss of -50.71 dB and an effective absorption bandwidth of 4.3 GHz, together with low corrosion current and excellent oxidation resistance, highlighting its potential for lightweight, broadband absorption in extreme environments.
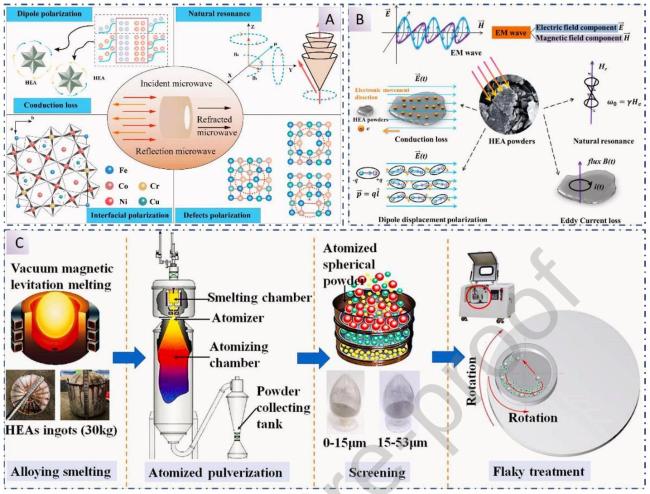
Fig. 8 (A) FeCoNi HEA electromagnetic loss mechanism diagram. Reproduced with permission from Ref. [97], (C) Elsevier 2025. (B)Schematic illustration of the interaction between alloy powders and electromagnetic wave. Reproduced with permission from Ref. [98], © Elsevier 2019. (C)Schematic of the preparation process of HEA flaky powder. Reproduced with permission from Ref. [99], © Elsevier 2025. |
In summary, high-entropy alloy (HEA) microwave absorbers, enabled by the integrated "composition-structure-surface" co-design strategy, have demonstrated strong broadband absorption-exceeding-30 dB with effective bandwidths greater than 4 GHz -even under oxidative and corrosive environments at , thereby preliminarily verifying their applicability in extreme conditions. Recent studies indicate that efficient electromagnetic-wave absorption arises from the combined effects of dielectric mechanisms (interfacial, dipole, and defect polarization) and magnetic mechanisms (natural and exchange resonance, as well as eddy-current losses). However, challenges remain with respect to long-term service reliability, process consistency in large-scale fabrication, and the establishment of performance evaluation protocols under coupled multi-physics conditions. Compared with HEAs, the high-entropy ceramics discussed in the following section possess intrinsically higher thermal stability and oxidation resistance, offering even greater potential for applications in extreme thermal environments exceeding .
4 High-entropy ceramics
HECs exhibit outstanding electromagnetic-wave absorption capabilities under extreme conditions (e.g., high temperatures, corrosive media, and oxidative environments) owing to their unique multi-component synergistic effects, lattice distortion, sluggish diffusion, and interfacial polarization mechanisms. Compared with high-entropy alloys, HECs possess higher structural stability, stronger corrosion resistance, and superior high-temperature oxidation tolerance, making them promising candidates for the next generation of lightweight, high-strength, broadband, and high-temperature-resistant microwave absorbers.
4.1 High-entropy oxides
High-entropy oxides (HEOs), capable of accommodating multiple cations and exhibiting a rich variety of crystal structures-such as rocksalt, spinel, and perovskite-together with highly tunable dielectric and magnetic responses, have emerged in recent years as one of the most rapidly advancing classes within high-entropy ceramic systems. Since Rost et al. [50] successfully synthesized a single-phase rocksalt-structured in 2015, the concept of HEOs has been firmly established and subsequently expanded, giving rise to diverse compositional design strategies and structural families. At present, fabrication routes for HEOs have progressed beyond early solid-state reactions to encompass sol-gel processing, coprecipitation, electrospinning, microwave-assisted synthesis, and pulsed laser deposition, enabling the creation of thin films, bulk ceramics, and nanofibers with tailored morphologies. These advances have laid a solid foundation for elucidating the correlations between their structures and electromagnetic properties [101-104].
In addition, recent studies have shown that the oxygen vacancy concentration in high-entropy oxides (HEOs) is also a key regulatory factor for modulating electronic structure and optimizing electromagnetic absorption performance [105-108]. From the perspective of dielectric loss, oxygen vacancies ( ) act as point defects that break the local lattice symmetry, thereby creating dipole moments that significantly intensify dipole polarization under alternating electromagnetic fields. In entropy-driven multiphase systems, the accumulation of near dense phase boundaries further promotes Maxwell-Wagner-Sillars (interfacial) polarization [105]. More importantly, the introduction of creates intermediate defect levels within the bandgap, facilitating efficient free carrier transitions and hopping conduction. This transition can even lead to a quasi-metallic state with a bandgap narrowing toward 0 eV , which drastically increases the imaginary part of permittivity and enhances conductive loss across a broad spectrum [106].
Furthermore, engineering exerts a profound influence on the magnetic loss and environmental adaptability of HEO-based absorbers. The presence of directly modulates the valence states of constituent transition metal ions, which in turn alters the strength of superexchange interactions and the saturation magnetization. Additionally, the synergistic effect of -induced lattice distortion and phase interfaces can act as pinning centers for domain wall motion, thereby increasing magnetic hysteresis loss [107]. Together with enhanced phonon vibrations originating from local lattice disorders, these mechanisms enable HEOs to achieve superior broadband absorption and high-temperature thermal stability, making them ideal candidates for service in extreme environments [108].
With the expansion of synthesis routes, the influence of distinct crystal structures and microstructural features on the electromagnetic behavior of HEOs has been increasingly elucidated. Wang et al. [109] synthesized a spinel-structured ceramic via a microwave-assisted method, achieving rapid phase formation within a short processing time. They revealed that the synergistic interactions among multiple metal ions induced by high-entropy solid solution significantly accelerate the migration of magnetic ions during hightemperature sintering, leading to a sharp increase in saturation magnetization to 19.7 and an enhancement in coercivity to 241 Oe after annealing at . These changes markedly improve the magnetic stability and resistance to demagnetization. In the frequency range, the material exhibits tunable magnetic and dielectric loss characteristics, while microwave-induced grain growth and homogenized elemental redistribution further optimize its impedance matching and energy dissipation capability. This work provides a representative example of achieving magnetically dominated microwave absorption in spinel-type HEOs.
Beyond single-phase architectures, exploiting multiphase coexistence and interfacial effects to modulate the microwave-absorbing behavior of HEOs has also emerged as an important and rapidly developing research direction. Zhao et al. [110] fabricated two types of dual-phase high-entropy oxides-spinel/perovskite and rock-salt/spinel-via a sintering route, and systematically investigated how phase ratio and structural defects regulate microwave absorption in the range. The results show that multiphase interfaces, together with synergistic lattice distortion, induce abundant point defects and stacking faults, significantly enhancing interfacial and dipole polarization. Consequently, the minimum reflection loss is improved from 35 dB for single-phase ceramics to -54.5 dB , with an effective absorption bandwidth of 3.3 GHz at 2.0 mm , achieving the desired combination of "strong absorption, reduced thickness, and broad bandwidth."
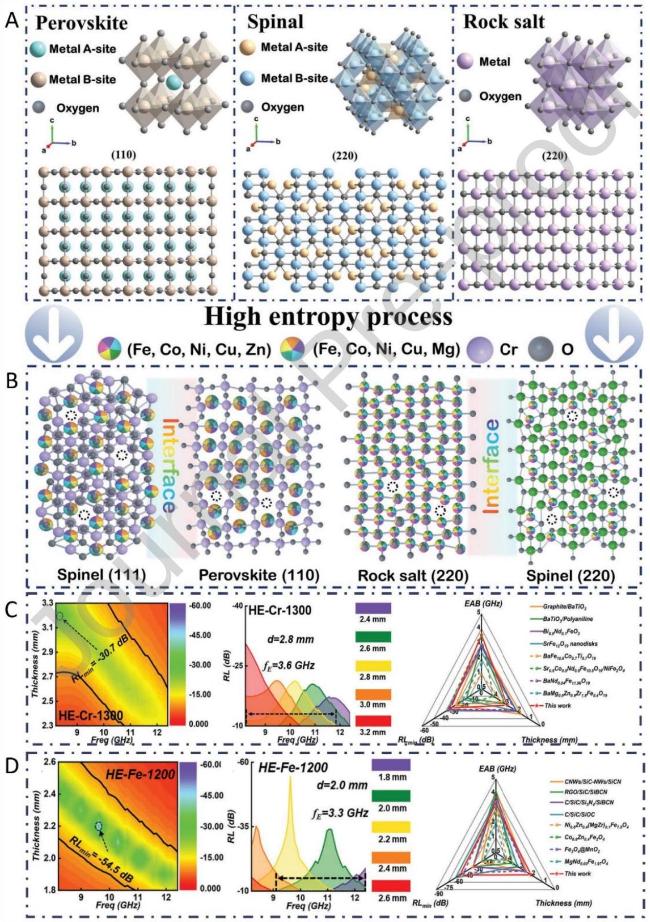
Fig. 9 (A) Crystal structure of perovskite, spinel and rock-salt phases with cubic structure (Fd-3m). (B) Diagram of defect, hetero-interface and lattice distortion in dual-phase HE oxides.(C) RL values of HE-Cr-1300 at X-band with various thicknesses. (D) RL values of HE-Fe-1200 at X-band with various thicknesses. Reproduced with permission from Ref. [110], © Wiley-VCH GmbH 2022. |
To further expand the application potential of high-entropy oxides within composite systems, Zhang et al. [111] designed and synthesized a core-shell high-entropy oxide/polypyrrole nanocomposite, , to achieve efficient microwave absorption combined with corrosion resistance. The core-shell architecture promotes enhanced interfacial polarization and multiple scattering effects, enabling a minimum reflection loss of and an EAB of 6.9 GHz at a filling content of , demonstrating excellent "thin, lightweight, broadband, and strong" absorption characteristics. Corrosion testing further shows that the coating maintains robust anti-corrosion performance even after immersion in solution for 22 days, highlighting its significant potential for integrated applications requiring both wave absorption and corrosion protection.
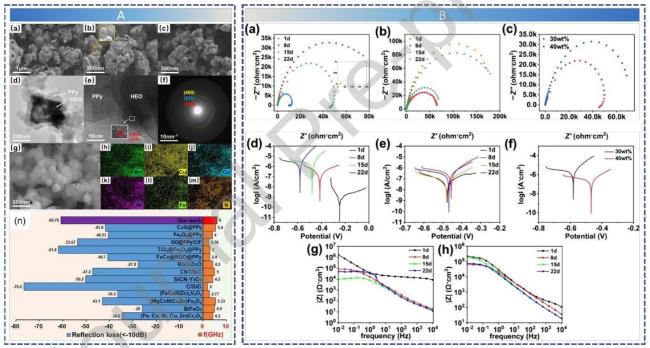
Fig. 10 (A) Microstructure Characterization and Performance Benchmarking of the HEO-based Absorber. (B) Nyquist, Tafel polarization, and Bode plots of materials with different mass ratios after various days of corrosion. Reproduced with permission from Ref. [111] , © Elsevier 2025. |
On the other hand, the lattice distortion, strain fields, and point defects introduced by high-entropy design become even more pronounced in nanostructured systems. Zhao et al. [112] fabricated single-phase ( high-entropy perovskite nanofibers through an electrospinning-calcination process and found that the high density of grain boundaries, shear strain, and oxygen vacancies induced by the high-entropy effect synergistically enhance interfacial and defect polarization, resulting in microwave absorption performance significantly superior to that of conventional ceramics. The absorption bandwidth of this material increases to 1.4 GHz at a thickness of 2.0 mm -more than twice that of the latter-and an absorption efficiency as high as is achieved at a thickness of 3.5 mm , further demonstrating the electromagnetic absorption potential of high-entropy perovskite structures under multifield coupling conditions and in extreme environments.
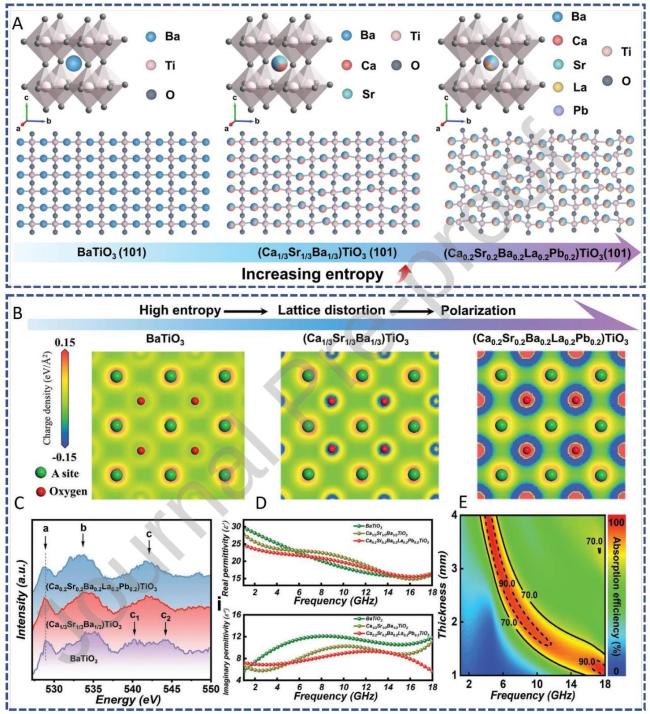
Fig. 11 summarizes the theoretical and experimental characterization, simulated charge distribution, O K-edge ELNES, permittivity, and microwave absorption performance of high-entropy titanate perovskites. Reproduced with permission from Ref. [112], © Wiley-VCH GmbH 2023. |
High-entropy oxide ceramics, enabled by compositional entropy maximization, structural diversification, and micro-defect engineering, exhibit pronounced advantages in dielectric regulation, magnetic - loss enhancement, and interfacial polarization construction. Spanning from single-phase rocksalt and spinel lattices to multiphase heterostructures, and from bulk architectures to nanofibers and core-shell composites, research on high-entropy oxide absorbers is undergoing a systematic evolution-from structural design and mechanism elucidation to synergistic optimization of electromagnetic performance. These advances position high-entropy oxides as promising candidates for electromagnetic protection technologies under extreme conditions such as high temperatures, corrosive atmospheres, and intense radiation.
4.2 High-entropy carbides
High-entropy carbides (HE TMCs), owing to their ultrahigh melting points, high hardness, mixed metallic-covalent bonding characteristics, and exceptional thermal stability, have recently demonstrated remarkable advantages in electromagnetic wave-absorbing applications. The pronounced lattice distortion, chemical disorder, and defect states introduced by the high-entropy effect significantly enhance dielectric polarization and electronic transport, offering new design opportunities for constructing absorbers with simultaneously high attenuation capability, favorable impedance matching, and stability under elevated temperatures. With advances in synthesis technologies, various HE TMCs-such as and -have been successfully fabricated through carbothermal reduction, high-energy ball milling followed by spark plasma sintering (SPS), hot pressing, and microwave-assisted rapid sintering [113-115]. The diversification of synthesis techniques has not only advanced the fundamental understanding of phase-formation rules in HE TMCs, but also enabled precise control over grain size, morphological features, and defect structures, thereby endowing the materials with more versatile and tunable electromagnetic response capabilities.
In terms of microstructural design, nanoscale architectures and one-dimensional morphologies further strengthen the microwave absorption capabilities of HE TMCs. Zhu et al. [116] synthesized one-dimensional nanowires via a fluoride-assisted carbothermal reduction strategy, where the severe distortion and localized defects induced by multi-transition-metal solid solution markedly enhanced dipole, interfacial, and defect polarization. The material exhibits a lowest reflection loss of -50.08 dB at 1.8 mm and an effective absorption bandwidth of 4.675 GHz at 1.7 mm thickness. Similarly, Duan et al. [117] rapidly obtained one-dimensional using a microwave-heating method at only , and the highly ordered, oriented structure provided efficient electron-transport pathways and multilevel scattering channels, enabling a reflection loss of -46.23 dB at 2.7 mm and an absorption bandwidth of 4.76 GHz at 2.2 mm . These studies collectively demonstrate that the integration of structural engineering with high-entropy effects represents an effective strategy for dramatically boosting the microwave absorption performance of HE TMCs.
Achieving synergistic optimization of dielectric and magnetic losses through compositional regulation has also emerged as a key direction in the development of HE TMCs. Wang et al. [118] reported that delivers a reflection loss of -32.1 dB and an absorption bandwidth of 5 GHz at a thickness of only 1.5 mm, demonstrating its potential for lightweight and ultrathin absorber design. Building on this, Zhang et al. [119] introduced computational design into high-entropy carbide systems by constructing series of and , revealing the cooperative roles of different transition metals in modulating electronic structure, conductive loss, dipole polarization, and magnetic loss.
It is worth emphasizing that high-entropy carbides exhibit electromagnetic absorption properties in extreme environments that are markedly superior to those of conventional carbides. Zhang et al. [120] synthesized (Zr,Hf,Nb,Ta)C (HE TMC-2) via vacuum carbothermal reduction at , and further developed a Cr-containing variant, ( )C (HE TMC-3), which more clearly demonstrated the potential of high-entropy tailoring for achieving thermally stable microwave-absorbing materials. The introduction of Cr was found to generate additional magnetic loss through 3d-orbital splitting, while simultaneously suppressing excessively strong dielectric loss within the solid-solution system, thereby establishing a more favorable balance between impedance matching and energy-dissipation pathways. Notably, HE TMC-3 exhibits an effective absorption bandwidth of 13.9 GHz at a thickness of 4 mm , which further expands to 15.2 GHz at 6 mm -nearly covering the entire range, as shown in Fig.12. These results indicate that HE TMC-3 can maintain broadband and stable absorption capabilities under extreme conditions such as hightemperature aerospace components and hypersonic shock-heating environments, making it a strong candidate for electromagnetic protection in harsh environments.
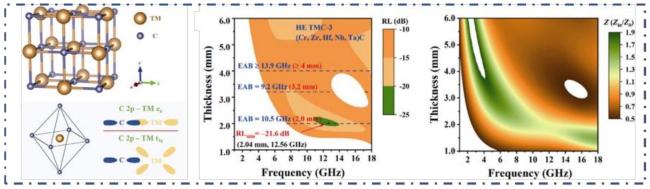
Fig. 12 Microstructure and Electromagnetic Properties of High-Entropy TMCs. Reproduced with permission from Ref. [120]. |
High-entropy carbide ceramics, through multidimensional coupling of composition, structure, and defects, exhibit remarkable advantages in terms of ultrathin design, high efficiency, broadband absorption, and adaptability to extreme environments. With the advancement of computational materials science and high-throughput fabrication techniques, future developments in multiscale structural engineering and precise compositional tuning are expected to further promote the practical application of HE TMCs in electromagnetic absorbers operating under extreme service conditions.
Expanding beyond microwave frequencies, high-entropy ceramics have demonstrated remarkable electromagnetic response in the optical range (ultraviolet and visible light). Recent studies on HEOs and high-entropy oxynitrides (HEONs) reveal that their complex atomic-scale electronic configurations can be tailored for efficient light harvesting. For instance, HEOs with mixed electronic configuration scan achieve a narrow bandgap (approximately 2.5 eV), enabling cocatalyst-free photocatalytic production and conversion [121]. Furthermore, the synthesis of HEONs through nitrogen doping into HEOs further shifts the light absorption edge toward the visible spectrum due to the hybridization of and orbitals. The severe lattice distortion inherent in these high-entropy structures effectively inhibits the recombination of photogenerated charge carriers, facilitating applications such as the photoreforming of plastic waste and high-efficiency reduction [122,123]. These findings underscore the versatility of high-entropy materials as broadband electromagnetic absorbers, extending their utility from microwave shielding to solar energy conversion.
4.3 High-entropy borides
High-entropy borides (HEBs), as an important branch of high-entropy ceramics, exhibit unique material advantages under high-temperature, corrosive, and extreme electromagnetic environments due to their ultrahigh melting points, high hardness, oxidation resistance, and excellent thermal conductivity.
Shen et al. [124] synthesized a series of high-entropy TMB powders with tunable compositions using a boron/carbon thermal reduction method. They observed that adding chromium greatly enhanced impedance matching ( ). As a result, a filler content of and a thickness of 3.3 mm enabled a minimum reflection loss of -46.30 dB . This result indicates that tuning the occupation of transition-metal d orbitals and the degree of lattice distortion can effectively establish more balanced dielectric loss pathways. Based on rapid Joule-heating techniques, Zeng et al. [125] synthesized novel materials at within a short processing time. The introduction of magnetic Fe further activated magneticloss mechanisms, enabling a reflection loss of -33.1 dB at 15.4 GHz and a thickness of 6.0 mm , which is significantly superior to the corresponding nonmagnetic Ta system ( -12.5 dB at ). These findings not only highlight the enhancement of polarization loss induced by lattice distortion and defects through the "cocktail effect" in high-entropy systems, but also demonstrate the critical role of magnetic elements in constructing synergistic dielectric-magnetic absorption.
In terms of composite-structure engineering, Gong et al. [126] prepared high-entropy diboride composite powders via a highenergy ball-milling-assisted boron/carbothermal reduction route. The inclusion of SiC created interfacial polarization sites and conductive networks, resulting in a minimum reflection loss of -44.9 dB at 4.4 mm thickness and an effective absorption bandwidth of 1.28 GHz at 4.0 mm . This demonstrates the effectiveness of combining high-entropy with high-temperature ceramics to form multiscale scattering pathways. Similarly, Liu et al. [127] synthesized a six-component high-entropy diboride, , via a microwave-assisted molten-salt reduction method at only for 20 minutes. The lattice distortions induced by the high configurational entropy further optimized impedance matching, resulting in a microwave absorption rate of at a thickness of 4 mm . The absorption performance significantly surpasses that of conventional , highlighting the potential of HE TMB for lightweight and low-temperature fabrication of microwave absorbers.
Zhang et al. [128] proposed a novel strategy for designing lightweight, broadband absorbers suitable for high-temperature and corrosive conditions. They prepared a series of high-entropy rare-earth hexaboride/tetraboride ( ) composite powders via a single-step reduction under vacuum at . The coexistence of and phases was found to synergistically tune the electromagnetic properties and enhance absorption performance. Lattice distortions, elemental segregation, and interfacial polarization induced by the high-entropy effect strengthened the coupling of dielectric and magnetic losses. Additionally, the materials feature micrometer-scale particles, low density ( ), and excellent hightemperature oxidation resistance, as illustrated in Fig.13.
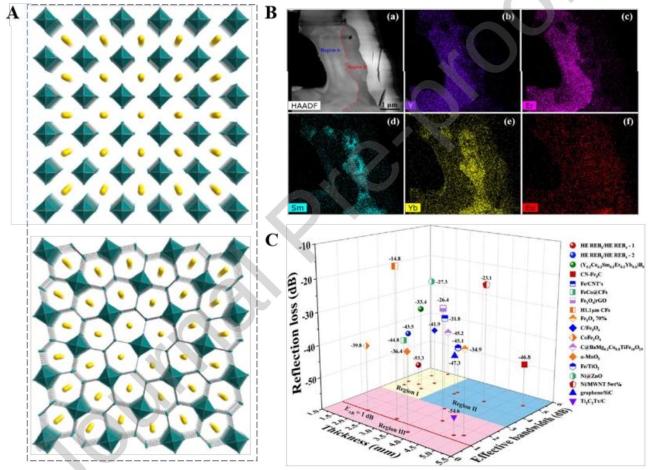
Fig. 13 Crystal structure of (A)REB 6 and REB 4 . (B)HAADF-STEM image of the high-entropy REB powder along with corresponding elemental distribution maps. (C)Comparison of electromagnetic wave absorption performance. Reproduced with permission from Ref. [128], © Elsevier 2021. |
HEBs systems achieve synergistic enhancement of impedance matching, polarization loss, conductive loss, and magnetic loss through lattice reconstruction, defect strengthening, and electronic-structure modulation induced by multi-component solid solutions. With the development of rapid synthesis techniques such as Joule heating, microwave-assisted methods, and molten-salt-mediated routes, combined with in-depth investigations of composite architectures and dual-phase coupling mechanisms, HEBs are increasingly demonstrating their advantages as material systems for electromagnetic absorption under extreme environments, providing promising directions for high-temperature absorbers and lightweight protective applications.
Although most high-entropy ceramics reported to date have not yet undergone systematic service tests under extreme conditions such as high temperatures, salt spray, or oxidation, their inherent characteristics-including ultra-high melting points, high hardness, excellent thermal stability, and robust structural integrity-provide a solid foundation for their use in harsh environments.
5 High-entropy MAX/MXene
High-entropy MAX phases and their derived high-entropy MXenes (HE-MXenes) have emerged as important directions in the field of electromagnetic wave absorption in recent years. The high-entropy effect, through mechanisms such as multi-principal element solid solution, lattice distortion, interfacial polarization, and hysteretic diffusion, provides unique advantages for tuning dielectric/magnetic responses, constructing multi-scale loss channels, and enhancing adaptability under extreme environments. Relevant studies have mainly focused on the wave absorption behavior of high-entropy MAX phases and the multi-mechanism coupled absorption in high-entropy MXene-based composites.
5.1 Preparation and microwave absorption properties of high-entropy MAX
By introducing multi-principal element solid solutions at the M or A sites, high-entropy MAX phases can significantly modulate electromagnetic parameters and enhance absorption losses. Chen et al. [33] employed a molten-salt isostructural substitution strategy to introduce Fe into the A site of multi-principal element MAX phases, successfully preparing magnetic high-entropy MAX phases and . The Fe substitution induced lattice expansion and enhanced distortion, triggering strong interfacial/defect dipole polarization in the range. Meanwhile, the exchange interactions within the Fe layers introduced natural resonance and eddy current loss, achieving synergistic multi-loss mechanisms over the band. Typical samples exhibited a minimum reflection loss of -44.4 dB at a thickness of 3 mm , demonstrating the significant promotion of dielectric-magnetic dual-loss behavior through high-entropy tuning.
Beyond room-temperature performance, high-entropy MAX phases also show excellent structural and electromagnetic stability at elevated temperatures. Qiao et al. [44] prepared , which maintained wideband absorption after oxidation at feat difficult to achieve with conventional MAX phases. The heterointerfaces formed after oxidation further enhanced polarization loss, enabling strong absorption of -42.4 dB even after high-temperature oxidation, indicating that high-entropy MAX phases are promising candidates for stable wave-absorbing materials under extreme thermal environments.
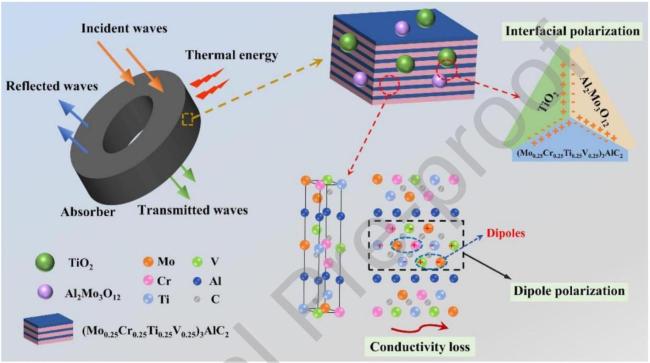
Fig. 14 Schematic illustration of the Ey wave absorption behaviors and mechanisms for MCTV- 800 powders. Reproduced with permission from Ref. [44], © Elsevier 2023. |
5.2 Preparation and microwave absorption properties of high-entropy MXenes
After successfully synthesizing bulk HE-MAX phases, a top-down precursor approach is typically employed to selectively etch the A-layers (primarily Al or Si ), thereby achieving interlayer "delamination" and ultimately yielding multilayer high-entropy MXenes.
For example, Du et al. [129] selectively etched the HE-MAX phase using a mixed solution with LiF ) at for more than 24 hours, successfully producing high-entropy MXene atomic layers, as shown in Fig.14. The etching procedure successfully removed the Al layers and simultaneously generated surface functional groups such as -F and -O . This process also facilitated the formation of a uniform solid-solution of Ti, V, Zr, Nb, and Ta within the atomic layers. Benefiting from the combination of high configurational entropy and low Gibbs free energy, the resulting high-entropy MXene shows remarkable atomic-scale stability, along with significant lattice distortions and mechanical strain.
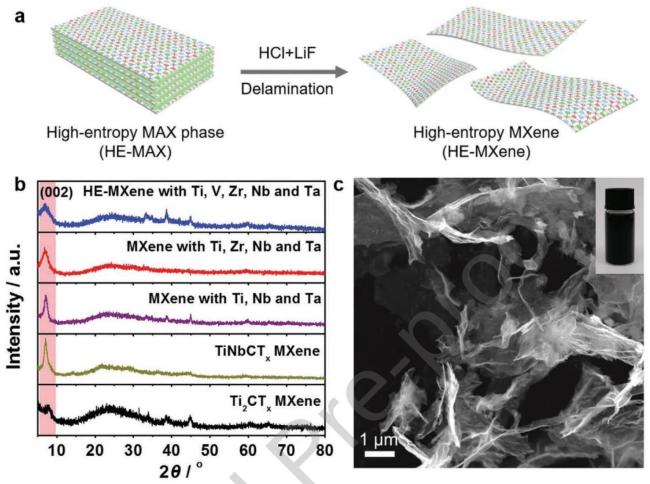
Fig. 15 Morphology and structure characterization of high-entropy MXene. Reproduced with permission from Ref. [129], © Wiley-VCH GmbH 2021. |
Liu et al. [130] employed a Lewis-acid molten-salt etching method, using a powder mixture at under an argon atmosphere for 7 hours, to selectively etch HE-MAX phase precursors, such as . This process successfully removed the Al atomic layers while simultaneously enabling efficient in situ introduction of -Te terminal groups, thereby producing multilayer HE-MXene . The entropy-driven synthesis process and the resulting modulated periodic ripple superstructure of the MXene are illustrated in Fig.16.
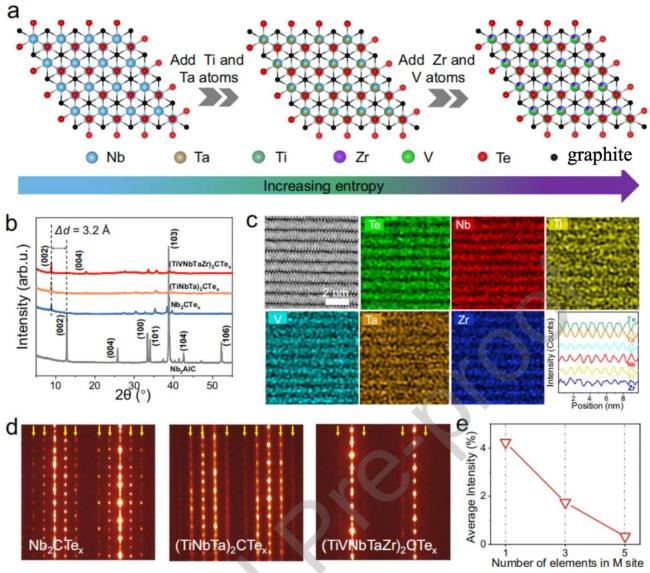
Fig. 16 illustrates the lattice evolution, XRD patterns, atomic-resolution elemental mappings, SAED patterns, and the effect of M-site element number on the diffraction intensity of high-entropy MXenes. Reproduced with permission from Ref. [130]. |
The high configurational entropy introduced in these MXenes not only stabilizes their structure but also significantly enhances their dielectric and magnetic loss mechanisms, resulting in remarkable microwave absorption properties. Qiao et al. [131] first synthesized and , demonstrating that the high-entropy effect can induce strong lattice distortion, charge separation, and defect dipoles, greatly enhancing interfacial/dipole polarization and electrical conductivity loss. With only a loading, both multi-principal-element MXenes achieved strong absorption of -45 to -53 dB , with EAB covering the C/X/Ku bands, while also offering the combined advantages of lightweight, thin-layer structure, and low filler content. To further improve performance, researchers have focused on compositing high-entropy MXenes with various functional materials, mainly forming several promising systems as follows:
(1) Magnetic hybrid systems
Single MXenes typically exhibit predominantly dielectric loss, whereas constructing composites with magnetic phases can induce stronger magneto-dielectric synergistic effects. In the hybrid material prepared by Wu et al. [132], lattice distortion and multi-element electronic structure of the high-entropy MXene suppressed grain boundary formation and slowed oxidation, while the 0D/2D heterointerfaces generated strong interfacial polarization. particles introduced natural resonance and eddy current loss, achieving multi-mechanism synergy. This system exhibited an absorption intensity of -57.6 dB and a broadband performance of 4.7 GHz at a thickness of 1.46 mm , along with excellent antioxidation, corrosion resistance, and radar cross-section (RCS) reduction capabilities, demonstrating strong application potential.
(2) Porous and hierarchical structures
Constructing hierarchical porous architectures can further extend electromagnetic wave propagation paths and increase interfacial density. Shan et al [133]. fabricated 3D MXene/cellulose cavity structures via directional freeze-casting, which in a nonmagnetic system exhibited enhanced eddy current-magnetic vibration coupling. This shifted the main absorption peak from the X band to the S band, achieving strong lowfrequency absorption of -47.9 dB . The material also offered ultralow density and multiband compatibility, providing new avenues for low-frequency stealth applications.
(3) Magnetic-dielectric 3D networks
Wang et al. [134] constructed ordered 3D porous networks of MXene/sodium alginate/Co-C@MWCNT, forming a coupled structure of conductive and magnetic phases. This configuration achieved absorption-dominated EMI shielding, with a vertical incidence shielding effectiveness of 41.7 dB , while maintaining mechanical stability under large deformations.
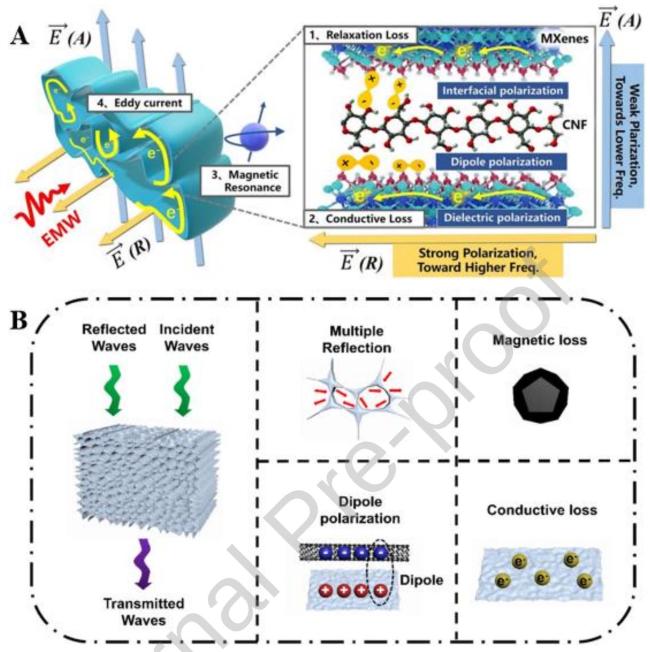


Overall, the high-entropy effect can effectively modulate lattice distortion, electronic structure, interfacial behavior, and defect types in MAX/MXene systems, thereby achieving synergistic enhancement of multiple mechanisms such as dielectric loss, magnetic loss, and multiple scattering. Whether in single-phase HE-MAX, single or few-layer HE-MXenes, or magnetic, carbon-based, and porous composites, wave absorption performance has demonstrated a comprehensive advantage of thin layers, broadband response, and high intensity. Moreover, the high-temperature stability, antioxidation, and environmental adaptability afforded by high-entropy tuning render these materials highly promising for electromagnetic protection in extreme environments.
Table 1. Comparison of Electromagnetic Wave Absorption Performance for High-Entropy Materials under Extreme Environments |
| No. | Material System | RLmin (dB) | EAB (GHz) | Thickness (mm) | Structure/Treatment | Sample Pretreatment | Reference |
|---|---|---|---|---|---|---|---|
| 1 | FeCoNiCuTi0.2 | -47.8 | 4.76 | 2.16 | Flaky | [87] | |
| 2 | FeCoNiMn@P | -62.4 | 4.1 | 2.1 | Phosphorization | [89] | |
| 3 | FeCoNiCu(C,N) | -61.8 | 3.82 | 2.38 | CarbonNitrogen Co-diffusion | [94] | |
| 4 | FeCoNiMnCx(C10) | -65.07 | 5.84 | 2.79 | Carburization | [95] | |
| 5 | FeCoNiCrMn/PLA | -24.58 | 2.51 | 4.5 | 3D Printing | Seawater + Oil pollution | [96] |
| 6 | FeCoNi1.5 CuCr | -46.3 | 4.1 | 2.0 | Magnetic field treatment (6 T) | 6 T pulsed magnetic field | [97] |
| 7 | FeCoNiAlCr0.9 | -47.55 | 6.6 | 1.9 | Ball Milling + Annealing | Annealing at | [98] |
| 8 | FeCro. 5 NiCu0.5 | -26.1 | 3.6 | 1.2 | Gas Atomization + Ball Milling | Marine salt | [99] |
| 9 | FeCoCrMn | -59.6 | 6.86 | 1.32 | Multi-element (C, N, O) Penetration | [100] | |
| 10 | TiVNbMoC3Tx/Fe3O4 | -57.59 | 4.72 | 1.46 | 0D/2D hybrid, electrostatic self-assembly | Oxidation | [132] |
| 11 | (Mo0.25Cr0.25Ti0.25V0.25)3AlC2 | -45.80 | 3.6 | 1.7 | High-entropy MAX phase, solid-state synthesis | Oxidation ( , for 1 h ) | [44] |
Table 2. summarizes several major categories of high-entropy materials (alloys, oxides, ceramics, carbides, borides, MAX/MXene), outlining their core advantages and main challenges. High-entropy materials generally exhibit good structural stability, strong tunability of properties, and high environmental adaptability. However, they also face issues such as high density, brittleness, difficulties in synthesis and processing, insufficient stability, or being in the early stages of research. Future development requires further breakthroughs in process optimization and long-term reliability. Table 2.High-Entropy Materials for Electromagnetic Wave Absorption in Extreme Environments:A Comparative Summary of Strengths and Challenges |
| Material Category | Main Advantages | Key Limitations / Challenges |
|---|---|---|
| High-entropy alloys | 1. Excellent structural stability: Resulting from the combined effects of the high-entropy effect and sluggish diffusion effect. 2. Strong tunability of properties: The “cocktail effect” facilitates the achievement of broadband and tunable wave-absorbing properties through compositional design. 3. Flexible processing; | 1. Long-term service reliability requires further verification; 2. Relatively high density. |
| High-entropy oxides | 1. Exceptional thermal stability and oxidation resistance; 2. Excellent corrosion resistance:The ceramic nature inherently provides superior corrosion resistance. | 1. Typically, low electrical conductivity; 2. High brittleness and poor toughness. |
| High-entropy ceramics | 1.Extreme environmental adaptability; 2. Broadband and efficient absorption:Lattice distortion and defect states significantly enhance polarization loss. | 1. Extremely high synthesis temperature; 2. Difficulties in processing and shaping. |
| High-entropy Borides | 1. Outstanding comprehensive performance:Combines ultra-high melting point,high hardness,good thermal conductivity,and oxidation resistance; 2. Easy tuning of impedance matching. | 1.Research is still in its early stages; 2. Immature composite processing technology. |
| High-entropy MAX/MXene | 1. Unique structure-function characteristics:The layered structure can be easily exfoliated into MXene; 2. Good environmental adaptability. | 1. Stability issues:Multilayer MXene is prone to oxidation in humid or high-temperature environments,and long-term stability remains an application bottleneck. 2. Etching process is complex and hazardous. |
6 Challenges and Future Perspectives
Despite the significant advantages of HEMs in electromagnetic wave absorption, their practical deployment specifically under extreme service conditions still faces critical challenges.At present,the phase formation rules and electromagnetic response mechanisms of multi-principal-element systems under intense thermal mechanical stimuli are not fully established. Future research must move beyond ambient state composition-structure-property relationships toward environment driven predictive design, integrating machine learning with first principles calculations to account for dynamic phase stability and interfacial evolution in harsh atmospheres.
In terms of fabrication while laboratory-scale techniques are maturing,there is an urgent need to develop engineering-compatible technologies-such as plasma spraying and additive manufacturing-that can realize large-scale components with high thermal-shock resistance and structural integrity.Crucially,HEM absorbers in practical service are subjected to coupled multi-physics fields(thermal,mechanical,chemical, and irradiation effects).Therefore,future development must prioritize systematic accelerated life evaluation and in-situ electromagnetic testing under simulated extreme conditions.Validating performance within realistic environments,such as turbine hot sections or fusion reactor interiors,is essential to transition these materials from “laboratory curiosities” to reliable shielding solutions.
Additionally, to ensure the sustainability of next-generation electromagnetic protection equipment, constructing oxidation-resistant and eco-friendly compositional systems is of paramount importance. Overall, the evolution of HEM absorbers will depend on a shift toward "survival-oriented" design philosophies, where cross-scale theories and intelligent optimization are utilized specifically to ensure structural functional integration under multi-field coupling, thereby accelerating their deployment in the most demanding aerospace and nuclear applications.
7 Conclusion
High-entropy materials, owing to their unique core effects-such as high configurational entropy, multi-principal-element solid solution, severe lattice distortion, and hysteretic diffusion-offer a novel approach to addressing the failure issues of conventional wave-absorbing materials under extreme environments, including high temperature, strong oxidation, corrosion, and irradiation. High-entropy alloys exhibit stable magnetic loss and interfacial polarization behavior at 550-800 ; high-entropy ceramics maintain phase and dielectric parameter stability in the range; and high-entropy MAX/MXene systems achieve thin, lightweight, and efficient broadband absorption through multi-element interfacial polarization, defect dipoles, and magneto-dielectric synergistic mechanisms. Overall, while ultra-broadband performance is an exceptional achievement in high-entropy MAX/MXene systems, high-entropy materials have demonstrated strong absorption exceeding -30 dB and effective bandwidths greater than 10 GHz across multiple systems and structural designs, highlighting their broad potential for electromagnetic wave absorption in extreme environments.
However, current research still faces key challenges, including incomplete understanding of composition-design mechanisms, limited scalability of bulk fabrication, lack of multi-physics coupled service data, and sustainability concerns. Looking forward, the integration of machine-learning-driven high-throughput screening, scalable advanced fabrication techniques, and structure-function integrated design strategies is expected to enable the transition of high-entropy materials from laboratory research to engineering applications, playing a critical role in extreme scenarios such as thermal components of hypersonic vehicles, aircraft engine nozzles, deep-sea pressure-resistant structures, and fusion reactors.
Declaration of Competing Interest
The authors declare that they have no known competing financial interests or personal relationships that could have appeared to influence the work reported in this paper.