Search
Submit
Toggle navigation
Home
About Journal
Journal Information
Editorial Board
Awards
Journal Metrics
Contact
Journal Online
Just Accepted
Current Issue
Highlights
Archive
Most Read
Most Download
Most Cited
Guide for Authors
Subscribe
EM in ScienceDirect
More options
Journal
DOI
ALL
Animal Research Perspectives
Composite Functional Materials
Extreme Materials
INTERNATIONAL SCIENCE ACCELERATOR
Low Carbon Energy
Publication year from
To
All
2025
2026
All
2026
2025
Volume
Issue
Author
Affiliation
Search result
Journal
Loading ...
Publication year
Loading ...
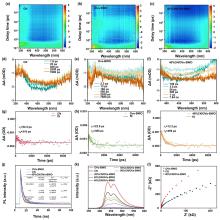
Figure 5.
The pseudocolor plots of (a) CN, (b) Ovs-BWO and (c) 40%CN/OVs-BWO. Transient absorption spectra (d) CN, (e) Ovs-BWO and (f) 40%CN/OVs-BWO.The corresponding fs-TAS decay curves (at 500 nm) for (g) CN, (h) Ovs-BWO and (i) 40%CN/OVs-BWO photocatalysts. (j) Time-resolved PL spectra of theindividual photocatalysts. (k) PL spectra of CN, OVs-BWO and CN/OVs-BWO loaded with different CN contents. (l) EIS Nyquist plots of CN, OVs-BWO and 40%CN/OVs-BWO.
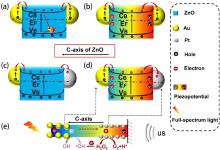
Fig. 12.
Mechanism of the enhanced catalytic performance via piezo-phototronic effect and the unique structure under ultrasonic wave and light irradiation (C
B
and V
B
, the conduction band and valence band of ZnO, respectively; E
F
, energy of the Fermi level). (a) AZA under light irradiation. (b) AZA under concurrent ultrasonic wave and light irradiation. (c) AZP under light irradiation. (d) and (e) AZP under concurrent ultrasonic wave and light irradiation. AZA, Au/ZnO/Au; AZP, Au/ZnO/Pt. Reproduced from ref. [
185
] (Copyright 2022, Elsevier Ltd.).
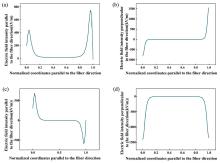
Fig. 9.
(a) Electric field intensity parallel to the fiber direction for D33-Type FPC; (b) Electric field intensity perpendicular to the fiber direction for D33-Type FPC; (c) Electric field intensity parallel to the fiber direction for D31-Type FPC; (d) Electric field intensity perpendicular to the fiber direction for D31-Type FPC.
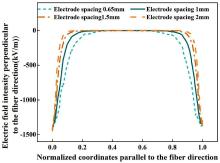
Fig. 15.
Effect of electrode spacing on the electric field distribution perpendicular to the fiber direction for D31-FPC.
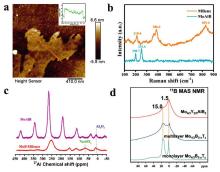
Fig. 4.
(a) AFM image of MoB MBenes, (b) Raman spectra (c)
27
Al
solid-state NMR (d)
11
B
solid-state spectra NMR of MAB phase and corresponding MoB MBenes.
Reproduced with permission from Ref [
45
,
51
] Copyright 2022 Elsevier, 2025 Royal Society of Chemistry, respectively.
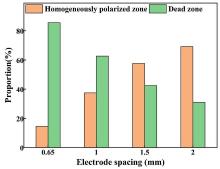
Fig. 16.
Effect of electrode spacing on the electric field distribution region for D31-FPC.
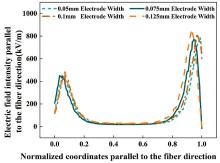
Fig. 17.
Effect of electrode width on the electric field intensity parallel to the fiber direction for D33-Type FPC.
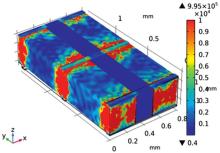
Fig. 19.
Stress distribution of the RVE model of D33-FPC under 400 V voltage.
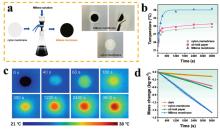
Fig. 11.
(a) Schematic illustration and photographs of MBene membrane and nylon membrane. (b) The temporal variation of the surface temperature, (c) Infrared thermal figures of MBene membrane, (d) The temporal variation of water mass change of the three evaporation models under 1 sun irradiation.
Reproduced with permission from Ref. [
107
] Copyright 2024 Elsevier.
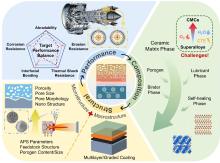
Fig. 2.
A review of composition and structural design strategies for ceramic-based ASCs.
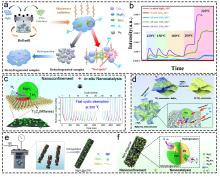
Fig. 11
Corresponding information and presentation of different catalysts on hydrogen storage of MgH
2
and MgH
2
-based composites. (a, b) MgH
2
-TiO
2
. Reproduced with permission [190]. Copyright 2022, Elsevier. (c) MgH
2
@Ti-MX. Reproduced with permission [40]. Copyright 2021, American Chemical Society. (d) MgH
2
/TiO
2
. Reproduced with permission [93]. Copyright 2022, Springer. (e, f) MgH
2
@pCNF. Reproduced with permission [192]. Copyright 2022, Elsevier.
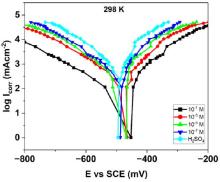
Fig. 7.
Cathodic and anodic polarization run via PDP studies for various concentrations of H
2
SO
4
in the presence and absence of NNDBA at 298 K.
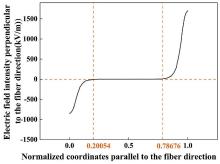
Fig. 10.
Distribution of the electric field component perpendicular to the fiber direction between electrodes for D33-type FPC (the horizontal axis representing the normalized coordinate parallel to the electric field direction, i.e., the ratio of the distance from the observation point to the electrode centerline to the electrode spacing).
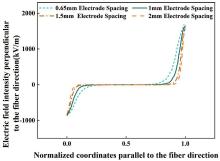
Fig. 11.
Effect of electrode spacing on the electric field intensity perpendicular to the fiber direction for D33-FPC.
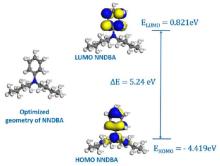
Fig. 13.
Optimized geometry of NNDBA with HOMO and LUMO distributions and their corresponding energy levels.
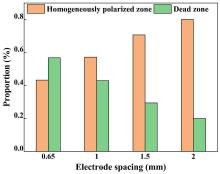
Fig. 12.
Effect of electrode spacing on the electric field distribution region for D33-FPC.
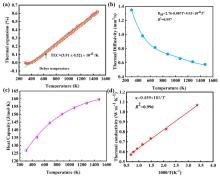
Fig. 4.
Temperature dependent (a) thermal expansion coefficient, (b) thermal diffusivity, (c) heat capacity, and (d) thermal conductivity of CrTa
0.5
Nb
0.5
O
4
.
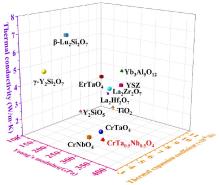
Fig. 9.
Comparison of thermal conductivity, TEC and Young's modulus of CrTa
0.5
Nb
0.5
O
4
with those of typical TBCs materials.
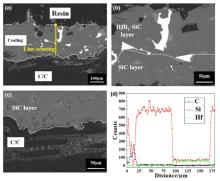
Fig. 3.
(a) Backscattering cross-section micrographs of coated C/C composites; High-magnification backscattered electron micrograph of the (b) coating and (c) interface between the
C/C
composite and the internal SiC layer; (d) Energy dispersive spectroscopy elemental line analysis of the coating in (a), with the yellow arrow representing the scanning direction. Reproduced with permission from Ref. [
33
], © Wiley-Blackwell 2014.
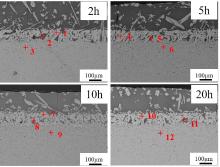
Fig. 9
Cross-sectional microstructures of the molten CMAS corrosion of (5RE
0.2
)
2
Si
2
O
7
pellets for different times at 1500 °C.
page
Page 1 of 29
Total 574 records
First page
Prev page
Next page
Last page