

1. Introduction
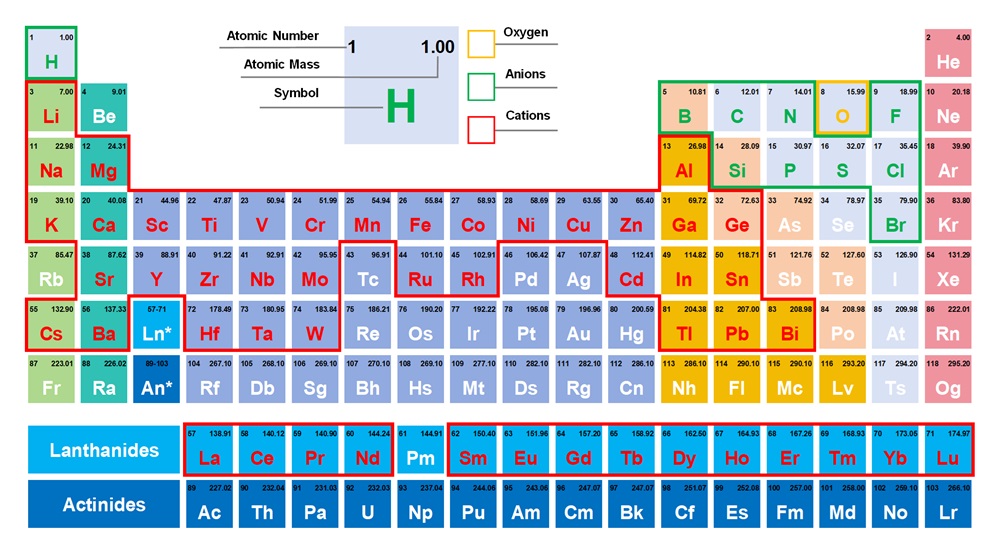
In 2015, Rost et al. [1] first reported a five-component oxide with a single-phase rock-salt structure but featuring configurational disorder among distinct constituent cations. Since then, High-entropy ceramics (HECs) have emerged as a significant research frontier in materials science, driven by their extraordinary structural stability and exceptional tunable properties [2]. The intrinsic stability of HECs establishes a solid foundation for their vast potential, especially for applications in extreme environments characterized by high temperatures [3], prolonged durations [4], severe corrosion [5], and heavy irradiation [6]. As illustrated in Fig. 1(a), the Periodic Table highlights all the constituent elements reported in HECs to date. Intensive investigations have been made to explore oxides including both simple oxides with rock-salt, fluorite, and bixbyite structures and complex oxides with spinel, perovskite, and pyrochlore structure. Furthermore, research has expanded to a diverse range of non-oxides such as carbides, borides, nitrides, silicides, fluorides, and hydrides. Concurrently, considerable attention has been focused on unraveling the fundamental stability mechanisms and developing data-driven design strategies for novel HECs [7-10].
Unlike conventional ceramics, which are predominantly composed of one or two principal elements, HECs typically incorporate at least five principal elements, which greatly facilitates materials design via compositional modulation. Thus, following the inception of entropy-stabilized oxides, research on HECs has rapidly expanded from the exploration of new HEC members to the optimization of properties and performance. The majority of current studies have demonstrated that the high-entropy compositional design can effectively improve the mechanical and thermal properties [11-15], catalytic activity [16-22], battery capacity and ion conductivity [23-27], microwave absorption [28-31], as well as electronic [32,33], magnetic [34,35], and dielectric [36,37] behaviors. Evidently, the compositional versatility of HECs unlocks their unprecedented opportunities for engineering multifunctional properties.
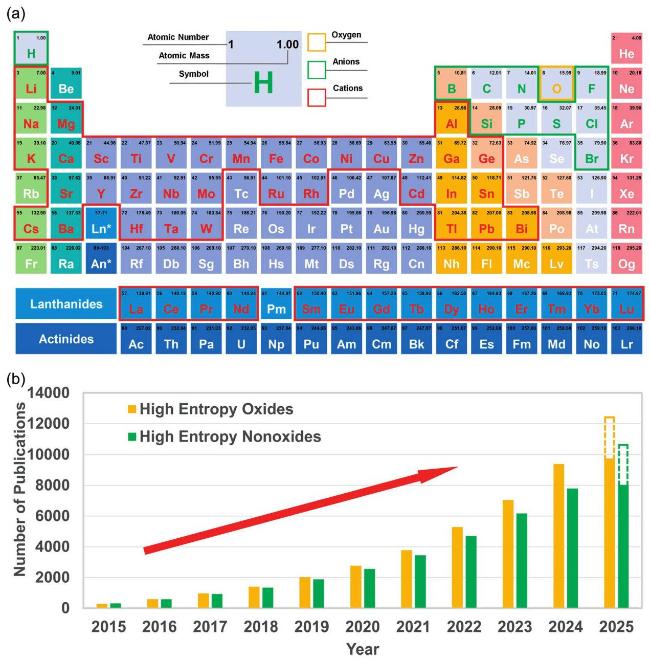
Fig. 1. (a) All the constituent elements reported in HECs to date. (b) Total number of publications on major HECs over the last decade. Data was retrieved from Web of Science on February 28, 2025, using keywords: "high-entropy", "oxide", "boride", "carbide", "nitride", "silicide", "fluoride", "hydride", "phosphide", "sulfide", and "ceramics". |
To date, several comprehensive reviews have summarized the early progress on HECs [2,38-40], while others have focused on specific materials or applications [41-46]. According to the Web of Science database, the number of publications on HECs has experienced a substantial increase (Fig. 1(b)). Given the rapidly growing body of literature, this review aims to systematically present the recent advances with emphasis on theoretical design strategies, structural and compositional characteristics, and the most critical properties. Section 2 will briefly introduce the basic concepts of HECs and discuss the four core effects. Section 3 will focus on the design strategies of HECs, highlighting the integration of theoretical calculations and intelligent techniques. Section 4 will provide an overview of existing material systems, categorized into oxides and non-oxides. Section 5 will explore the properties and applications of HECs, covering mechanical, thermal, electrical, catalytic, magnetic and dielectric performance. Finally, the conclusions and future prospectives on HECs are presented.
2. Concept and features
The concept of HECs originated from the pioneering work on highentropy alloys (HEAs) by Yeh et al. [47] and Cantor et al. [48] in 2004. Challenging conventional alloy design paradigms, HEA are defined as solid solution alloys containing at least five principal elements, each with concentrations ranging from 5at.% to 35at.%. According to the thermodynamic relationship
G=H-TS
an increase in entropy S leads to a decrease in Gibbs free energy G, thereby enhancing phase stability (where T is temperature and H is enthalpy). Considering statistical thermodynamics, entropy S can be also be expressed as:
in which kB is Boltzmann's constant and pi is the probability of the i th state in the system. Similarly, for a n-component solid solution with ideally chemical disorder, the configurational entropy is given by:
Here, R is the ideal gas constant, ci is atomic fraction of the i th component. Specifically, the values of Sconf are 1.4R, 1.6R and 1.8R for four-, five- and six-element equiatomic solid solutions, respectively. In most cases, alloys with a configurational entropy higher than 1.5R are classified as high-entropy alloys.
However, most ceramics exhibit more complex crystal structures compared to metals and alloys, which typically crystallize in simple face-centered cubic (FCC), body-centered cubic (BCC), or hexagonal close-packed (HCP) structures. Therefore, when extending the concept to HECs, the first challenge to address is the significantly different Wyckoff positions of cations. The configurational entropy of HECs should be calculated regarding to Wyckoff positions rather than element concentrations. A simplified expression can be given by:
Table 1 Parameters and Descriptors Related to Theoretical Design. |
| Symbol | Name | Definitional Formula | Physical Meaning | Ref |
|---|---|---|---|---|
| | Mixing Entropy | | Enthalpy change of a system when different components are mixed to form a homogeneous system. | [71] |
| | Mixing Enthalpy | | The sum of the interaction energy differences in the ideal state. | [72] |
| | Entropy-Enthalpy Balance Factor | | Tm is the isothermal temperature. | [73] |
| | Atomic (ion) Radius Difference | | Contribution of differences in atomic/ionic radii of components to lattice distortion | [74] |
| | Electronegativity Difference | | | [75] |
| VEC | Valence Electron Concentration | | Reflects the degree of electron filling and energy band structure characteristics of the system | [74] |
| DEED | Disordered Enthalpy-Entropy Descriptor | | Predicting the possibility of single-phase disordered structures in multicomponent systems, Hf and Hhull are the DFT formation energies of the partial occupation POCC tiles and the convex hull, respectively. | [76] |
| EFA | Entropy Forming Ability | | Entropy-driven formation of stable single-phase solid solutions, where n is the total number of sampled geometrical configurations and gi are their degeneracies. Hi of the sampled configurations. | [66] |
| LDI | Lattice Distortion Index | | Parameters for the degree of lattice distortion in disordered systems, ( x,y,z ) is the atomic position. | [77] |
| | The normalized geometric packing parameter for the metallic sublattice calculated | | Evaluating how different metal atoms stack together in a crystal lattice, where rS and rL are the radii of the smallest and largest atoms. | [78] |
in which xj represents the fraction of the j th Wyckoff position in the unit cell, and cij denotes the fraction of the i th component among all atoms occupying the j th Wyckoff position [7]. Here we take a binary oxide ${\mathrm{A}}_{m}^{1}{\text{ }\mathrm{A}}_{n}^{2}{\mathrm{O}}_{q}$ as an example, in which A1 and A2 refer to the same element A with different Wyckoff positions. If A1 and A2 positions are occupied respectively by three and five different elements randomly, i.e. $\left[{\left({\mathrm{A}}^{1}{\text{ }\mathrm{B}}^{1}{\mathrm{C}}^{1}\right)}_{m}{\left({\text{ }\mathrm{A}}^{2}{\text{ }\mathrm{B}}^{2}{\mathrm{C}}^{2}{\mathrm{D}}^{2}{\mathrm{E}}^{2}\right)}_{n}{\mathrm{O}}_{q}\right.$ , the quantities in the equation of configuration entropy can be written as x1=m/(m+n+q),x2=n/(m+n+q),c11=c21=c31=1/3,c12=c22=c32=c42=c52=1/5. Naturally, ceramic materials are more likely to exhibit higher configurational entropy due to the presence of multiple Wyckoff positions and sublattices. Consequently, the initial criterion of HECs has broadened to include at least four host elements, which may exhibit near-equimolar or non-equimolar compositions, occupying one or more Wyckoff positions.
Although extensive literature has reviewed the four core effects of high-entropy materials, we will briefly revisit them here for context. As summarized by Yeh et al. [50], the four core effects for HEAs are highentropy, severe-lattice-distortion, sluggish-diffusion and cocktail effects, which are associated with the four important aspects: thermodynamics, structure, kinetics and performance. Above all, the highentropy effect serves as the foundational concept in HECs and other high-entropy materials. The highly disordered elemental distribution significantly increases the configurational entropy, possibly resulting in the enhanced thermodynamic stability [6]. Meanwhile, intrinsic lattice distortions can improve the strain accommodation capabilities, further improving mechanical properties such as fracture toughness [51]. Also, severe lattice distortions act as stronger phonon scattering centers, accompanied by enhanced anharmonicity and thermal insulation performance [52]. Next, the sluggish diffusion effect, closely related to kinetic behaviors, contributes most to excellent chemical stability, corrosion resistance [53], and oxidation resistance [54]. After that, the cocktail effect breaks free from the limitations of fixed elements in traditional ceramics, thus enabling superior comprehensive performance [32] through the introduction of appropriate constituent compositions. Additionally, these effects cause the reorganization and redistribution of chemical bonds and valence electrons, which frequently endow HECs with distinctive electronic [55], magnetic [56] and dielectric [57] properties. The following sections may offer a state-of-the-art understanding of these four effects and their implications for the design and performance of HECs.
3. Theoretical design
High-entropy ceramics, characterized by their complex multi-element compositions and distinctive structural configurations, provided a versatile platform for engineering advanced ceramic materials with tailored functionalities. However, the intricate compositional diversity and vast phase space inherent to HECs pose significant challenges for conventional experimental approaches, limiting their efficiency in systematic exploration. Computational modeling and theoretical simulations thus emerge as effective tools for predicting synthesizability, elucidating structure-property relationships, and guiding the rational design of HECs for accelerated discovery of high-performance candidates.
3.1. Stability and synthesizability
The application of descriptors has emerged as a critical paradigm for predicting phase stability in materials, substantially reducing the experimental and computational overhead associated with assessing HECs. As listed in Table 1, a variety of physical quantities have been used to predicted the stability and synthesizability of high-entropy ceramics, which can be roughly categorized into structural [58], compositional [59-61], thermodynamic [62,63], and statistical parameters [64,65]. Among these, conventional parameters such as atomic size difference $\delta $ , mixing enthalpy Hmix , and electronegativity difference $\mathrm{\Delta }\chi $ were originally developed for solid solutions and phase diagram studies, and have been directly adapted for HECs with minor modifications. While these metrics benefit from straightforward calculation and established physical interpretations, they often fail to fully capture the unique characteristics of high-entropy systems, particularly the complex multi-element interactions and entropy-dominated stabilization mechanisms. Thus, the covariates derived from several parameters shows higher accuracy and reliability in predicting synthesis feasibility and performance [66].
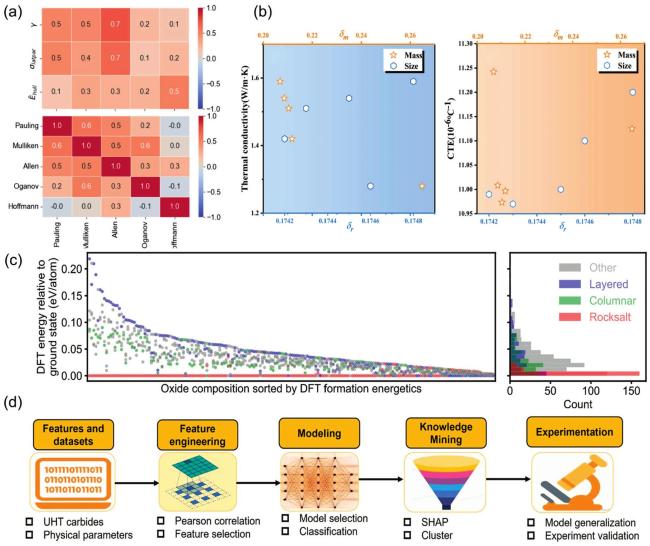
Fig. 2. (a) Pairwise correlations of computational parameters: atomic radius deviations, lattice parameters, stabilization factors for miscible binary carbides, and electrochemical factors on different scales (top); correlations between different electronegativity scales (bottom). Reproduced from Ref [64]. Copyright Elsevier 2024. (b) Atomic size difference and atomic mass difference vs. thermal conductivity (left) and thermal expansion coefficient (right) at |
Moreover, newly developed descriptors are introduced to facilitate quantitative comparisons of stability and synthesizability across highentropy ceramic systems. Divilov et al. [10] proposed a disordered enthalpy-entropy descriptor (DEED) for balancing entropy gain and enthalpy cost to accurately classify the "functional synthesizability" (a function of the chosen synthesis process) of multicomponent ceramics regardless of their inherent synthesizability such as chemical composition or structure. DEED was demonstrated to be a reliable tool for the computational discovery of novel HECs. Sidnov et al. [64] employed empirical descriptors and entropy forming ability (EFA) to quantify the alignment of theoretical and experimental phase stability. The results show that descriptors related to local distortion play an important role in determining the phase stability of HECs (Fig. 2(a)). Meanwhile, Hou
et al. [67] used EFA to relate the thermal insulation properties to atomic size and mass differences to rationalize the composition of highentropy fluorite oxides (Fig. 2(b)). Further advancing this field, Peng et al. [60] established a physics-inspired descriptor based on firstness principle for predicting the degree of cation ordering in multicomponent perovskite oxides and verified that it has up to 93% accurate ordering rate in 190 experimental samples, which significantly improves the prediction of experimental ordering by machine learning and theoretical models. (Fig. 2(c)).
et al. [67] used EFA to relate the thermal insulation properties to atomic size and mass differences to rationalize the composition of highentropy fluorite oxides (Fig. 2(b)). Further advancing this field, Peng et al. [60] established a physics-inspired descriptor based on firstness principle for predicting the degree of cation ordering in multicomponent perovskite oxides and verified that it has up to 93% accurate ordering rate in 190 experimental samples, which significantly improves the prediction of experimental ordering by machine learning and theoretical models. (Fig. 2(c)).
With the expansion of the elemental composition space of HECs, the strategy of using descriptors to predict the synthesizability becomes increasingly difficult. Meanwhile, the rapid advancement of machine learning (ML) technologies emerged as a powerful solution to this challenge. The conventional workflow of machine learning processes is schematically illustrated in Fig. 2(d). Guo et al. [68] constructed an efficient ML model for HEC prediction based on retrievable low-cost physicochemical parameters, through which they explicitly proposed compositional threshold conditions for HEC synthesis. Meng et al. [63] combined high-throughput synthesis and computation with machine learning to optimize 22 obtained formation capacity descriptors, ultimately identifying eight optimal descriptors to predict HEC formation. This ML-driven descriptor optimization framework has been further extended to predict the formation capabilities of high-entropy rareearth monosilicates and borides [9,69], demonstrating broad applicability across diverse material systems.
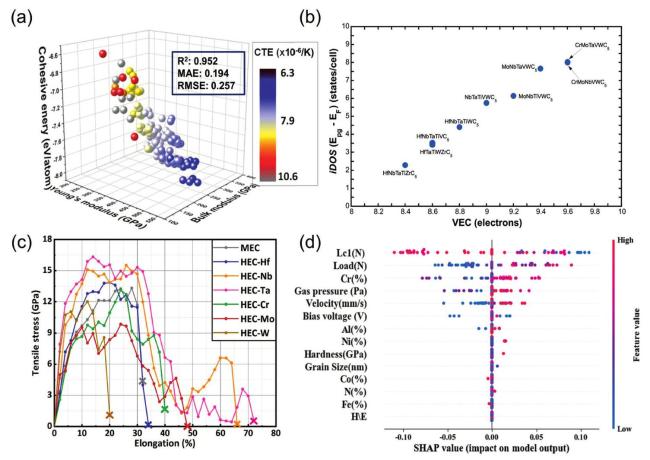
Fig. 3. (a) The 3D plots of the NET (neural network) training set were generated based on three parameters (bulk modulus, Young's modulus, and cohesive energy). Reproduced from Ref [79]. Copyright Elsevier 2024. (b) A plot of (iDOS( Epg,EF )) vs. VEC composed of nine solid solution high-entropy carbides shows that iDOS increases linearly along with VEC, and Pearson's correlation coefficient was 0.99. Reproduced from Ref [82]. Copyright Elsevier 2024. (c) The stress-strain curves from the AIMD (Ab Initio Molecular Dynamics) tensile simulations of MEC and HEC. Reproduced from Ref [77]. Copyright Elsevier 2024. (d) SHAP (Shapley Additive exPlanations) visualization features importance ranking. Reproduced from Ref [84]. Copyright Elsevier 2024. |
In recent years, machine learning has been the focus of research, and its models and algorithms have been continuously optimized and innovated, which has injected new impetus for the application of machine learning in accelerating the prediction of high-entropy ceramic synthesis. Notably, Vazquez et al. [70] achieved excellent performance in volume and energy prediction using a graph neural network (GNN) model based on the M3GNet network. The method effectively reduces the computational burden of fitting parameters and addresses the challenges faced by cluster expansion (CE) methods in multicomponent systems. The method's robustness was further validated through rigorous testing on two distinct high-entropy diboride systems. Mitra et al. [58] constructed a semi-synthetic database of high-entropy carbides using literature data, atomic environment mapping-based structure diagrams, and adaptive synthetic (ADASYN) sampling techniques. The ADASYN-assisted data balancing method significantly enhanced the predictive performance of the ML, particularly in forecasting the singlephase formability of novel carbides.
3.2. Properties prediction
Driven by the outstanding thermodynamic stability and chemical durability of high-entropy ceramics, recent research has focused on predicting their thermal behavior and stability through theoretical modeling and machine learning. This section summarizes representative studies that utilize data-driven and first-principles methods to explore thermodynamic parameters, mechanical performance, defect chemistry, and catalytic activity of HECs, thereby offering fundamental theoretical guidance for the rational design of advanced high-entropy materials.
Benefiting from the excellent performance of high-entropy ceramics in terms of thermodynamic properties and chemical stability, the research focuses on the performance prediction of their thermodynamic behavior and chemical stability. Kim et al. [79] predicted the coefficient of thermal expansion (CTE) of HEC by ML and highthroughput screening based on a dataset of thermodynamic, elastic, and thermophysical parameters of (TiTaXYZ)C (X,Y=V,Zr,Nb,Mo, Hf, and W;Z= other transition metals). It has been shown that materials with high bulk modulus and Young's modulus typically exhibit low coefficients of thermal expansion, while low CTE materials can be further engineered by selecting materials with lower cohesive energy (Fig. 3(a)). Yao et al. [80] constructed a prediction model based on thermal conductivity data of RE2Zr2O7 ceramics, combining ML and feature engineering. It is proposed that the CTE of RE2Zr2O7 ceramics can be reduced by adding more atomic species and decreasing the mean weighted atomic molar volume at the RE sites. Building upon these findings in oxide ceramics, similar thermodynamic optimization strategies have been successfully extended to more complex garnet systems. Hao et al. [81] combined DFT and combinatorial chemistry methods to design a high-entropy RE3Al5O12 series of rare-earth aluminum garnets with excellent phase stability, desirable thermal expansion coefficients, low lattice thermal conductivity, and superior mechanical properties. In particular, the high-entropy alumina garnet (YGdErYb)3Al5O12 exhibits significant performance advantages, with a remarkable reduction in lattice thermal conductivity compared to the single composition while maintaining a favorable range of CTE values.
The mechanical performance optimization of HECs increasingly relies on a tripartite methodology combining ab initio calculations, experimental synthesis, and data-driven modeling, as exemplified by the following studies: Vecchio et al. [82] studied the mechanical properties of a series of high-entropy carbides by ab initio calculations and experimental validation and proposed the VEC and the integral density of states (iDOS) from the pseudogap energy ( Epg ) up to the Fermi energy ( EF ) level (iDOS( Epg,EF )) for elucidating the relationship between the mechanical parameters and the electronic structure (Fig. 3(b)). Ouyang et al. [77] projected the formability and mechanical properties of six high-entropy carbides derived from (TiZrV)C. All five except (WTiZrV)C can be produced, of which (NbTiZrV)C has a low density and excellent mechanical properties. Atomic force simulations further revealed their good high-temperature strength and toughness, and they used four processes to explain this excellent performance at high temperatures: (1) elastic deformation, (2) bond breaks in scattered area, (3) bond breaks at centralized area, and (4) fracture (Fig. 3(c)). Chunghee Nam [83] developed a deep learning model using convolutional neural networks (CNN) that can predict the corresponding mechanical properties only based on the constituent elements. Compared to previous XGBoost (Extreme Gradient Boosting) and artificial neural network models, CNN exhibited the best performance in terms of determination coefficients and root-mean-square error. Jia et al. [84] obtained 53 groups of coefficient of friction (COF) data experimentally and combined them with the coating deposition process, microstructural features, and mechanical properties as input features for ML analysis. It was shown that load, Lc1 (critical load), Velocity, and Cr content had the most significant effect on the COF of the coating (Fig. 3(d)).
Unlike thermodynamics, which focuses on entropy and descriptors, theoretical studies of the performance of HECs as catalysts have focused on single-element effects and synergistic effects between multiple elements. Jacqueline et al. [85] combined first-principles calculations with experimental studies to evaluate the effect of each element in TiZrHfNbTaO11 on the water-splitting performance. The results show that Hf and Zr with low electronegativity provide the strongest adsorption energy for water and become the main active sites for water adsorption, while the cations Nb and Ta with high electronegativity effectively improve the water decomposition efficiency by enhancing the transfer of electrons to water molecules.
Defect structure is often one of the most critical research directions when interpreting and predicting the effect of structure on properties. The lattice distortion and hysteretic diffusion effects induced by highentropy structures add complexity and uncertainty to the defect study of HECs, and these factors profoundly affect the material properties. Meanwhile, as a multi-element doped ceramic system, HECs with a rich variety of elements also provide a broad space for the theoretical study of defect properties.
The first thing to focus on is the behavior of point defects, the most prominent of which are anionic vacancies. Ouyang et al. [86] investigated the Anion Vacancy Filling (AVF) principle during the formative process of (TiVNbTaW) Cx high-entropy carbide powders by first-principles calculations and the thermodynamic phase diagram analysis. The results show that the rock-salt carbide matrix is formed first and occupies the vacancies until equilibrium by residual carbon material (Fig. 4(a)). Zhao et al. [87] investigated the formation of 1280 carbon vacancies in high-entropy carbides by high-throughput computing and ML. The results show that most of the carbon vacancies are favorably surrounded by three different cations, and the carbon vacancy concentration can be regulated by adjusting the cation proportion. Li et al. [88] studied the process of irradiation-induced defect build-up and evolution in HEC and found that the disorder of transition metals in the cationic sublattice had a small effect on the defect evolution; however, the defect recovery was significantly improved by the formation of carbon-nitrogen disordered structures in the anionic sublattice.
In addition to point defects, the interfacial behavior of crystals usually has a significant effect on their mechanical properties. Li et al. [89] investigated the influence of metal-atom ratio and distribution on the mechanical behavior by first-principles calculations. The results show that the yield shear strengths (YSSs) of $\left({\mathrm{H}\mathrm{f}\mathrm{T}\mathrm{i}\mathrm{Z}\mathrm{r}}_{1-x}(\mathrm{N}\mathrm{b}\mathrm{T}\mathrm{a}{)}_{x}\mathrm{C}\right.$ is affected by the strength of the metal-C bond at the slip surface, and the slip surface position is determined by the unstable stacking fault energy. Therefore, it is possible to tune the slip behavior and mechanical performance by modifying the metal proportions and distributions (Fig. 4(b)). In addition, they investigated the shear deformation of {210}/[001] grain boundaries (GB) and the intrinsic properties and mechanical response of their binary carbides in (HfNbTaTiZr)C [90]. Grain boundary migration occurs in group VB carbides and is inhibited by C-C bonds in group IVB carbides. The grain boundaries not only affect the mechanical properties of HECs but also play an important role in the migration of their anions. Ren et al. [91] analyzed the oxygen ion transport mechanism of high-entropy rare-earth tantalates by molecular dynamics and first principles. The results show that oxygen ions are trapped in the potential well at the Ta-Ta edge and are hindered by the high electrostatic potential around the oxygen vacancies and diffusion between the rare-earth elements (Fig. 4(c)). Liu et al. [92] examined the initial oxidation mechanism of ( ZrTiNbTa ) B2 high-entropy diboride ( HEB2-1 ). Results showed that the dissociative adsorption process of oxygen molecules on the ${\mathrm{H}\mathrm{E}\mathrm{B}}_{2}-1-\left(11\overline{2}0\right)$ surface occurs spontaneously, and each oxygen atom is stably adsorbed at the optimal neutral site after the O-O bond is broken.
This section systematically explores the theoretical design methods of HECs, focusing on the application of traditional theoretical calculations and machine learning in predicting the synthesis feasibility and performance characteristics, which provides basic theoretical insights for material design. Next, Section 4 will further systematize the compositional classification of HECs and comprehensively show their diversity and potential applications in materials science from different high-entropy ceramic systems.
4. Structures and compositions
4.1. High-entropy simple oxides
For high-entropy oxides, based on the type of non-oxygen sublattices, they can be classified into two categories [93]: simple oxides contain only a single cation sublattice (a single cation occupying a single Wyckoff site), and typical structures include rock-salt, fluorite, and rutile structures (with a single cation occupying two Wyckoff sites); complex oxides contain multiple independent sublattices (different caitons occupying two or more Wyckoff sites), covering spinel, pyrochlore, and perovskite configurations. The crystal structures of the most investigated high-entropy oxides are compared in Fig. 5.
High-entropy simple oxides have become a hot research topic in the field of materials due to their unique compositional complexity and excellent properties. Through multifaceted synthesis methods (e.g., pulsed laser deposition, solid-phase reaction, and spark plasma sintering), different combinations of metal elements (e.g., transition metals, rare earths, etc.) can be modulated to form specific crystal structures (rock salt, cubic fluorite, bixbyite, etc.), thus conferring multifunctional properties to the materials. See Table 2 for details.
Classical rock-salt high-entropy oxides are characterized by the random occupation of a single sublattice, e.g., the cations in the (MgCoNiCuZn)O system are uniformly distributed in the Wyckoff 4a site, and the entropy-dominated solid-phase transition confirms their randomly distributed thermodynamic stability [1]. However, recent studies have deepened the understanding of cation contributions to entropy by decoupling cation sites from species selection. For example, by removing each cation from the five-membered system, it was found that Mg2+ and Ni2+ significantly enhance the structural stability of bulk-phase rock-salts by decreasing the lattice distortion, whereas the stabilizing effect of Co2+ is modulated by the synthesis conditions (Fig. 6(a, b)), revealing the effect of the oxidation state of the cation and the coordination preference on the occupation of the Wyckoff sites [94]. Furthermore, Pu et al. [101] broke through the limitations of traditional solid-phase synthesis by using oxalate precursor coordination polymerization to achieve controlled preparation of submicronsized single-crystal HEO rods and optimized the uniformity of cation distribution by precursor premixing so that single-phase structures could be obtained by short annealing. At the same time, rock-salt HEOs have been expanded to the field of layer structure thin film above five elements, Li(CrMnFeCoNiCu)O2 epitaxial thin film is prepared by pulsed laser deposition technology [95], and the high entropy solid solution of the six transition metals at the 4a position not only realizes the single-phase stabilization but also confers the stable cycling situation of the anode in the thin film battery (Fig. 6(c)).
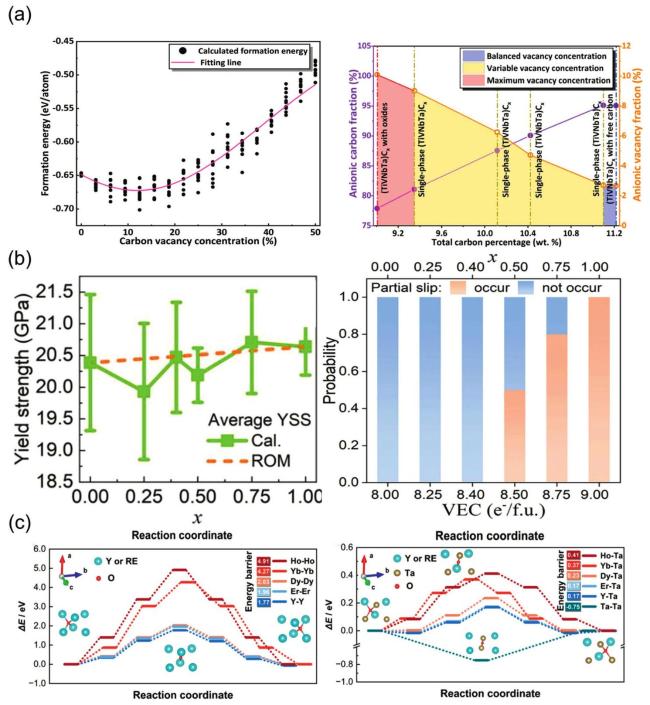
Fig. 4. (a) The fitting formation energy curve of (TiVNbTa)Cx with variation of anionic vacancy concentration; Curves of anionic carbon and vacancy fraction under changing carbon content. Reproduced from Ref [86]. Copyright Elsevier 2024. (b) Average YSSs and ROM (rule of mixture) predictions for (HfTiZr) |
In fluorite-type oxides, CeO2 serves as a prominent representative, where Ce atoms form a face-centered cubic array occupying the 4 a Wyckoff position of the $\mathrm{F}\mathrm{m}\overline{3}\text{ }\mathrm{m}$ space group, while oxygen anions fill the eight tetrahedral 8c sites [107]. Classical systems such as (CeRE) ${\mathrm{O}}_{2-\delta }$ form fluorite single-phase structures by equimolar solid solution, but the phase stability relies on the rigid sublattice anchoring of Ce4+ rather than an entropy-dominated mechanism [38]. For example, singlephase stabilization is achieved by equimolar doping with 3-7 rare earth elements (e.g., Ce, Pr, etc.), where the mixed valence states of Ce4+ and Pr3+/4+ not only inhibit the phase separation but also reduce the direct bandgap to 1.95-2.14eV by an oxygen vacancy concentration [108]. Notably, the multivalent state of Pr is shown to be a key factor in the band gap reduction, while the thermodynamic stability stems from the anchoring effect of the high oxidation state of Ce4+ on the cationic sublattice. New research drives performance breakthroughs through innovative design of Wyckoff site cationic species. For example, the introduction of Gd3+ in the ( YZrHfCeGd ) ${\mathrm{O}}_{2-\delta }$ results in a significantly lower thermal conductivity ( 1.68 W/(m⋅K) ) than that of Yttria-Stabilized Zirconia (YSZ) (Fig. 6(d)), and the mechanism is attributed to the substitution of the matrix ions by Gd3+ caused by the non-simple harmonic effect on the scattering of phonons, while the elevated oxygen vacancy concentration enhances the oxygen barrier performance [97]. In the (CeZrLaSmNdY)O, the addition of Y3+ induces a "cocktail effect" by increasing the configurational entropy, resulting in a Vickers hardness of 16.32 GPa, a 25% increase over the five-element system, which arises from the increase in the configurational entropy and the reinforcement of grain boundaries caused by the Y-O bonds. An even more remarkable breakthrough is evident in the ultrahigh-site occupancy design: the first ordered-disordered coexistence of 13 cations in a single sublattice is realized for the RE2M2O7 ( RE are 13 different lanthanides, M=Zr, Hf, Ti, Sn, Ce, and Pr ) [99], A single fluorite phase is present only when M is Ce or Pr, otherwise the phase is pyrochlore or pyrochlore-fluorite mixture (Fig. 6(e)).
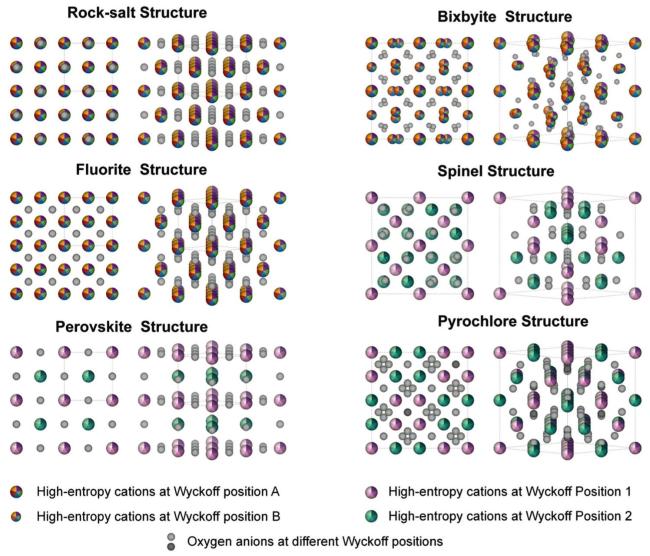
Fig. 5. Typical crystal structures of high-entropy ceramics. Here, two color schemes are used to clarify the difference between simple and complex oxides, and 2×2×2 supercells for the three crystal structures at left side for better comparison. |
Table 2 Synthesis methods for high-entropy simple oxides corresponding product features. |
| Composition | Preparation | Feature | Ref. |
|---|---|---|---|
| (MgCoNiCuZn)O | Pulsed Laser Deposition (PLD) | structural stability of rock-salt modulated by Mg, Ni, Co | [94] |
| Li(CrMnFeCoNiCu)O2 | single-phase layered rock-salt oxide films | [95] | |
| | Solid-state reaction | [96] | |
| | single-phase cubic fluorite structure uniformly distributed fluorite structure with good force thermal stability | [97] | |
| (ZrHfTiSn)O2 | Solid phase sintering | highly resistant to irradiation | [98] |
| RE2 A2O7(RE=[La,Sm,Nd,Gd,Dy,Yb,Y,Er,Eu, Tb, Ho, Lu, Tm], | RE2Ce2O7 and RE2Pr2O7 exhibit a single fluorite structure | [99] | |
| | uniform fluorite structure | [100] | |
| (CuCoNiZnMg)O | Coordination Polymerization Solid Dispersant-Assisted Annealing | single-crystalline HEO rods with uniform dispersion | [101] |
| (BiZrMoWCeLa)O2 | Surfactantassisted hydrothermal technique | high electrochemical efficiency | [102] |
| (YLaNdSmYbLuEuGdCe))2O3 | Co-precipitation method combined with conventional sintering | bixbyite structure with high oxygen barrier properties | [103] |
| | Solution combustion synthesis method combined with conventional sintering Spark Plasma Sintering (SPS) | with cubic bixbyite-structured, and better oxygen barrier properties. | [104] |
| | Mechanochemical ball milling and sol-gel | the highest properties in the sol-gel process, followed by that in wet milling and dry milling | [106] |
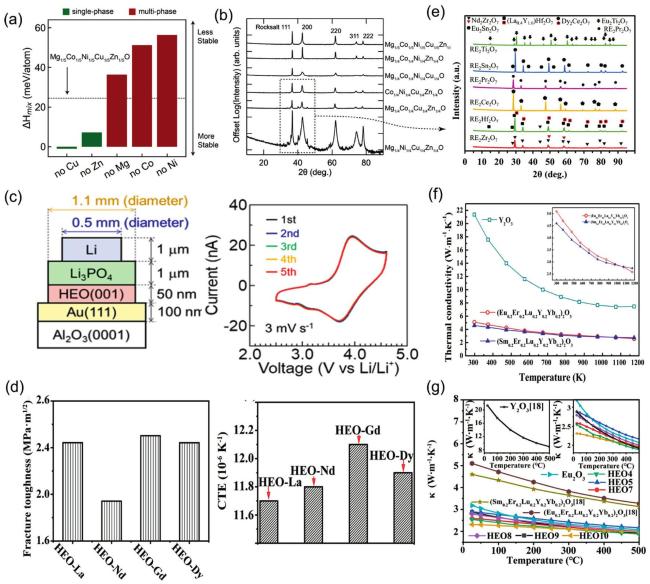
Fig. 6. (a) X-ray diffractograms of four-component derivatives of (MgCoNiCuZn)O as a substrate; (b) DFT analysis of four diffractive phase compositions by mixing enthalpy. Reproduced from Ref [94]. Copyright Elsevier 2024. (c) Side diagram of thin film battery with 50 nmLi(CrMnFeCoNiCu)2 (001) as positive electrode, and cyclic voltammogram. Reproduced from Ref [95]. Copyright American Chemical Society 2022. (d) CTE and Fracture toughness of HEO-La, Nd, Gd, Dy. Reproduced from Ref [97]. Copyright Elsevier 2024. (e) the XRD patterns of the samples. It can be seen that RE2Zr2O7 and RE2Hf2O7 failed to form single-phase high-entropy pyrochlore phase; RE2Ce2O7 and RE2Pr2O7HEOs, exhibited a single phase structure with a fluorite-type structure. Reproduced from Ref [99]. Copyright Elsevier 2025. (f) Calculation of thermal conductivity of (EuErLuYYb)2O3,(SmErLuYYb)2O3 and Y2O3. Reproduced from Ref [105]. Copyright Tsinghua University Press 2021. (g) Thermal conductivity |
Bixbyite-type HEOs are mainly found in the sesquioxides of rareearth elements, where cations partially occupy a face-centered cubic (FCC) lattice and oxygen ions fill the octahedral interstices in a slightly mismatched manner, forming a special "defective fluorite-type structure" [109]. In this structure, the rare-earth cation occupies sites 8b and 24d, respectively, and the oxygen anion occupies site 48e. Five-membered rare-earth solid solutions (EuErLuYYb) 2O3, which suppresses grain-boundary diffusion through high-entropy effects and reduces the thermal conductivity to 23.8% of that of Y2O3, but it is more brittle (Fig. 6(f)) [105]. Subsequently, the nine-cation system (YLaCeNdSmEuGdYbLu) 2O3 modulates the oxygen vacancy concentration and lattice strain through the introduction of Ce3+/Ce4+ mixed valence states, which further reduces the thermal conductivity to [103]. At the same time, ${\left(5{\mathrm{R}\mathrm{E}}_{0.2}\right)}_{2}{\mathrm{O}}_{3}(\mathrm{R}\mathrm{E}=\mathrm{C}\mathrm{e},\mathrm{N}\mathrm{d},\mathrm{S}\mathrm{m},\mathrm{E}\mathrm{u},\mathrm{G}\mathrm{d},\mathrm{D}\mathrm{y}\sim \mathrm{Y}\mathrm{b})$ has both ultra-low thermal conductivity $(1.88-2.55\text{ }\mathrm{W}/(\mathrm{m}\cdot \mathrm{K}\left)\right)$ , high fracture toughness ( 1.92MPa/m1/2 ) and excellent oxygen barrier properties, making it an ideal candidate for high-temperature thermal insulation and oxygen barrier coatings (Fig. 6(g)) [104].
4.2. High-entropy complex oxides
Since the successful synthesis of high-entropy complex oxides in 2018 [110], the study of HEOs has evolved from the early design of simple oxides based on a single wyckoff site to complex systems synergistically regulated by multiple sublattices. Through the high entropy effect of multiple metals (e.g., transition metals, rare earths, alkaline earths) at A/B sites, materials have realized a breakthrough in compositional flexibility and functional coupling. The high entropy complex oxides are endowed with broad potential in the fields of catalysis, dielectricity, and high temperature resistance. Meanwhile, novel synthesis techniques such as reactive flash burning and laser powder bed fusion further endow the materials with extreme environmental stability. See in Table 3.
Spinel-type oxides have the general formula AB2O4, where A is a divalent cation and B is a trivalent cation occupying the tetrahedral (8a) and octahedral (16d) Wyckoff sites, respectively [111]. High-entropy chemisorption induces lattice distortion via multi-element co-occupancy, enhancing structural stability and ion diffusion kinetics. For example, the classical high-entropy spinel material is (MgCoNiCuZn)3O4, which is an attractive choice of anode material for lithiumion batteries due to its excellent specific capacity and stability. Recent studies have shown that the addition of Li+can further improve the negative electrode cycling ability of (MgCoNiCuZn)3O4. For example, the chemical pre-lithiation strategy to construct a Li-rich layer on the surface of (MgCoNiCuZn)3O4 can increase the Coulomb efficiency to 97.5% and ensure the reversibility of the spinel structure through the dense LiF layer to achieve excellent cycling stability (Fig. 7(a)) [112]. The Li+-containing (FeCoMgCrLi)3O4, which utilizes Li+to occupy the 16d site to optimize the charge transport path, enhances the lithium storage capacity to 658mAh/g [113]. Furthermore, a cobalt-free design of (CrNiFeMnZn)3O4 has appeared, which utilizes a uniform cation distribution and 37% oxygen vacancy ratio to achieve a high reversible capacity of 530mAh/g and 99% cycling stability and is expected to break through the difficult problem of cobalt resource limitation [114].
The oxygen ion lattice of high-entropy garnet (HEG) RE3M5O12 can be regarded as an extension of spinel with a more complex arrangement, forming more types of interstitial sites (dodecahedral, 24c) for the RE cations to occupy, while M (e.g., Al, Fe) occupies the 8a & 24d sites. It has achieved impressive performance in the field of nuclear waste containment and dielectric materials due to its complex cationic occupancy and chemical stability. For example, the traditional garnet (Y1.2Nd1.8Fe5O12) through high entropy, (YGdSmEuDy)3Fe5O12 in the acidic environment of the elemental leaching rate is significantly reduced, the diffusion coefficient optimized over the traditional system by one order of magnitude, becoming an ideal substrate for curing of highlevel radioactive waste materials [130]. In addition, Fe2+-doped $(\mathrm{Y}\mathrm{E}\mathrm{u}\mathrm{E}\mathrm{r}\mathrm{D}\mathrm{y}\mathrm{L}\mathrm{u}{)}_{3}{\left({\mathrm{A}\mathrm{l}}_{x}{\mathrm{F}\mathrm{e}}_{1-x}\right)}_{5}{\mathrm{O}}_{12}$ produces a difference between the grain boundary activation energy and grain conductivity by modulating the Fe2+ occupancy ratio at the 8 a site, which enhances the dielectric constant to 2.78×10⁴(100 Hz) and synchronously enhances the magnetization strength [131].
High-entropy perovskite oxides are available in two formulations, (Sr/Ba)(M)O3 structures and (RE)(TM)O3 (M is metal, TM is transition metal, RE is rare-earth elements) [38]. Unlike spinel structures, where A/B sites are determined by cation valence, perovskite cation sublattices are governed by ionic radii, with A-site cations typically larger (such as rare-earth elements) and B-site cations smaller (such as transition metals) [132]. Crystallographic studies of high-entropy perovskite oxides focus on a strategy of synergistic multi-cation occupancy of the A,B & A/B sites of the Wyckoff site. The most common is a highly entropic design with a single sublattice, such as ( SrBaBiLaPr ) FeO3 which reduces the cathodic polarization resistance of the solid oxide fuel cell to $0.033\mathrm{\Omega }/{\mathrm{c}\mathrm{m}}^{2}$ through the disordered occupation of the quintuple A-site, while enhancing the CO2 tolerance [133]. In addition, the B-site high-entropy designed La(FeCuMnMgTi)O3 nanoparticles exhibited excellent benzyl alcohol conversion and benzaldehyde selectivity, and showed great stability in benzyl alcohol oxidation [124]. Meanwhile, the B-site disordered Ba(ZrTiSnHfTa)O3, has excellent stability, low thermal conductivity, and excellent mechanical properties (Fig. 7(b)) [117]. Single-site high entropy is susceptible to the Goldschmidt factor limitation, and recent studies have turned to trans-sublattice A/B site occupancy, e.g., La0.7Bi0.3Mn0.4Fe0.3Cu0.3O3 nanoparticles exhibiting a bi-ionic energy storage mechanism in aqueous alkaline high-power battery-supercapacitor hybrid devices [134].
Table 3 Synthesis methods for high-entropy complex oxides corresponding product features. |
| Composition | Preparation | Feature | Ref. |
|---|---|---|---|
| Pb(TiZrHfNbAl)-O | Solid-state reaction | show powdery HEOs and the perovskite phase | [115] |
| Pb(TiZrHfNbCr)-O | formation is consistent with the Goldschmidt | ||
| Pb(TiZrHfNbMn)-O | |||
| Pb(TiZrHfNbSc)-O | |||
| (BiBaSrCaNa)Ti-O | |||
| (BiBaSrCaK)Ti-O | |||
| (BiBaSrNaPb)Ti-O | |||
| (AlCoFeNiTi)3O4 | with anti-spinel structure | [116] | |
| Ba(ZrTiSnHfX)O3(X=Nb5+,Ta5+) | exhibits exceptional thermal stability within the range of 30 to | [117] | |
| Ca5Sr5Ba5 Pb5Nb2O6 | unfilled tetragonal tungsten bronze (TTB) structured | [118] | |
| | the Ce-component samples showed superior | [119] | |
| Ba0.4 Sr0.6-xCaxNb2-xTaxO6 | exhibits TTB structure with significant dielectric properties | [120] | |
| (YbLuTm)2Si2O7-(YbLuTmErHoDyGdSm)2Si2O7(3-8HESi2O7) | High-throughput pressure-less sintering | excellent corrosion resistance at 1773 K | [121] |
| (MnCoNiCuX)Fe2O4(X=Fe,Mg) | Reactive flash sintering | a spinel crystal structure was obtained in just 30 min at 1173 K | [122] |
| Sr(Ti2Zr2Hf3Mn0.15Sn0.18)O2.85 | Multimetallic polymeric precursors and photolithographic additive manufacturing | retain the printed geometry with high shape fidelity | [123] |
| La(FeCuMnMgTi)O3 | Solid-state milling-heating method | displays robust stability in benzyl alcohol oxidation. | [124] |
| (YbTmLuHoEr)2Ti2O7 | Floating-zone growth technique | monocrystalline pyrochlore structure | [125] |
| (YGdDyErYb)2Hf2O7 | solution combustion | single phase fluorite structure with good TBC performance | [126] |
| | Sol-gel method | outstanding high temperature stability and CMAS corrosion resistance | [127] |
| (YDyErTmYb)4Hf3O12 | ultrafast high-temperature sintering (UHS) | extremely sluggish grain growth characteristics and excellent high-temperature phase stability | [128] |
| (YYbLuEuEr)3Al5O12 | Laser powder bed fusion | high-entropy phase with dendritic morphology | [129] |
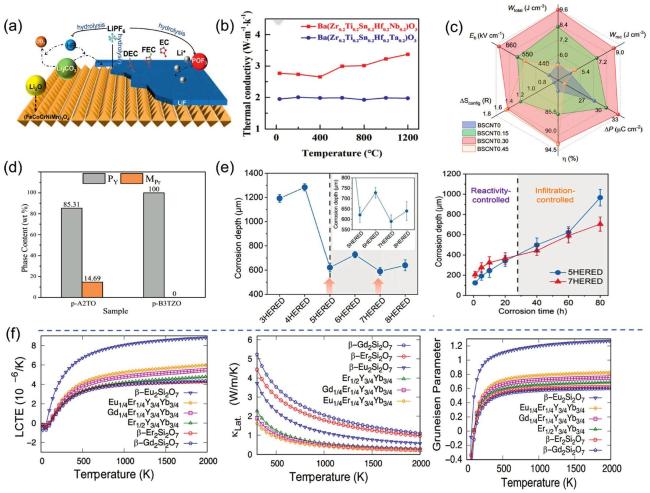
Fig. 7. (a) Schematic diagram representation of the conversion of Li2O,LiF, and Li2CO3 during the cycling process of the preconditioned HEOs. Reproduced from Ref [112]. Copyright Elsevier 2024. (b) Comparison of thermal properties at X=Ta,Nb. Reproduced from Ref [117]. Copyright The Royal Society of Chemistry 2024. (c) Effect of different configurational entropy (different x ) on energy storage performance. Reproduced from Ref [120]. (d) Effect of the introduction of Zr4+ on the content of the pyrochlore phase (PY) and monoclinic phase (MPr). Reproduced from Ref [137]. Copyright Elsevier 2023. (e) Corrosion depths of different component HEREDs at 1673 K,60 h; time-dependent curves of corrosion depths of 5HERED vs. 7HERED at 1673 K. Reproduced from Ref [121]. Copyright Elsevier 2024. (f) Thermal conductivity, CTE, and Grüneisen parameters as a function of temperature. Reproduced from Ref [140]. Copyright The Royal Society of Chemistry 2024. |
The tetragonal tungsten bronze (TTB) structure, similar to perovskite with the formula $\left(\mathrm{A}1{)}_{2}\right(\text{ }\mathrm{A}2{)}_{4}\left(\mathrm{C}{)}_{4}\right(\text{ }\mathrm{B}1{)}_{2}(\text{ }\mathrm{B}2{)}_{8}{\mathrm{O}}_{30}$ , comprises corner-sharing BO6 octahedral layers and exhibits significance in ferroelectric applications. For example, in the unfilled TTB structure, the disorder of the A -site cation dominates the ferroelectric properties of (CaSrBaPb)Nb2O6 [118]. While conventional TTB materials are limited by long-range ordering with low relaxation properties, Ba0.4Sr0.3Ca0.3Nb1.7Ta0.3O6 employs a high-entropy strategy to disrupt long-range order, modulating relaxation dynamics; Concurrently, reduced grain size, increased conductivity activation energy, and enlarged bandgap collectively enhance breakdown strength (Fig. 7(c)) [120].
Classical HEPOs follow the A2 B2O7 structure, with the A-site (16c) occupied by a rare earth element and the B-site (16d) a transition metal [135]. Pyrochlorite is structurally similar to fluorite and bixbyite in that it not only belongs to a fluorite-derived structure but also undergoes structural transformation with fluorite under specific conditions. [99,136]. Recent studies have found that the phase stability of the pyrochlore phase is related to the radius of the oxygen ions at the A-site [137], for example, the introduction of large-radius rare-earth ions (e.g., Sm3+,Yb3+ ) at the A-site is prone to lead to monoclinic phase precipitation, whereas the pyrochlore phase can be stabilized by doping the B-site with Zr4+ (Fig. 7(d)). On this basis, the high entropy (LaCeNdSmGd) 2Zr2O7 shows excellent irradiation tolerance: 9MeVAu 3+ irradiation maintains the crystalline state without elemental segregation, which can be attributed to localized strains suppressing defect aggregation [138]. Further expanding to hafnium-based systems, the rare-earth hafnium salts (LaCeNdGdHo) 2Hf2O7 improves the coefficient of thermal expansion and CMAS (Calcium-Magnesium-Alumino-Silicate) corrosion resistance by high entropy design, and its formation of a dense reaction layer at ${1300}^{\circ }\mathrm{C}$ effectively retards the penetration of molten silicates [53].
Table 4 Synthesis methods for high-entropy non-oxides corresponding product features. |
| Composition | Preparation | Feature | Ref. |
|---|---|---|---|
| (HfZrMoMoNbTi)B2 | High-energy ball milling and spark plasma | possess one solid-solution boride phase of the | [143] |
| (Hf, Zr, Ta, Sm)B 2 | Boron thermal reduction and hot press sintering | favorable oxidation resistance | [144] |
| (Hf0.28Zr0.28Ta0.28RE0.16)B2 | Ultrafast-UHS and SPS | HEB2-Sc has the best resistance to oxidation | [145] |
| | One-step in-situ carbo-thermal reduction and | x=0.75-0.85 range formed a stable two-phase | [146] |
| | pressureless vacuum sintering | HEC-Ni ceramic metal | |
| (TiZrNbTaCr)C | Carbothermal reduction reaction | Cr addition is beneficial to the oxidation resistance | [147] |
| (Zr,Nb,Ta,Ti,W)C | Selective laser sintering (SLS) | showed enhanced hardness and reduced thermal conductivity, | [148] |
| (CrNbTaMoW)C0.83 | Ultrafast Pressure Sintering (UPS) | dense single-phase and homogeneous structure in 3 min | [149] |
| (Zr-Nb-Hf-Ta) C1-x Nx | SPS | higher OOT compared to high entropy carbides and nitrides | [150] |
| MAX-phase ( | higher room and high temperature plasticity | [151] | |
| (MoWCrTaNb) Si2 | micron-scale uniform C40 hexagonal structure | [152] | |
| ( MoNbTaTiZr )1-x Nx | Hybrid direct current magnetron sputtering | x=0 presents a BCC structure, x=0.17 presents a FCC structure | [153] |
| ( Ti,Zr,Nb,Mo,Ta)C1-x Nx | Open dynamic carbothermal reduction nitriding | HEC0.9 N0.1 exhibits the highest mechanical properties | [154] |
| K0.65Li0.07Mg0.19Mn0.17Co0.16Ni0.17Cu4 F2.70 | Direct liquid-phase method | higher battery capacity | [155] |
| (LaCePrNdSmEuGdDyHoErYbScY)OCl | In-situ core@shell@shell interdiffusion strategy | significant bandgap modulation effects | [156] |
Other complex oxides such as high-entropy rare earth silicates, aluminates, tantalates, and niobates have also been found to exhibit excellent performance. The structure of high-entropy silicates is more complex, RE monosilicates (RE2SiO5) manifest an X 1 phase ( RE= La to Gd ) and an X 2 phase ( RE=Dy to Lu ); notably, when the RE elements are Y and Tb, both X1-RE2SiO5 and X2-RE2SiO5 phases coexist. In contrast, RE disilicates (RE2Si2O7) exhibit a greater variety of polymorphs, including $\alpha,\beta,\gamma,\delta,A,F$ , and G forms [139]. The excellent CMAS resistance of high entropy rare earth disilicates is essential for the application of environmental barrier coatings. For example, (YbLuTmErHoDyGd) 2Si2O7 exhibits good CMAS corrosion resistance due to the synergistic conformational entropy and chemical activity, which contributes to the formation of an apatite protective layer [121] (Fig. 7(e)). DFT-based calculations further confirm that the thermal conductivity of the solid solution system is significantly reduced compared to that of the single silicate, and in particular, the introduction of Eu2Si2O7 proves to be the key to modulating the thermal expansion coefficient and lattice thermal conductivity [140] (Fig. 7(f)). High-entropy aluminates are renowned for their high-temperature stability, matched thermal expansion coefficients, chemical compatibility, and exceptional durability in steam environments. Beyond garnet-structured aluminates, high-entropy aluminates also exist in other forms, such as perovskite and spinel [141]. For instance, Cao et al. [4] successfully synthesized a novel high-entropy hexaluminate ( LaNdSmEuGd ) MgAl11O19, which retains excellent phase stability after heat treatment at ${1600}^{\circ }\mathrm{C}$ for 100 h. High-entropy niobates [119] and tantalates [142] may be used in TBC applications due to their excellent thermo-mechanical properties.
This section systematically reviews the compositional and structural features of high-entropy oxides, encompassing simple oxides with single-cation sublattices and complex oxides with multiple-cation sublattices. The high-entropy strategy enhances configurational entropy and leverages multi-cation synergy, combined with lattice distortions and unique crystal structures, to significantly improve high-temperature stability, mechanical strength, and functional tunability. These properties advance HEOs in electrochemical, thermodynamic, and functional device applications, providing a theoretical and experimental foundation for designing novel high-performance ceramics.
4.3. High-entropy non-oxides
For high-entropy non-oxide systems, the research mainly focuses on classical ceramics such as carbides, nitrides and borides. The classical ceramic system optimizes the basic properties such as oxidation resistance and mechanical strength through the high entropy of cation sites; while the emerging silicides, sulfides, and multivariate composite non-oxides (e.g., carbon-nitrogen co-doped ceramics, layered MAX-derived materials) break through the single-anion limitation, and make use of the multi-element sub-lattice coupling and heterogeneous anion synergistic effect to achieve the simultaneous enhancement of the extreme environmental tolerance, structural plasticity, and functional tunability. See in Table 4.
4.3.1. High-entropy Carbides
High-entropy carbides mostly form rock-salt structures and normally follow the (TM)C formulation [157]. Traditional HEC preparation relies on high-temperature and high-pressure processes, which are en-ergy-intensive and complex. Recently, researchers have developed a new sintering technology: Ultrafast Pressure Sintering (UPS) offers high efficiency and scalability advantages over conventional hot pressing and discharge plasma sintering (SPS) via a combination of Joule heat, reaction heat, and pressure (Fig. 8(a)) [149]. While SPS and selected zone laser sintering (SLS) show significant differences in the preparation of (ZrNbTaTiW)C [148]: SPS obtains a homogeneous solid solution; SLS forms a TiC-rich/TaC-rich/ TiO2-rich three-layer structure with cellular elemental segregation due to the non-equilibrium solidification, and its unique defective structure yields higher hardness and lower thermal conductivity (Fig. 8(b)), providing a new idea for the directional modulation of the microstructure.
High-entropy carbides can be optimized for extreme environments through cationic component optimization, for instance, lattice distortion and defect pinning formed by multi-component cations significantly enhance irradiation resistance. In contrast to ZrC, (ZrTiNbTaW)C has a smaller lattice expansion reduction (0.91 % to 0.78% ) while maintaining the lattice integrity after irradiation with 540 keV He ions, which is attributed to the stress dispersion and vacancy compensation effects induced by the cationic multicomponent [6]. The antioxidant study showed that modulation of Cr content in (TiZrNbTaCr)C induces the generation of TiO2-(Nb,Ta)2O5 dense oxide layer, which changes the oxidation dynamics from linear to a parabolic type (Fig. 8(c)), and thus an increase in Cr enhances the antioxidant property of (TiZrNbTaCr)C under aqueous-oxygen environment at ${1200}^{\circ }\mathrm{C}$ [147]. To optimize the oxidation resistance of high-entropy carbides, Li et al. [158] proposed that the oxidation resistance of highentropy carbides can be improved by reducing the elements (e.g., Nb, Ta, and Ti ) in the HECs that have high oxygen adsorption energies.
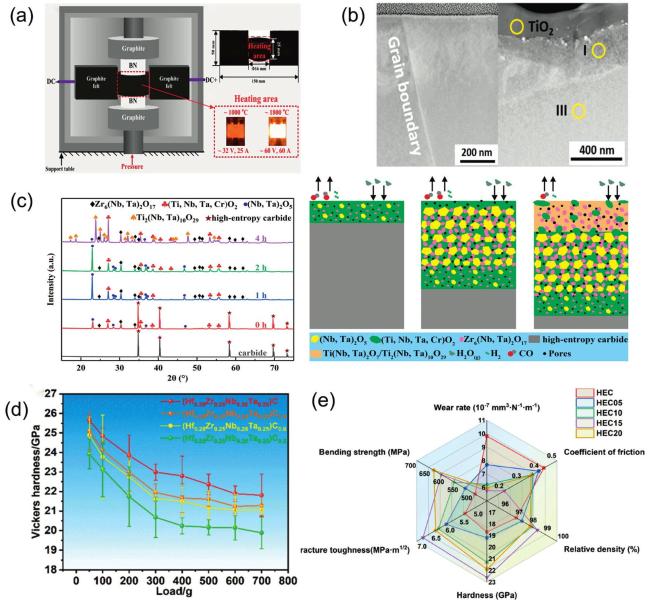
Fig. 8. (a) Schematic diagram of ultra-fast pressure sintering apparatus. Reproduced from Ref [149]. Copyright Elsevier 2025. (b) TEM cross-sections of the two samples sintered by SPS and SLS respectively, the sample with SPS has a uniform morphology and the sample sintered by SLS has a three-layer structure. Reproduced from Ref [148]. Copyright American Ceramic Society 2024. (c) XRD patterns of the samples oxidized for different durations, and Ti2(Nb,Ta)10O29 appeared at 4 h ; The schematic diagram of the oxidation mechanism of (TiZrNbTaCr)C in steam at |
The modulation of cationic components and carbon vacancies provides a new perspective for the mechanical and functionalized design of high-entropy carbons. Theoretical calculations show that the increase of carbon vacancies in ( HfZrNbTa ) Cx shrinks the lattice and enhances the Pugh ratio, and experiments confirm that the material combines both high hardness and plastic deformation when x=0.6, providing new hope for the coexistence of carbide strength and toughness (Fig. 8(d)) [159]. In terms of functionalization, (ZrTiMoNbTa)C nanowires enhance the electromagnetic wave absorption efficacy to -50.08 dB by modulating the entropy-induced lattice distortion and carbon vacancies, confirming the optimizable dielectric loss balance of cation complexity and carbon defects [28]. In addition to the classical high-entropy carbide functional materials, a plasma high-entropy carbide has recently emerged [160]. The high activity of the plasma allows high-entropy carbons with excellent thermo-mechanical properties to show a high degree of optical tunability.
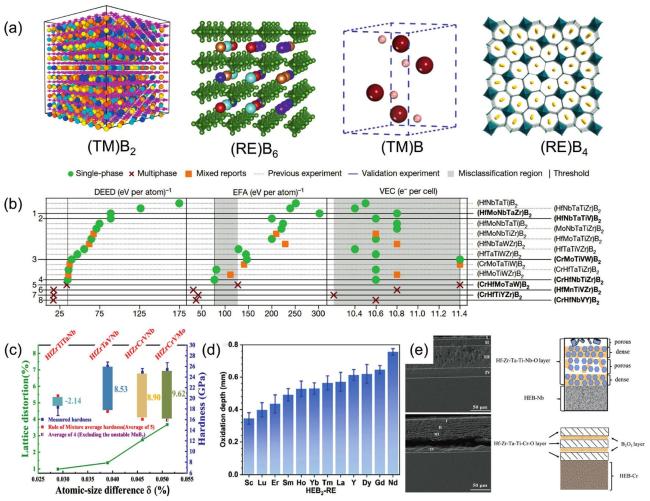
Fig. 9. (a) Crystal structures of different HEBs. Reproduced from Ref [167,170-172]. Copyright Elsevier 2021. (b) Prediction of multiple HEB2 syntheses by DEED: Compared with the results of EFA and VEC, the prediction of DEED was significantly better than the other two. Reproduced from Ref [10]. Copyright The Nature Publishing Group 2024. (c) Correlation between hardness, lattice distortion, and Atomic-size difference |
Additionally, their thermo-mechanical properties can be further improved by adding reinforcements to the high-entropy carbide matrix to fabricate composite materials. For example, graphene can be enhanced for toughness by crack bridging, deflection, and termination, while hardening is mainly attributed to high entropy effects, graphene doping gradient structure, and grain refinement [161]. Similarly, SiC, which possesses excellent thermodynamic properties, can be used as a reinforcement through whiskering to improve the mechanical properties of high-entropy carbides. For example, Doping of SiCw (silicon carbide whiskers) in (WZrNbTaTi)C reduces microcrack extension and oxidative wear and thus improves the wear resistance of high-entropy carbides (Fig. 8(e)) [162]. Further studies revealed that cations such as W,Mo, and Ta enhance the elastic modulus and melting point of highentropy carbides, while Cr inhibits the single-phase formation, and kinetic stabilization systems such as (TiHfNbTa)C were successfully prepared by screening the stabilizing components, which verifies the critical role of cation selection on structural integrity [163].
4.3.2. High-entropy borides
Depending on the boron content, high-entropy borides (HEBs) can be categorized as (TM)B 2 (high-entropy diborides, hexagonal structure, consisting of an alternating layer of two-dimensional borides and highentropy cations), (RE)B 6 (high-entropy hexaboride, cubic structure of the $\mathrm{P}\mathrm{m}\overline{3}\text{ }\mathrm{m}$ space group), (RE)B 4 (high-entropy tetraborides, orthorhombic system of Pnma space groups) and (TM)B (high-entropy monoborides, tetragonal crystal systems of PA/mbm space group (Fig. 9(a)). The most common of these are high-entropy diborides, while high-entropy monoborides are rarely reported at present.
As the most common material in HEBs, high-entropy diborides (HEB2) were initially synthesized by Gild's team using high-energy ball milling and SPS techniques, meanwhile, it was discovered that the material exhibits a unique quasi-two-dimensional layered structure [143]. Currently, most of the theoretical studies on HEB2 formation still rely on the advancement of experimental methods, except for those based on the EFA descriptors. Divilov et al. [10] proposed the DEED to predict the mechanism of HEB2 formation and successfully guided the experimental synthesis of a variety of single-phase HEB2, such as (HfMoNbTaZr)B 2 (Fig. 9(b)).
High-entropy diborides have established a robust research framework for their mechanical properties. For example, an increase in the lattice parameter difference factor ( $\delta $ ) exacerbates the lattice distortion and inhibits the formation of a single solid solution. Its final hardness is determined by a combination of lattice distortion and the ROM average hardness [164] (Fig. 9(c)). In addition to classical lattice distortion, fine grain and solid solution effects synergistically enhance the mechanical properties of high-entropy boride ceramics[165]. Recent investigations into composition-antioxidant property relationships have provided theoretical guidance for predicting high-stability HEB2 ceramics. Rare earth element composition screening proved to be an effective strategy [145]: the Sc-containing samples of the (Hf0.28Zr0.28Ta0.28RE0.16)B2 series exhibited optimal oxidation resistance due to the formation of (Zr,Me)0.84Sc0.16O2 composite oxides that enhanced the viscosity of the B2O3 glass (Fig. 9(d)). The addition of rare earth elements can also affect the stability by changing the structure. The oxide layer of Nbcontaining (HfZrTaNbTi) B2 is significantly thicker and denser ( $112\mu \text{ }\mathrm{m}$ vs. $62\mu \text{ }\mathrm{m}$ ) compared to the Cr-containing system [166], which is attributed to the porous-dense alternating tetrahedral structure observed in the niobium-doped system (Fig. 9(e)). Meanwhile, (HfZrTaSm)B2 containing $18\text{ }\mathrm{m}\mathrm{o}\mathrm{l}\mathrm{\%}\mathrm{S}\mathrm{m}$ has the best oxidation resistance in the temperature interval of 1473-1773 K. The formation of a moderate amount of (HfZrTaSm)2O3 products promotes the formation of a three-dimensional skeleton structure in B2O3 glass [144].
High-entropy hexaborides and tetraborides are the other two types of HEBs, and the first preparations were both accomplished by Qin and his team in 2021 through in situ metal-boron reactions combined with SPS techniques [167,168]. Recently Wang and Zhang proposed a new route to synthesize high-entropy hexaboride powders Based on the lowtemperature reaction of rare-earth oxides, B4C, and aluminum powders. Through theoretical verification, the feasibility of high-entropy boride formation was confirmed, and the (LaCeNdSmEu)B 6 was successfully prepared [169]. High-entropy hexaborides and tetraborides are extensively utilized as electromagnetic wave-absorbing materials in the domain of electromagnetic interference (EMI) shielding.
4.3.3. High-entropy nitrides
High-entropy nitrides (HENs) can be amorphous or crystalline, and the stability of the crystal structure depends on the nitrogen content. Most HENs possess an FCC structure, with the general formula (TM) (PE)N, where TM represents transition metals capable of forming nitrides, and PE refers to elements that can covalently bond with nitrogen [173]. Based on the research foundation of high-entropy nitrides, new high-entropy carbon-nitride (HECN, e.g., (TiZrNbHfTa)C x Ny ) systems have attracted much attention [174]. In this part, the material properties of these two types of nitrogen-based high-entropy ceramics will be reviewed.
The synthesis and property modulation of high-entropy nitrides are highly dependent on the precise control of the nitrogen content (RN). It is shown that (ZrTiNbV)N thin films prepared by multi-arc ion plating technique form FCC structure at $\mathrm{R}\mathrm{N}\ge 1$ and have the best overall performance when RN=3, and also they have good corrosion resistance [175]. Similarly, the (TiZrVCrCoNi)N x coating formed a biphasic nanocomposite structure at RN=15, combining superhardness with low corrosion current density [176]. Further investigation of (MoNbTaTiZr)1-x Nx coatings revealed that an increase in the nitrogen content ( x ) leads to a structural transition from BCC via amorphous/ FCC nanocrystals ( x=0.17 ) to polycrystalline FCC ( x=0.35-0.47 ) transformation [177]. (Fig. 10(a, b)) (TiZrNbCrSi) Nx high-entropy nitride coatings synthesized by multi-target magnetron sputtering undergo a phase transition from amorphous to face-centered cubic structure as the nitrogen flow rate continues to increase [178].
HECN can be obtained by adjusting RN on the basis of carbide, which further expands the performance boundary of nitrogen-based high-entropy ceramics while improving the stability of high-entropy carbide, and their structural relationship is shown in Fig. 10(c). Taking (TiZrNbMoTa)CN as an example, its room temperature and high-temperature microhardness are enhanced (62-56 %) compared with HEN, which is attributed to HECN due to the significantly higher strength of M-C bond than M-N bond (Fig. 10(d)) [179]. In terms of antioxidant properties, (Zr-Nb-Hf-Ta) C0.7 N0.3 ceramics have higher onset of oxidation temperatures (OOT) than single-phase carbides or nitrides and better structural integrity after oxidation, attributed to the inhibition of oxygen diffusion kinetics by nitrogen doping [150]. Further introduction of refractory metals (e.g., Ti/Zr ) reduces the oxidized weight gain by up to 83%. In addition, increasing the proportion of N in the CN lattice also improves the oxidation resistance of HECN. (Fig. 10(e)) [54]. For example, for ( Ti,Zr,Nb,Mo,Ta ) Cx N1-x high-entropy carbonnitride powders prepared by dynamic carbothermal reduction nitriding, an increase in the nitrogen content leads to an increase in lattice distortions and a decrease in phase stability[154]; for (TiZrHfNbTa) Cx Ny films, a super-hardness of 39.9 GPA and excellent fracture toughness ( >1.92MPa⋅M1/2 ) were achieved at RN=13%, and showed self-lubrication with a low wear rate ( 1.3×10⁻⁶ mm3/Nm ) and a friction coefficient (0.15-0.2) [180]. In summary, HECN shows more significant advantages than HEN in mechanical properties and high-temperature stability through carbon and nitrogen synergism and oxidation passivation effect, which provides a new direction for the design of protective coatings for extreme environments.
4.3.4. Other high-entropy ceramics
This section will briefly introduce several other types of high-entropy compounds: high-entropy silicides (HESis), fluorides (HEFs), and hydrides (HEHs), followed by an introduction to phosphides (HEPs), sulfides (HESs), and others.
HESi usually has a hexagonal or tetragonal structure (Fig. 11(a)), commonly applied as coatings on refractory HEA, and it is a strategy to address the oxidation resistance issue of metal refractory alloys. For example, the stabilization of the C40 hexagonal phase (MoNbTaTiW) Si2 breaks the traditional framework of cubic symmetry for high-entropy materials and extends high-entropy to silicides for the first time [181]. On this basis, (MoWCrTaNb) Si2, which was constructed by introducing elements such as Cr, exhibited higher Vickers hardness and fracture toughness than the average value of the mixture [182]; Y-HERMS coatings were further developed by Y modification to form in situ a high viscosity Si-Y-O oxide layer with a high melting point Y(NbTa)O4 skeleton, which resulted in a new high level of ablative resistance at ${2100}^{\circ }\mathrm{C}$ [183].
HEF crystal structures are mainly divided into two main categories: fluorite-type and perovskite-type. Fluorite-type HEF usually behaves as a transparent material, which can be used for laser ceramics, while perovskite-type HEF is commonly used as an electrode material. For example, CeNdCaSrBaF 12 with fluorite structure has 60% light transmittance [184], demonstrating the advantages of multiple cationic solid solutions for achieving ceramic transparency. In chemical energy, the synthesis of high-entropy perovskite fluorides by a combination of hy-drothermal-mechanical chemistry can cost-effectively enhance their OER (Oxygen Evolution Reaction) catalytic activity under alkaline conditions [185]. In addition, the solution method synthesized K0.65Li0.07Mg0.19Mn0.17Co0.16Ni0.17Cu0.24 F2.70 perovskite anode with a high defect density giving it a specific capacity of 698mAh/g as compared to the medium- and low-entropy materials [186], which highlights the potential of high-entropy structures in the energy field.
High-entropy hydrides are mainly present in the reversible phase transition between HEA and HEH during the hydrogen absorption process of HEA (Fig. 11(b)), which makes HEH most commonly used for HEA hydrogen storage. HEH can possess diverse structures, including FCC, C14 Laves structure, and base-centered tetragonal (BCT) [40]. The FCC structure of HEH can emerge from the phase transition of the BCC structural MgZrTi(FeCoNi) during hydrogen absorption and can be directly fabricated through high-energy ball milling under hydrogen pressure [187]. Further studies achieved the presence of a single C14 Laves phase HEH in CoFeMnTiVZr and the maximum hydrogen storage capacity was closely related to the elemental distribution and the enthalpy of hydride formation [188]. Recent studies have found that in TiZr-based HEAs, modulating the Zr ratio can regulate the enthalpy of the formation of HEH and thus optimize its hydrogen storage capacity [189]. In addition to this, the dual-phase structure design of TiV2ZrCrMnFeNi utilizes the BCC/C14 phase boundary to promote activation and achieve efficient hydrogen storage ( $1.6\mathrm{w}\mathrm{t}\mathrm{\%}$ ) at room temperature without pretreatment [190].
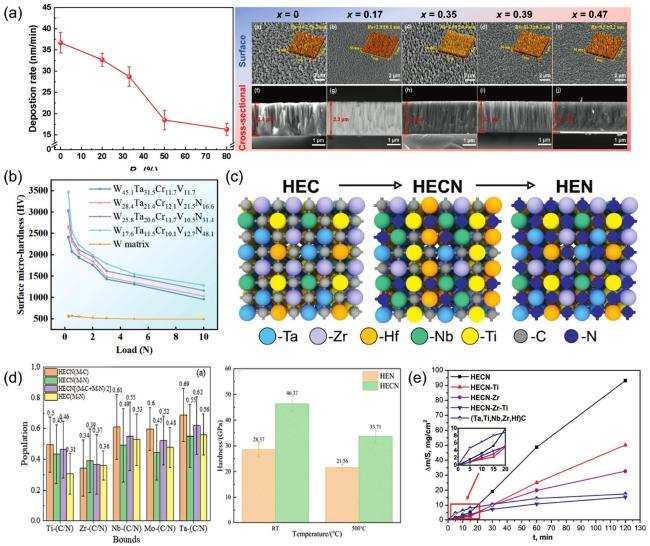
Fig. 10. (a) SEM images of surface and cross-sectional morphology of (MoNbTaTiZr) 1-x Nx coatings under different x; Deposition rates of (MoNbTaTiZr) 1-x Nx coatings with different RN. Reproduced from Ref [177]. Copyright Elsevier 2025. (b) Surface micro-hardness of W-Ta-Cr-V-N coatings. Reproduced from Ref [176]. Copyright Elsevier 2024. (c) Crystal Structures of HEC, HECN, and HEN. Reproduced from Ref [174]. Copyright Elsevier 2024. (d) Bond populations and density of states for HEN and HECN coatings; Crystal Structures of HEC, HECN, and HEN. Reproduced from Ref [179]. Copyright Elsevier 2024. (e) The increase in mass per unit area as a function of oxidation time reflects the variation of the surface mass of the sample with time at different oxidation durations. |
Reproduced from Ref [54]. Copyright Elsevier 2025.
In addition to this, there are several emerging HECs that deserve attention. (CoCrFeMnNi)P and (LaCeNdSmEu)PO 4 were reported by Zhao et al. [191]. They have FCC and monoclinic structures (Fig. 11(c)), respectively, and exhibit low thermal conductivity and better compatibility with Al2O3. It was reported that the $\mathrm{H}\mathrm{E}\mathrm{S}\mathrm{s}\left({\mathrm{C}\mathrm{u}}_{5}{\mathrm{S}\mathrm{n}\mathrm{M}\mathrm{g}\mathrm{G}\mathrm{e}\mathrm{Z}\mathrm{n}\mathrm{S}}_{9}\right.$ and Cu3SnMgInZnS7 ), have a tetragonal structure and exhibit different properties, the former metallic and the latter semiconducting (Fig. 11(d)) [192]. Recently, apart from the common HEF, there has been the emergence of high-entropy halide or halide-oxide ceramics represented by chlorine and bromine. Zhao et al. [193] also reported dual-phase highentropy perovskite bromides $\mathrm{C}\mathrm{s}\left(\mathrm{P}\mathrm{b}\mathrm{M}\mathrm{n}\mathrm{N}\mathrm{i}\mathrm{Z}\mathrm{n}\mathrm{C}\mathrm{d}\right){\mathrm{B}\mathrm{r}}_{3}/\mathrm{C}\mathrm{s}\left({\mathrm{P}\mathrm{b}\mathrm{M}\mathrm{n}\mathrm{N}\mathrm{i}\mathrm{Z}\mathrm{n}\mathrm{C}\mathrm{d}}_{2}{\mathrm{B}\mathrm{r}}_{5}\right.$ . Charles H. Wood and Raymond E. Schaak et al. [156] also reported highentropy rare earth halide oxides (REOX) and synthesized (LaCePrNdSmEuGdDyHoErYbScY)OCl.
HECs are also structurally expandable, in addition to their rich anionic composition. The concept of MAX phase ( Mn+1AXn, M is transition metals, A is a group A element, and X is usually C and N ) has also been introduced in the field of HECs [194]. For example, the irradiation resistance of the MAX-phase ceramic HEM2AlC can be greatly improved by high-entropy design[195]. The introduction of localized chemical flux (LCF) in the high-entropy MAX phase can explain the deformation mechanism of the MAX phase [151]: LCF induced strong lattice strains, which hindered dislocation slip. At the same time, it promoted crossslip and stacking fault dislocations, effectively mitigating strain localization and facilitating uniform deformation (Fig. 11(e)).
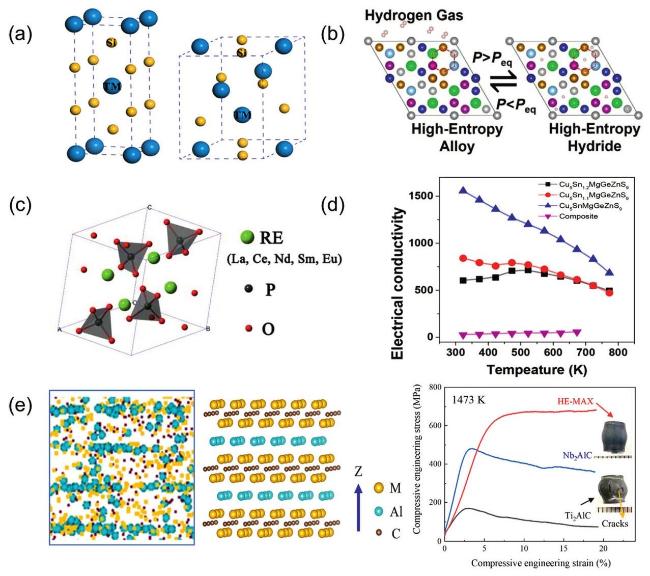
Fig. 11. (a) Crystal structure of tetragonal transition metal disilicide (left), hexagonal transition metal disilicides (right). Reproduced from Ref [196]. Copyright Elsevier 2023. (b) Reversible phase transitions of HEA and HEH during hydrogen absorption. Reproduced from Ref [190]. Copyright Elsevier 2024. (c) Crystal structure of HEPO4 monazites. Reproduced from Ref [191]. Copyright Elsevier 2019. (d) Electrical conductivity of the high-entropy sulfides. Reproduced from Ref [192]. Copyright American Chemical Society 2018. (e) A tomogram slices of the HE-MAX phase lattice structure as well as a picture of the crystal structure in the ideal case; Compressive stressstrain curves of the HE-MAX, Nb2AlC, and Ti2AlC at 1473 K, insets show the specimens after testing is completed. Reproduced from Ref [151]. Copyright Elsevier 2024. |
High-entropy non-oxides significantly optimize mechanical, oxidation, and functional properties through high-entropy strategies. In addition to the typical high-entropy carbides, borides, and nitrides, emerging materials such as silicides, fluorides, and MAX phases further extend the potential of HECs for extreme environments.
5. Properties and applications
As listed in Table 5, High-entropy Ceramics have demonstrated breakthrough potential in extreme environmental applications by virtue of their unique multi-component solid solution structure and high-entropy effect. Compared with traditional single/binary principal element ceramics, HECs have become the focus of research in the field of high-performance ceramics by achieving synergistic optimization of mechanical, thermal, electrical, and magnetic properties through multicomponent chemical disorder and multi-element interaction. From the perspective of structure-property correlation, the improved performance of high-entropy ceramics can be attributed to the multiscale control mechanisms induced by the high configurational entropy, such as solid-solution strengthening, phonon scattering enhancement, electronic structure modulation, etc. By breaking through the component and structural limitations of traditional ceramics, HECs have irreplaceable prospects for applications in aerospace, new energy, hightemperature ceramics, and electronic devices, etc., and future research will be focused on the mechanism of performance optimization and the multiscale structure. Future research will focus on its performance optimization mechanism and the deep correlation of multi-scale structure design.
5.1. Mechanical properties
High-entropy ceramics exhibit unique advantages over conventional mono/binary ceramics in the field of mechanical properties by virtue of their multi-major element solid solution structure. Conventional ceramics such as silicon carbide have high hardness but are limited by brittleness and insufficient thermal shock resistance due to a single component. In contrast, HECs achieve synergistic optimization of strength, toughness, and environmental adaptability through high-entropy strategies. Taking high-entropy fluorite oxides as an example, Ren et al. [200] modulated the lattice distortion of $\left((\mathrm{Z}\mathrm{r}\mathrm{H}\mathrm{f}\mathrm{C}\mathrm{e}\mathrm{Y}\mathrm{E}\mathrm{r}{)}_{(1-x)/5}{\mathrm{T}\mathrm{i}}_{x}\right){\mathrm{O}}_{2-\delta }$ through the introduction of Ti4+, which, when x=0.075, achieved a hardness ( 14.01 GPa ) and modulus of elasticity ( 205.70 GPa ) after 60 thermal shocks at ${1200}^{\circ }\mathrm{C}$ with a residual strength retention rate of 97.56%, which far exceeds the service limit of the conventional thermal barrier coating 8YSZ at high temperatures (with a phase transition at ${1170}^{\circ }\mathrm{C}$ ) (Fig. 12(a)). Similarly, the laser melting-prepared (AlCrNbTaTi) O2 rutile coatings with Al2O3-TiO2 coatings were tightly coated (Fig. 12(b)), and the hardness was enhanced to 13.58 GPa, which is 18% higher than that of conventional Al2O3 coatings ( ∼11.5GPa ), and its densified structure and dendritic phase-separated design provide a new idea for wear-resistant parts under extreme conditions [197].
Aiming at the bottleneck of low toughness and densification of traditional carbide ceramics, researchers have opened up a new path through process innovation and substable design. Sun et al. [219] obtained (ZrNbTiCrV)C coatings using an in-situ carbonization strategy of oxide precursors, which resulted in a reduction of porosity to 1.56%, an improvement of fracture toughness by 17.2 %, and a reduction of wear rate by 73.3 % compared to the conventional spraying process with binary carbides. Further, Hu et al. [14] proposed a sub-stabilization strategy by introducing randomly distributed zirconium dioxide particles into (WTaNbZrTi)C through in-situ growth, which induced crack deflection and bridging effects through martensitic phase transformation, resulting in a fracture toughness of 5.89MPa/m1/2, which exceeded the predictions of the law of mixtures and other reports (Fig. 12(c)). Such strategies not only overcome the intrinsic brittleness of conventional carbides but also optimize the plastic deformability through electronic structure modulation: high VEC (valence electron concentration VEC $\ge 9.4$ ) promotes the electronic re-hybridization of the metal state and activates the phase transition plasticizing effect [220] (Fig. 12(d)), which provides theoretical support for the design of mechanical properties of high-entropy carbides.
Table 5 Summary of properties of high-entropy ceramics. |
| Categories | Materials | Key Findings | Ref |
|---|---|---|---|
| Mechanical | (Al1/6Cr1/6Nb1/6TaTi1/3)O2 | elastic modulus ( | [197] |
| HE TM 0.8Sc0.2 B2 | B=254GPa | [198] | |
| HE TM 0.75Sc0.25 B2 | G=237GPa | ||
| HE TM 0.75Lu0.25 B2 | E=539GPa | ||
| (HfMoNbTaTi)C | low friction and wear ( 0.1 and 107 mm3/Nm ) | [199] | |
| H=18.7GPa | |||
| (WTaNbZrTi)C | H=21.0GPa | [14] | |
| ( CeZrLaSmNdY | KIC=8.07MPa⋅m1/2 | [96] | |
| (TiTaNbZr)C | | [13] | |
| Thermal | | | [200] |
| | | [201] | |
| lattice thermal conductivity of 2.54 W/(m⋅K) at 1073 K | |||
| ⟨001⟩-textured (LaSrBaCa) 0.85TiO3 | ZT=0.13 | [203] | |
| Zr0.279(Y0.0708Yb0.0302Ta0.0329Nb0.0402)O0.5469 | CTE=10.6∼10.9×10⁻⁶ K-1 (at | [204] | |
| (LaNdSmEuGd)CrO3 | | [205] | |
| Electircal | | maximum power density of 2.03 W/cm2 | [206] |
| | PPD=1.33 W/cm2 | [207] | |
| LiNi0.8Co0.15Al0.05O2 | Coulombic efficiencies of Li-ion batteries over 99.9 % | [208] | |
| (MgTiZnCuF)3O4 | Reversible capacity of 504 mA h/g | [209] | |
| | Electrical conductivity 635.15 S/cm at | [210] | |
| | Initial discharge capacity of 125.9 mA h/g | [211] | |
| Catalytic | (FeMnCoNiCr)3O4 | PPD=1.33 W/cm2 at solid oxide fuel cells | [33] |
| (TiVCrMo)B2 | FE=97.9% (at hydrogenation process of NO3 -RR ) | [212] | |
| | overpotential of 40.7 mV at 10 mA/cm2 | [21] | |
| (FeCoNiCuZn)3O4 | HER ( | [20] | |
| Ru0.13/Ba0.3Sr0.3Bi0.4(ZrHfTiFe)O3 | 51%CO conversion at | [49] | |
| Magnetic | (CrMnFeCoNi)3O4 | ferrimagnetic behavior with a saturation magnetization of 22emu/g at 2 K and 7.2emu/g at 300 K | [35] |
| LaCr0.2Mn0.2Fe0.2Al0.2Ga0.2O3 | Magnetic behavior driven by competing interactions among Cr,Mn, and Fe sublattices | [34] | |
| (LaNdSmGd)1-xYbxMnO3 | | [56] | |
| Dielectric | SrLa(Al0.50-xGaxZn0.125Mg0.125Ti0.25)O4 | Qf=98,000GHz | [214] |
| (MgCoNiCuZn)O, | PD=332.88MW/cm3 | [215] | |
| 0.8Na0.5Bi0.5TiO3-0.2Sr(ZrSnHfTiNb)O3 | high | [217] | |
| | Wrec =4.89 J/cm3,g=91.2% | [218] |
H : Hardness, B : Bulk modulus, G : Shear modulus, E : Young's modulus, $\nu $ : Poisson's ratio, $\mu $ : Friction coefficient, KIC : Fracture toughness, RSR: Residual Strength Ratio, $\mathrm{\Delta }R/{R}_{0}$ : Relative resistance, $\kappa $ : Thermal conductivity, ZT: Thermoelectric Figure of Merit, CTE: Coefficient of Thermal Expansion, PPD: Peak power density, $\sigma $ : Electrical conductivity, FE: Faradaic Efficiency, HER: Hydrogen Evolution Reaction, OER: Oxygen Evolution Reaction, TC : Curie temperature, Mr/Ms : Remanence ratio Qf : Best quality factor, ${\tau }_{f}$ : Temperature coefficient of resonant frequency, PD: Polarization Efficiency, ${\epsilon }_{\mathrm{r}}$ :relative permittivity, $\delta $ : Dielectric loss tangent, Wrec : Recoverable Energy Density.
Recent studies have further expanded the boundaries of functionalized applications of HECs. Traditional self-lubricating ceramics usually rely on exogenous solid lubricants (e.g., graphite), often sacrificing mechanical properties, while (HfMoNbTaTi)C realizes a low coefficient of friction as low as 0.1 in a vacuum environment by friction-induced in-situ generation of amorphous carbon films, while maintaining a high hardness of 18.7 GPa [199], opening up a new direction for single-phase self-lubricating ceramics. In addition, metalceramic composites (HEMCCs) combine the toughness of HEAs with the strength of HECs, such as the TiTaNbZr-(TiTaNbZr)C system (Fig. 12(e)) that achieves a room temperature flexural strength of 541 MPa and a high-temperature compressive strength of 275 MPa $\left({1300}^{\circ }\mathrm{C}\right)$ through the interfacial crack pinning effect [13]. Such breakthroughs indicate that the multi-scale structural design and cross-scale performance coupling of HECs will become a core direction for future development.
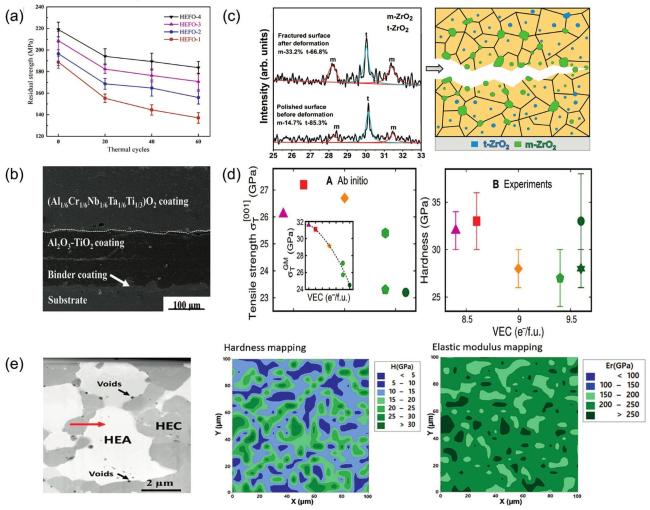
Fig. 12. (a) Residual flexural strength after cyclic thermal shock at |
5.2. Thermal properties
Compared with traditional single-component or binary ceramics, high-entropy ceramics introduce lattice distortion, oxygen vacancies, and multiscale defects through multi-major element design, which significantly improves the high-temperature stability, thermal conductivity regulation ability, and thermoelectric conversion efficiency, and shows significant advantages in optimizing the thermal performance, which provides a new idea for the field of thermal management and energy materials in extreme environments.
The enhanced thermodynamic properties of high-entropy ceramics stem from the synergistic effect of their chemical composition and microstructure [221-223]. In the field of thermal barrier coatings (TBCs), where the thermodynamic requirements of materials are extremely high, (CeNdSmEuLu)3TaO7 significantly enhances phonon scattering by inducing atomic size differences and grain size inhomogeneities through multi-rare earth element doping, resulting in thermal conductivity as low as 1.46 W/(m⋅K) at ${1000}^{\circ }\mathrm{C}$ , which is lower than that of the conventional single-component tantale Yb3TaO7 ( 1.35 W/(m⋅K) ), while exhibiting high hardness ( >8.4GPa ) [15]. The biphasic zirconate/tantalate HECs further combine a high-entropy effect with high oxygen vacancy concentration to achieve glass-like thermal conductivity ( 1.55 W/(m⋅K) at ${1200}^{\circ }\mathrm{C}$ ), along with a coefficient of thermal expansion of 10.9×10⁻⁶ K-1 ( ${1400}^{\circ }\mathrm{C}$ ), which is significantly better than that of the YSZ ( 13.5×10⁻⁶ K-1 ). [204] (Fig. 13(a)). In addition, the high-entropy aerogel ceramic (YErYbGdLa) 2Zr2O7 exhibits excellent high-temperature stability ( ${1400}^{\circ }\mathrm{C}$ ), ultra-low density ( 0.1824 g/cm3 ), and very low thermal conductivity $\left(0.126\text{ }\mathrm{W}/(\mathrm{m}\cdot \mathrm{K})\right.$ at $\left.{1000}^{\circ }\mathrm{C}\right)$ by virtue of its three-dimensional pearlchain porous structure (Fig. 13(b)), which provides an innovative spacecraft ultra-high temperature thermal protection solution [52].
For the thermoelectric field, high-entropy ceramics are used to improve the thermoelectric figure of merit (ZT) through entropy modulation and defect engineering for effective electron-phonon decoupling. For example, perovskite-type $(\mathrm{S}\mathrm{r}\mathrm{C}\mathrm{a}\mathrm{L}\mathrm{a}\mathrm{B}\mathrm{a}{)}_{1-x}{\mathrm{T}\mathrm{i}\mathrm{O}}_{3\pm \delta }$ ( $0<x\le 0.125$ ) [202], A-site vacancies and high-entropy distortions combine to enhance carrier migration by a factor of 16.5, while the lattice thermal conductivity is reduced to 2.54 W/(m⋅K)(107 K), which is a 21.4% reduction compared to conventional SrTiO3-based ceramics, and the ZT is increased by 27.8% (Fig. 13(c)). Weaving is the main method to obtain multiple defects, such as <001>-textured (LaSrBaCa)0.85TiO3 selectively scatters high-frequency phonons through multiscale interfaces (grain boundaries, dislocations, and metal intercalation), resulting in a low lattice thermal conductivity as low as 1.79 W/(m⋅K) and a 100% enhancement of the ZT value compared to the nonwoven sample (Fig. 13(d)) [203].
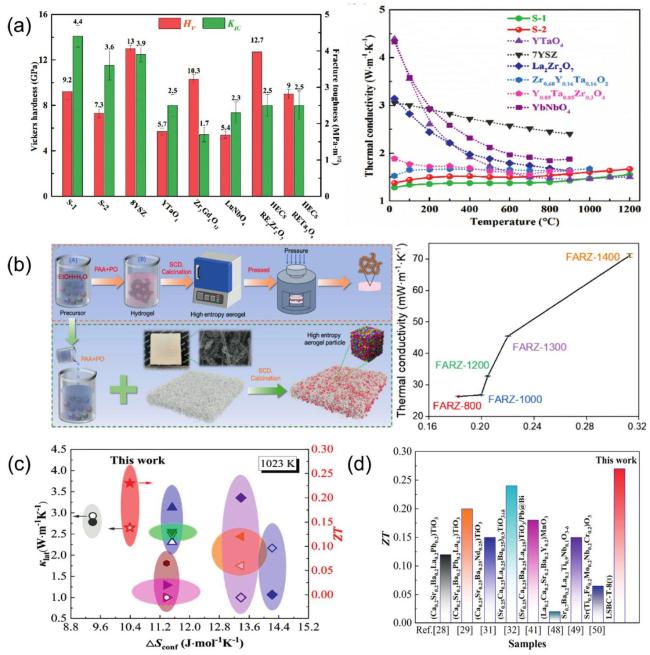
Fig. 13. (a) Mechanical property comparisons between dual-phase zirconate/tantalate HECs, 8YSZ, YTaO4, and others. Reproduced from Ref [204]. Copyright Elsevier 2024. (b) The fabrication process of (YErYbGdLa) 2Zr2O7 ceramic aerogel and its thermal insulating properties. Reproduced from Ref [52]. Copyright Elsevier 2024. (c) Comparison of PF (power factor) and ZT of ceramics with reported high-entropy perovskites at x=0.10. Reproduced from Ref [202]. Copyright Elsevier 2023. (d) Comparison of the ZT in this study with those of previously reported high-entropy perovskites. Reproduced from Ref [203]. Copyright Elsevier 2024. |
High-entropy ceramics, through the synergistic optimization of components and structure, show the potential of replacing traditional materials in the fields of thermal barrier coatings, high-temperature thermal insulation and thermoelectric conversion; future research needs to focus on the theory of multi-component design, cross-scale structural modulation and extreme environmental service behavior research.
5.3. Electrical properties
The high-entropy effect induces lattice distortion and chemical complexity in HECs, significantly enhancing their electrical conductivity, structural stability, and reaction kinetics. This makes HECs an ideal candidate for high-performance chemical energy storage materials. In particular, they excel as electrodes and electrolytes, which are crucial components that determine storage capacity, rate performance, and cycling life. The excellent mechanical strength, ionic conductivity, and thermal stability of HECs further align perfectly with the requirements of electrochemical energy storage systems [32].
Lithium-ion batteries, the most widely used electrochemical energy storage devices, exhibit exceptional electrochemical performance and enhanced cycling stability when employing high-entropy ceramic composites as electrodes. Jin et al. [224] successfully prepared (CrMnCoNiZn)3O4@PPy nanocomposites by solution combustion method and in situ polymerization. The combination of flexible polypyrrole (PPy) and HEO effectively mitigated the volume change of the HEO electrode during the extraction-insertion process of Li+. The electrochemical performance of this composite in lithium-ion battery anode was significantly improved compared with (CrMnCoNiZn)O4 nanoparticles (Fig. 14(a)). High-entropy perovskite materials (e.g. ( PrSmNdGdLa ) ${\mathrm{B}\mathrm{a}\mathrm{C}\mathrm{o}}_{2}{\mathrm{O}}_{5+\delta }$ ) inhibit lattice oxygen loss through entropyincreasing effect lattice distortion, which reduces the area-specific resistance of the oxygen reduction reaction to $0.010\mathrm{\Omega }/{\mathrm{c}\mathrm{m}}^{2}$ , and the durability of the high-entropy PSNGLBC electrodes is remarkably enhanced when compared with the ${\mathrm{P}\mathrm{r}\mathrm{B}\mathrm{a}\mathrm{C}\mathrm{o}}_{2}{\mathrm{O}}_{5+\delta }$ electrodes (Fig. 14(b)), which demonstrates the potential of HEC to revolutionize the field of high-temperature fuel cell electrodes [206].
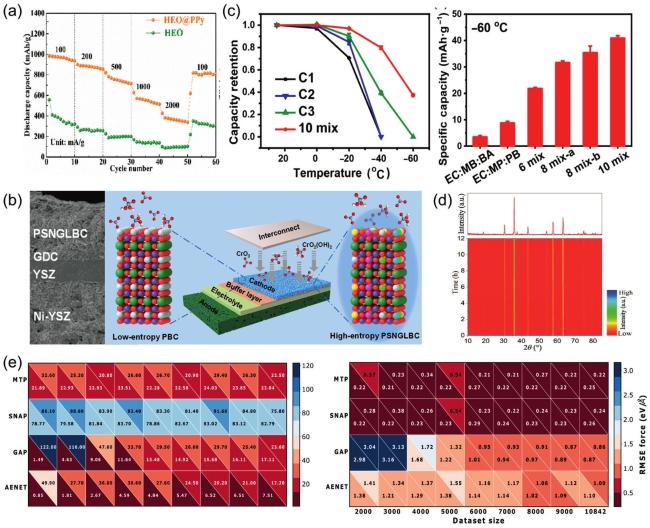
Fig. 14. (a) The rate discharge performance of HEO and HEO@PPy at various current densities; the rate performance of HEO@PPy significantly outperforms that of HEO. Reproduced from Ref [224]. Copyright Elsevier 2024. (b) Schematic and SEM cross-section of a single cell with (PrSmNdGdLa)BaCo |
HECs construct efficient ion channels in solid-state electrolytes through high-entropy effects. For example, the (MgCoNiCuZn)1-xGaxLixO system utilizes the oxygen vacancies generated by charge compensation to form a three-dimensional conduction network, which achieves a lithium-ion conductivity up to 10-3 S/cm at room temperature, a two-order-of-magnitude increase compared to the conventional LiPON by two orders of magnitude [55]. The field of high entropy electrolytes still shows optimistic performance stability at low temperatures. Zhang et al. [225] proposed a decimal high entropy electrolyte with a molecular disordered design that reduces the freezing point to $-{130}^{\circ }\mathrm{C}$ and maintains an ionic conductivity of 0.62mS/cm at $-{60}^{\circ }\mathrm{C}$ , which enables lithium-ion batteries to maintain 80% capacity at $-{40}^{\circ }\mathrm{C}$ , breaking through the commercial carbonate electrolyte ( $-{30}^{\circ }\mathrm{C}$ failure) This breaks the low-temperature limit of commercial carbonate electrolytes (which fail at $-{30}^{\circ }\mathrm{C}$ ) (Fig. 14(c)). In contrast to conventional solid-state electrolytes that are sensitive to interfacial impedance, (FeMnCoNiCr)3O4 inhibited CO2 corrosion through a high-entropy structure and achieved a peak power density of 1052 mW/cm2 in a proton conductor fuel cell with a polarization resistance nearly 50% lower than that of a non-high-entropy spinel cathode [33]. (Fig. 14(d)).
High-entropy ceramics have broken through the traditional material performance boundary in the field of electrodes and electrolytes through component innovation and structural design. Future research needs to combine machine learning to accelerate component screening (Fig. 14(e)) and explore the entropy synergy mechanism at the elec-trode-electrolyte interface [226]. With the growing demand for all-solid-state batteries and energy storage in extreme environments, HECs are expected to become the core material system for high-performance electrochemical devices.
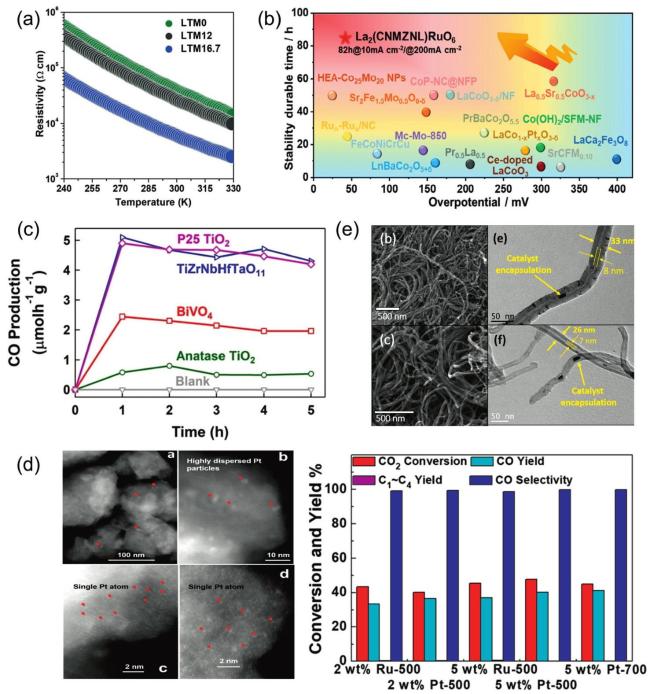
Fig. 15. (a) Temperature-dependent ( |
5.4. Catalytic properties
High-entropy ceramics show potential beyond traditional ceramics in the field of catalysis through multi-element and structural innovations. In this part, we review the recent progress of high-entropy ceramics in terms of their structural and compositional properties in two major directions, namely electrochemical catalysis and chemical catalysis.
High-entropy ceramics drive efficient energy conversion by significantly enhancing electrocatalytic activity through structural and electronic modulation. For example, lithium-doped rock-salt high-entropy oxide (LiFeCoNiCuZn)O, where lattice shrinkage and oxygen vacancy enrichment increase the conductivity by a factor of 10, reduces the HER and OER overpotentials to 207 mV and 347mV(10 mA/cm2) (Fig. 15(a)), respectively [20]. In addition, the high-entropy double perovskite La2(CoNiMgZnNaLi)RuO6 [21] optimizes the electron transfer between Ru-Co/Ni via alkali metal-induced superexchange, resulting in a reduced hydrogen adsorption energy, a HER overpotential of only 40.7 mV under alkaline conditions, and a stability time of up to 82 h (Fig. 15(b)). Two-dimensional HEO nanosheets (FeCoNiMoRu) 3O4 constructed by the self-sacrificial template method with high specific surface area with short ion transport paths enabled the OER to operate stably at 500 mA cm -2 for 100 h, and the overpotential ( 266 mV @100 mA/cm2 ) is 40% lower than that of conventional catalyst RuO2 [227]. These advances indicate that HECs break through the activity limitations of conventional electrocatalysts through multi-element synergy and defect engineering.
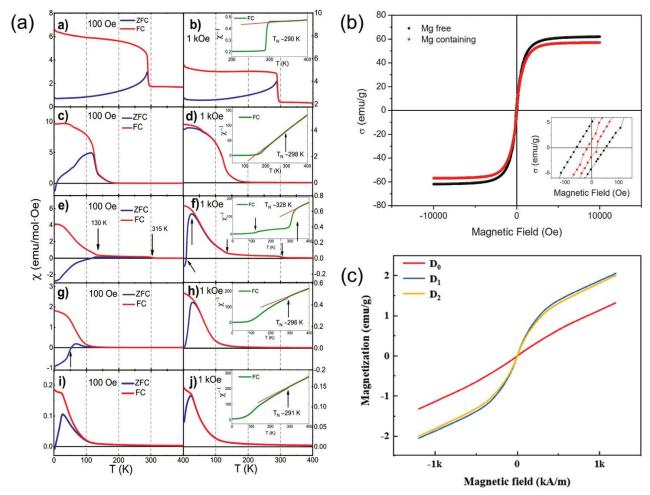
Fig. 16. (a) Magnetic induction strength versus temperature for (a-b) LC, (c-d) LCM, (e-f) LCMF, (g-h) LCMFA, and (i-j) LCMFAG ceramics in ZFC (Zero Field Cooling) and FC (Field Cooling) modes at 100 Oe and 1000 Oe, inset show the |
In the field of non-electrochemical catalysis, HECs exhibit remarkable environmental remediation and resource conversion capabilities due to the entropy stabilization effect and abundant active sites. For example, in terms of pollutant degradation, HEB2 achieves 93.5% tetracycline degradation efficiency in persulfate activation through a titanium site-dominated electron transfer mechanism [228]; high-entropy perovskite La(CoAlFeMnCu)O3 has a turnover frequency 369 of 15.38 min-1 for the activation of antibiotics degradation by peroxymonosulfate due to the polymetallic composition and entropy-stabilized structure dispersing the active sites, and the cobalt leaching ( 0.111mg/L ) is lower than that of conventional LaCoO3 by 93%, [229] which can solve the problems of environmental pollution and difficult recycling of traditional catalysts. Photocatalysis and thermocatalysis of biphasic TiZrNbHfTaO 11 with lattice strain and defects for CO2 photoreduction without co-catalysts, with activity comparable to commercial P25TiO2 (A commercialized catalyst) (Fig. 15(c)) [22]; the mechanochemical synthesis of (NiMgCuZnCo)O loaded with noble metal single atoms resulted in a 3 - times enhancement of CO2 hydrogenation efficiency (Fig. 15(d)), highlighting the unique advantage of HECs in dispersing the active sites [230]. In addition to their catalytic role in traditional chemistry, carbon nanotube composites prepared from HEO nanoparticles as low-cost catalysts exhibit excellent performance in electrochemical capacitors. For example, 100% capacitance retention and a high specific capacitance of 286.0 F/g were achieved in PVA/ H2SO4 hydrogel electrolytes (Fig. 15(e)) [231].
High-entropy ceramics, designed with diversified components and structural defects, show the unique advantages of "active site diversity, multi-scale structure optimization, and special stable structure" in electrochemistry and chemical catalysis. Current research focuses on synthetic method innovations (e.g., pulsed laser irradiation, mechanochemical methods) and mechanism analysis (e.g., multiscale synergy, entropy stabilization mechanism), and the future should be devoted to the large-scale application of HECs in environment and energy.
5.5. Magnetic properties
High-entropy ceramics significantly outperform conventional ceramics in terms of complex magnetic order, high-temperature magnetism, and magnetoelectric coupling, and their high-entropy design not only enhances the versatility and tunability of magnetic properties but also broadens the prospects for applications under extreme conditions.
High-entropy ceramics induce complex magnetic states that are difficult to realize in conventional single-component systems through multimagnetic ion competition and local structural distortions. For example, the competitive interactions of the Cr3+/Mn3+/Fe3+ sublattice in La (CrMnFeAlGa)O 3 perovskite lead to the formation of Griffiths phases, and the coexistence of ferromagnetic clusters with weakly ferromagnetic/antiferromagnetic magnetic phases (Fig. 16(a)) [34]. Similarly, the lattice distortion in (GdLaNdSmY) MnO5 interacts with Mn3+-O-Mn4+ exchange to keep the material magnetically stable even at a low Curie temperature (TC=61 K) [232]. Such designs provide new ideas for low-temperature magnetic storage and quantum modulation. Furthermore, the substitution of nonmagnetic Mg2+ for Fe2+ in (MnCoNiCuX)Fe2O4(X=Fe,Mg) weakens the super-exchange interactions between the magnetic moments, which leads to a decrease in the magnetic parameters (Néel temperature, saturation magnetization, and coercivity field) (Fig. 16(b)), demonstrating that the compositional design has a significant impact on the HECs' magnetic modulation [122]. Spinel-type HECs can exhibit excellent hightemperature magnetic stability by polymetallic occupation. For example, (CrMnFeCoNi)3O4 thin films form bispinel heterostructures by preferentially occupying tetrahedral/octahedral sites via Cr3+, with Curie temperatures ( TC>873 K ) exceeding those of the conventional magnetic spinel oxides, Fe3O4, and with significantly higher hardness ( 13.2 GPa ) and elastic modulus ( 255 GPa ) are significantly improved [35].
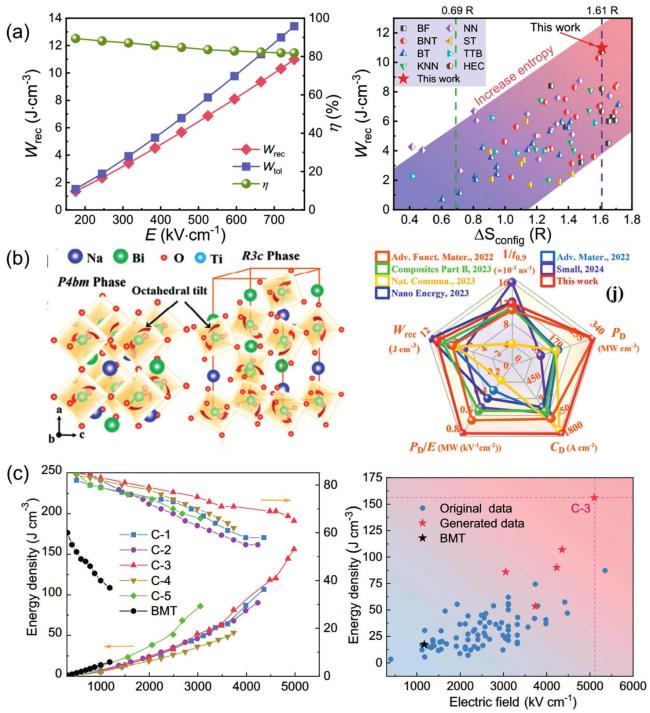
Fig. 17. (a) Wrec and |
HEC achieves synergistic enhancement of magnetic and electrical functions through valence and lattice modulation. For example, Fe2+ doped garnet-type $\left(\mathrm{Y}\mathrm{E}\mathrm{u}\mathrm{E}\mathrm{r}\mathrm{D}\mathrm{y}\mathrm{L}\mathrm{u}{)}_{3}\right(\mathrm{A}\mathrm{l}\mathrm{F}\mathrm{e}{)}_{5}{\mathrm{O}}_{12}$ significantly enhances the permittivity to 2.78×10⁴(100 Hz) and strengthens the maximal magnetization, in addition to driving the dielectric properties via the difference in the crystal-boundary activation energies and grain conductivity enhancement (Fig. 16(c)), which opens up new avenues for high-entropy strategies to design high-performance dielectric and magnetic materials [131]. Rare earth borides (DyHoErTmLu) ${\left(R{h}_{0.85}R{u}_{0.15}\right)}_{4}{B}_{4}$ exhibits superconducting properties below 6 K through high entropy of the rare earth sublattice, and the magnetic properties and superconductivity are simultaneously affected by the entropy of mixing, which reveals the mechanism of the competition between the magnetic elements and superconductivity [233].
High-entropy ceramics have realized magnetic states that are difficult to achieve with conventional materials through magnetic ion modulation engineering and entropy modulation, providing new solutions for applications under extreme conditions. These studies not only deepen the understanding of high-entropy effects, but also provide new insights into the design of multifunctional magnetic materials.
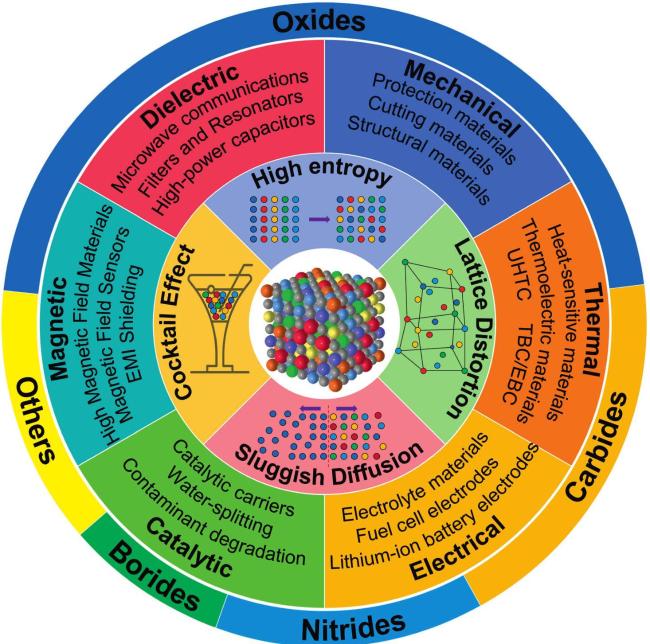
Fig. 18. An overview diagram of HECs. The outer ring shows the percentage of studies on high-entropy oxides, carbides, nitrides, borides and others. The inner rings show the main applications of HECs, as well as the four core effects of high-entropy materials and a schematic of the disordered structure, respectively. |
5.6. Dielectric properties
High-entropy ceramics that significantly enhance atomic-scale heterogeneity and lattice distortion through chemical disorder and structural tunability, thereby optimizing the polarization response and breakdown field strength, have demonstrated breakthroughs in the fields of dielectric energy storage and microwave devices.
High-entropy ceramics are particularly promising in the field of energy storage, where modulation of elemental ratios and localized lattice distortions can significantly enhance dielectric energy storage performance. For example, an equimolar ratio elemental design achieves a large recoverable energy density of 11.0 J/cm3 and a high efficiency of 81.9 % for a high-entropy tungsten-bronze-based relaxation ferroelectric ceramic (Fig. 17(a)), which is attributed to component heterogeneity and lattice distortions at the atomic scale that reduce the polarization hysteresis and enhance the breakdown tolerance [36]. Another study achieved an energy density of 18.7 J/cm3 and an efficiency of 85% by modulating local lattice distortions in (BiK)TiO3- based high-entropy ceramics [37], further demonstrating the effectiveness of the high-entropy strategy. Furthermore, by modulating the octahedral tilt and cation displacement in the ABO3-type perovskite high-entropy ceramics, the BNYTT-BST-0.06SZH ceramics achieved a high energy density of 10.46 J/cm3 and a power density of 332.88MW/cm3. (Fig. 17(b)). The Tm/Yb co-doping introduces an anomalous fluorescence negative thermal expansion and superior real-time temperature sensing, providing an innovative solution for high-voltage transmission line fault detection [216].
High-entropy ceramics also show great promise in new applications. For example, for microwave dielectric properties, $\mathrm{S}\mathrm{r}\mathrm{L}\mathrm{a}\left({\mathrm{A}\mathrm{l}}_{0.50-}\right.\left.{ }_{x}{\mathrm{G}\mathrm{a}}_{x}{\mathrm{Z}\mathrm{n}}_{0.125}{\mathrm{M}\mathrm{g}}_{0.125}{\mathrm{T}\mathrm{i}}_{0.25}\right){\mathrm{O}}_{4}$ high-entropy ceramics have significantly improved the hardness and thermal stability while maintaining the tetragonal structure, and have successfully optimized the quality factor (Qf) to 98,000GHz [214]. In addition, the high-entropy strategy effectively reduces the coefficient of thermal expansion, resulting in a near-zero temperature coefficient, which is important for the development of advanced communication components. The application of HECs to the middle layer of a drop electrical energy generator (DEG) achieved a high output voltage of 525 V, accelerated the energy harvesting process, and developed a new method for rapid bacterial detection [215]. Meanwhile, a generative learning-based approach accelerates the discovery of high-entropy dielectric materials [234], and Bi(Mg0.5Ti0.5)O3-based high-entropy dielectric thin films with significantly enhanced energy densities are obtained with only five sets of targeting experiments (Fig. 17(c)).
The core feature of high-entropy ceramics, as an emerging class of multi-major element materials, lies in the introduction of five or more cations into the same crystal structure in a disordered situation, which significantly increases the configurational entropy and endows the material with a range of characteristics and unique properties, see Fig. 18. According to the different types of anions, highentropy ceramics can be divided into two categories: oxides and nonoxides, the synthesis of which is usually carried out by solid-phase reaction, discharge plasma sintering, or solution method to achieve a uniform distribution of the complex components and phase stability, in which the cations are mostly selected from the transition metals, alkali metals, and rare-earth elements, which are chosen and designed based on the principles of entropy maximization, atomic size mismatch, and thermodynamic compatibility. Benefiting from the strong lattice distortion, slow diffusion and stable solid solution structure, high entropy ceramics show excellent mechanical properties, thermal stability, corrosion resistance and chemical stability, as well as adjustable magnetic and dielectric properties and a wealth of diversified functions, so that it has a broad development prospect in the structural materials and multifunctional applications in extreme environments.
6. Conclusion and perspectives
The past decade has witnessed remarkable progress in high-entropy ceramics (HECs), driven by their emergent properties arising from chemical versatility and structural complexity. As a paradigm-shifting class of conventional ceramics, these materials demonstrated exceptional combinations of phase stability, mechanical robustness, and functional properties that depart from the established structure-com-position-property relationships. However, as examined in this review, significant challenges remain in bridging the gap between fundamental understanding and practical implementation of these advanced materials. The inherent complexity of HECs manifests in three critical dimensions: (1) The vast combinatorial space of multi-component systems, where even quinary compositions in common oxide systems can yield over millions of possible element distributions; (2) The intricate interplay between local chemical disorder and long-range crystallographic order further renders traditional models inadequate; (3) The interplay of thermodynamic, kinetic, interatomic, and electronic factors forms a complex coupling mechanism and creates a frustrated optimization landscape of phase stability and functional performance.
While the challenges outlined above are substantial, they present equally transformative opportunities for advancing HEC research. Several promising directions emerge: (1) Accelerated discovery via computational paradigms: developing machine learning algorithms coupled with highthroughput DFT calculations to overcome configurational sampling bottlenecks in multi-component systems; (2) Mechanistic decoding through multidimensional analytics: employ topological data analysis and graph neural networks to extract hidden patterns from high-dimensional property matrices; (3) Atomic-scale characterization to reveal chemical and structural features: combine emerging techniques to resolve HECs' characteristic signatures such as 4D-STEM to mapping chemical order, resonant X-ray to obtain element-specific local structure, and EELS to determine electronic configurations.
Although remarkable advances in HECs have been introduced in this review, the inherent complexities of HECs necessitate sophisticated approaches of both advanced prediction methods and synthesis techniques. Clarifying the intrinsic structure-property relationship in HECs is essential to accelerate the discovery and development of high-performance candidates. Therefore, a synergistic paradigm integrating multiscale computational modeling, atomic-level precision synthesis, innovative high-resolution characterization, as well as AI-driven autonomous analysis and experimentation promises to unlock the full potential of HECs as next-generation high-performance materials.
CRediT authorship contribution statement
Yiran Li: Writing - review & editing, Writing - original draft, Supervision, Funding acquisition, Conceptualization. Donghui Pan: Writing - original draft. Jiehui Cao: Writing - review & editing, Writing - original draft. Wenhui Fang: Writing - review & editing. Yiwang Bao: Conceptualization. Bin Liu: Funding acquisition, Conceptualization.
Declaration of Competing Interest
The authors declare that they have no known competing financial interests or personal relationships that could have appeared to influence the work reported in this paper.