

1. Introduction
Flexible piezoelectric composites (FPC) are composite materials composed of piezoelectric ceramics, epoxy resin, and flexible electrode films. FPC retain excellent piezoelectric properties while also offering the compliance and manufacturability of polymers, leading to widespread applications in aerospace, mechanical, and automotive fields, among others, and attracting significant research interest. FPC, composed of piezoelectric materials, epoxy resin, and flexible electrodes, exhibit orthotropic anisotropy, with superior electromechanical coupling properties in the material polarization direction compared to traditional composites. Substantial improvements have been made in both sensing and actuation performance, marking a distinct advancement over conventional piezoelectric materials.
Based on the FPC fabrication process published by NASA's Langley Research Center, an FPC consists of polyimide, piezoelectric ceramic fibers, copper foil electrodes, and epoxy resin [1]. During fabrication, piezoelectric ceramics are sliced into fibers of equal width, with epoxy resin filling the gaps between fibers to form a flexible, active piezoelectric layer. The final FPC product is obtained through a lamination process, as shown in Fig. 1. The rectangular cross-section of the piezoelectric fibers maximizes the contact area between the fibers and the interdigitated electrodes, enhancing the sensing and actuation properties of the ceramic fibers. Compared to traditional piezoelectric materials, FPC exhibit higher compliance, allowing them to adhere to surfaces with high curvature. Additionally, their higher strain energy density and better damage tolerance make FPC particularly advantageous in actuation and sensing applications.
Due to the complex composition of FPC (Flexible Piezoelectric Composites), the content of constituent materials and geometric parameters at different ratios have a significant impact on the sensing-actuating performance of the FPC. There has been extensive research on modeling methods for FPC and the relationship between the complex components and sensing-actuating characteristics. Diaa et al. [2] used the homogeneous field method to model the FPC actuator as a simple single-layer piezoelectric ceramic material, where only two electrodes are located at the longitudinal extremities of the FPC fibers, effectively simplifying the contribution of numerous interdigital electrodes. Jianhua Zhao et al. [3] also applied the homogeneous field method, equating the electric field along the fiber direction inside the FPC to a homogeneously, aligned electric field. S. Sreenivasa Prasath et al. [4] developed an analysis model for FPC based on an equivalent layered method to evaluate the effective performance of the FPC. The method involved homogenizing all phases within the FPC (Kapton, acrylic, copper electrodes, piezoelectric ceramic fibers, and epoxy resin), neglecting the internal arrangement of components within the FPC. Subsequently, in order to represent the presence of interdigital electrodes in the FPC model, Diaa et al. [5] further improved the homogeneous field method by replacing the function of interdigital electrodes with multiple equipotential surfaces of a fixed spacing, which could represent the presence of numerous interdigital electrodes in the FPC while avoiding the issue of excessive grid numbers. Bowen et al. [6,7] used equipotential surfaces with a 5 mm spacing to represent the electric field provided by interdigital electrodes in the FPC model, even though the actual spacing of interdigital electrodes in the FPC provided by manufacturers is much smaller than 5 mm. Huang et al. [8] used equipotential surfaces with a 0.5 mm spacing to represent the presence of numerous interdigital electrodes, which is more in line with the actual spacing and number of interdigital electrodes in the FPC. However, all of the aforementioned methods, which use multiple equipotential surfaces to replace interdigital electrodes, still ignore the width of the electrodes and essentially treat the electric field in the FPC along the fiber direction as homogeneous.
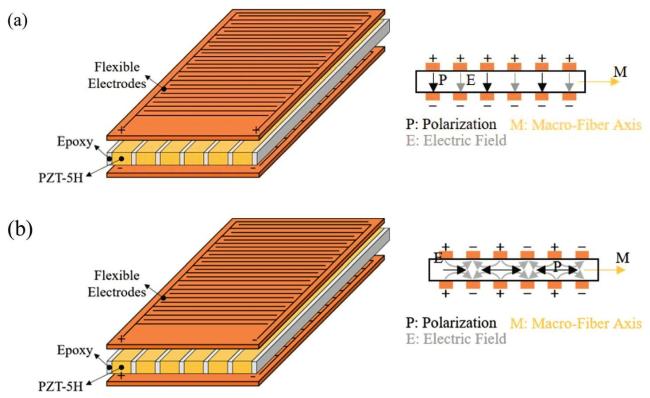
Fig. 1. A schematic diagram of an FPC structure. (a) D31-FPC. (b) D33-FPC. |
In fact, adjacent interdigital electrodes have opposite polarization directions, and there are significant electric field concentrations and strain fractures at the boundary between the two electrodes. Using the homogeneous field method, which assumes a homogeneously and aligned electric field along the fiber direction inside the FPC and the same polarization direction within the fibers, leads to a large voltage difference between the first and last electrodes and fails to account for the presence of interdigital electrodes and the impact of their parameters on the performance of the FPC. Beckert et al. [9] first proposed that the presence of interdigital electrodes in piezoelectric actuators leads to electric field concentration and non-homogeneously polarization of the piezoelectric ceramic. However, due to technical limitations, when constructing models for piezoelectric composite actuators, they still neglected the non-homogeneously polarization of the fibers, approximating the fibers in the unit cell as homogeneously polarized. H. Nasser et al. [10] used the finite element method to establish an FPC model containing interdigital electrodes, describing the situation where the presence of the electrodes causes uneven electric field distribution in the representative volume element (RVE) of the flexible piezoelectric composite FPC, but did not study the impact of electrode parameters on the electric field distribution. Deraemaeker et al. [11] employed a finite element periodic homogenization method to numerically homogenize the representative volume element (RVE), considering the complex interdigital electrodes and the local changes in polarization direction caused by curved electric field lines. However, when analyzing the component parameters, they only considered the effect of fiber volume fraction on the piezoelectric properties, without considering the impact of electrode parameters and the resulting changes in the distribution of curved electric field lines.
The use of the homogeneous field method to homogenize the electric field distribution or the piezoelectric active layer is a simplified model designed to effectively avoid issues such as excessive grid numbers and grid distortion. However, both methods neglect the component ratio and the geometric dimensions of each component in the FPC, and when designing and modifying component parameters, they fail to directly reflect the impact of parameter changes on the FPC's performance. As the application demands for FPC continue to grow, designing and customizing component parameters for FPC based on specific application scenarios has become crucial for engineering applications.
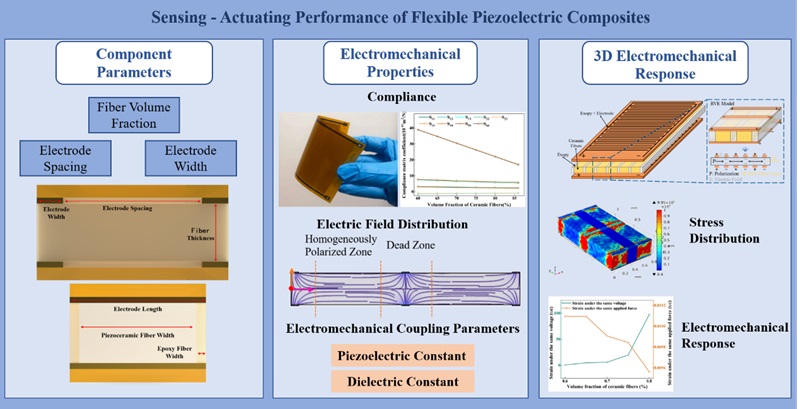
This paper employs a multi-scale analysis method to conduct a design analysis of parameters such as ceramic fiber volume fraction, flexible interdigital electrode width, and electrode spacing in FPC. It investigates the relationships between material performance char-acteristics-such as the electromechanical strain coefficient, dielectric coupling coefficient, and compliance matrix-and the material composition parameters. From the perspective of the underlying mechanism and electric field distribution, this paper provides a detailed analysis of how each component parameter influences the sensing/actuating performance of FPC, ultimately deriving the optimal component ratio for FPC. This provides a theoretical basis for designing and fabricating FPC based on application requirements.
The remain of the study is organized as follow. Section 2 introduces two component arrangement methods for FPC and their basic properties, using these as a basis to establish a model for FPC at the mesoscopic scale. In Section 3, using the established mesoscopic-scale RVE model, the paper analyzes the effects of component parameters such as ceramic fiber volume fraction, interdigital electrode width, and electrode spacing on the electromechanical properties of D33-type FPC, with further verification of the analysis results through a macroscopic homogenized piezoelectric active layer model. Section 4 compares and contrasts D31-type FPC and D33-type FPC, analyzing the effects of component parameters on the electromechanical properties of D31-type FPC and the underlying causes. Finally, Section 5 presents the conclusions.
2. Establishment of the finite element model for FPC at the mesoscopic scale
2.1. Modeling principle of the RVE (representative volume element)
From the geometric structure of the FPC, it is evident that there is a significant order-of-magnitude difference between the geometric dimensions of the interdigital electrodes (IDE) and the piezoelectric active layer. If the FPC entity model is established using a proportionally identical modeling method, and then finite element meshing is applied, small-sized structures such as the interdigital electrodes require extremely fine meshes for representation. A large number of meshes may lead to mesh distortion, high computational costs, and other issues during the calculation. Existing literature often replaces the complex interdigital electrodes (IDE) with a homogeneous electric field method, which to some extent ignores the interactions between different constituent materials within the FPC.
Therefore, a method for establishing the Representative Volume Element (RVE) is proposed to study the effects of various component parameters on the sensing/actuating performance of the FPC. In FPC, PZT fibers and epoxy resin matrix are alternately arranged, and since an FPC contains more than 50 fibers, it can be considered that the fiber distribution within the FPC exhibits periodicity. Meanwhile, the interdigital electrodes are arranged periodically in the direction orthogonal to the fibers. A micro-unit containing PZT fibers, the epoxy resin-filled matrix, and interdigital electrodes (IDE) can be selected as the representative volume element (RVE), as shown in Fig. 2, to conduct unit periodicity studies.
By applying periodic boundary conditions, the deformation between adjacent RVEs is continuous, and the FPC can be considered as a periodic array of RVEs. The RVE model has a linear relationship with the actual FPC in terms of deformation, meaning that the deformation of the RVE model multiplied by the number of periods equals the overall deformation of the FPC. By applying voltage to the electrodes and simulating positive and negative electrodes, electric field conditions can be constructed. In the RVE model, various component parameters can be directly observed and modified, including the width of the PZT fibers, the spacing of the PZT fibers (width of the epoxy resin-filled matrix), electrode width, and the spacing of the interdigital electrodes (IDE). This allows for the study of the effects of these parameters on the piezoelectric and mechanical properties of the FPC and facilitates the design of FPC component parameters.
Table 1 Geometrical parameters of RVE model components. |
| Components | Physical quantities | Symbols | Values |
|---|---|---|---|
| Piezoceramic fiber | Fiber width (mm) | Wf | 0.3 |
| Fiber spacing (mm) | Sf | 0.2 | |
| Fiber thickness (mm) | Hf | 0.3 | |
| Epoxy resin | Fiber width (mm) | Wi | 0.2 |
| Interdigitated electrodes | Finger center to center spacing (mm) | Si | 0.65 |
| Finger thickness | Hi | 0.01 |
2.2. Establishment of the RVE model
The RVE models for both D31-type and D33-type FPC include a unit model with 2 PZT fibers, 1 epoxy resin matrix, and 3 copper electrodes, as shown in Fig. 2. The geometric parameters of the structure in the RVE model are listed in Table 1. In this model, the copper electrode thickness is 0.01 mm, and the overall maximum dimension of the model is 1.9 mm. The size difference is relatively small, meeting the basic requirements for mesh division.
To construct the piezoelectric constitutive equation for the piezoelectric fibers based on the material parameters of PZT-5H, which will be used for finite element computation.
Where: cE represents the stiffness matrix under constant electric field, ${\epsilon }_{S}$ represents the dielectric constant matrix (second-order tensor 3×3 ) under constant strain, e represents the dielectric constant matrix (second-order tensor 3×3 ) under constant strain, T is the stress, s is the strain, E is the electric field, and D is the electric displacement.
The Stiffness Matrix of PZT-5H is a Fourth-Order 6×6 Tensor:
Based on the constituent materials, it is known that the FPC macrofiber piezoelectric composite is a typical orthotropic material. Therefore, the stiffness matrix can be further simplified as:
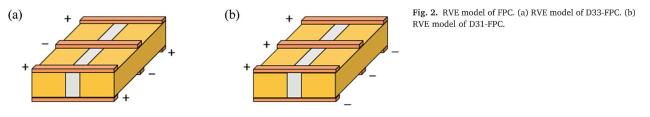
Fig. 2. RVE model of FPC.(a)RVE model of D33-FPC.(b)RVE model of D31-FPC. |
Table 2 Material properties of RVE components. |
| Components | PZT-5H | Epoxy resin | Copper |
|---|---|---|---|
| Young's modulus (GPa) | | 2.9 | 117.2 |
| Shear modulus (GPa) | | 1.11 | 43.41 |
| Poisson's ratio | | 0.3 | 0.35 |
| Piezoelectric constant (pC/N) | | - | - |
| Dielectric constant ( nF/m ) | | 0.0376 | 0.0443 |
Table 3 RVE model parameters for different PZT volume fractions. |
| PZT Volume Fractions | Model width (mm) | PZT fiber width (mm) | Epoxy resin fiber width (mm) |
|---|---|---|---|
| 60 % | 1 | 3/7 | 2/7 |
| 65 % | 1 | 13/27 | 7/27 |
| 70 % | 1 | 7/13 | 3/13 |
| 75 % | 1 | 3/5 | 2/5 |
| 80 % | 1 | 2/3 | 1/6 |
The calculation formulas for the parameters in the stiffness matrix are as follows:
$\left\{\begin{array}{l}{c}_{E11}=\frac{1-{v}_{23}{v}_{32}}{{E}_{2}{E}_{3}\mathrm{\Delta }}{c}_{E12}=\frac{{v}_{12}+{v}_{13}{v}_{32}}{{E}_{1}{E}_{3}\mathrm{\Delta }}\\ {c}_{E22}=\frac{1-{v}_{13}{v}_{31}}{{E}_{1}{E}_{3}\mathrm{\Delta }}{c}_{E13}=\frac{{v}_{13}+{v}_{12}{v}_{23}}{{E}_{1}{E}_{2}\mathrm{\Delta }}\\ {c}_{E33}=\frac{1-{v}_{12}{v}_{21}}{{E}_{1}{E}_{2}\mathrm{\Delta }}{c}_{E23}=\frac{{v}_{32}+{v}_{12}{v}_{31}}{{E}_{1}{E}_{3}\mathrm{\Delta }}\\ {c}_{E44}={G}_{23}\\ {c}_{E55}={G}_{31}\\ {c}_{E66}={G}_{12}\end{array}\right.$
Based on the model parameters, the RVE model is constructed using COMSOL, as shown in Fig. 3. In the RVE model, the six electrode regions are meshed. The length of the rectangular electrodes is divided into 50 elements, and the width of the rectangular electrodes is divided into 5 elements, using free tetrahedral meshing. In the region outside the electrodes (piezoelectric fibers and epoxy resin matrix), COMSOL's predefined refinement mesh is used, with the maximum element size set to 0.122 mm and the minimum element size set to 0.0153 mm.
3. Influence of fiber volume fraction on the electromechanical
properties of FPC
3.1. Influence of fiber volume fraction on D33-FPC performance
The piezoelectric active layer of FPC is composed of PZT and epoxy resin matrix arranged periodically with gaps. PZT provides the driving capability through its piezoelectric properties, generating charge when subjected to force and deforming when subjected to voltage excitation. Since piezoelectric ceramics like PZT are brittle and prone to cracking, the epoxy resin matrix surrounding the PZT fibers enhances the strength and toughness of the FPC, providing a path for load transfer. As the primary sensing/actuating material, the volume fraction of piezoelectric fibers in the FPC significantly affects its application performance. The influence of fiber volume fraction on FPC is examined from two aspects: first, its effect on the piezoelectric properties of FPC, i.e., the sensing/actuating performance, which requires calculating the microstrain of the RVE unit under the same voltage conditions, or calculating the RVE charge output under the same load conditions; second, its effect on the material elasticity of FPC, i.e., whether the FPC retains its compliance and bending characteristics, which requires calculating the microstrain of the RVE unit under the same load conditions.
To ensure that the strain of the RVE under the same conditions is only affected by the fiber volume fraction, the geometric dimensions of the RVE are kept constant, and only the component ratio inside the piezoelectric fiber layer is changed by setting the width and spacing of the PZT fibers to adjust the fiber volume fraction.
3.2. Influence of fiber volume fraction on D33-FPC performance
As shown in Fig. 4, with the increase in fiber volume fraction, the strain of the FPC decreases under the same load. The strain in a solid under external force is determined by the stiffness of the material. The structural stiffness of a material is a physical quantity that measures its ability to resist deformation under load. Under the same force load, the greater the material's structural stiffness, the stronger its resistance to deformation, resulting in smaller strain. The stiffness of the piezoelectric active layer composed of PZT and epoxy resin matrix in FPC is the primary factor influencing the stiffness and compliance of the FPC. PZT has a relatively high stiffness, while the stiffness of the epoxy resin matrix is smaller. As the PZT fiber content increases, the effect of PZT stiffness on the piezoelectric active layer stiffness becomes more significant, leading to an increase in the stiffness of the active layer, which in turn increases the overall stiffness of the FPC and reduces its compliance. In Section 3.2, the stiffness/compliance of the FPC's piezoelectric active layer will be calculated using the mixing rule, and theoretical data will be used to further verify the phenomenon that as the PZT fiber volume fraction increases, the strain of the FPC under the same load decreases.
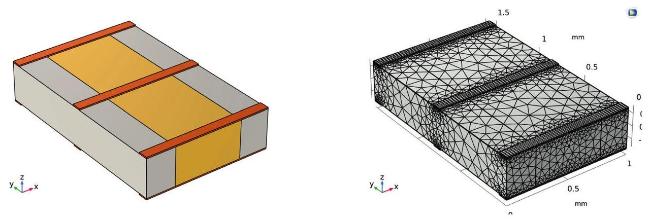
Fig. 3. (a)RVE model. (b) mesh scheme. |
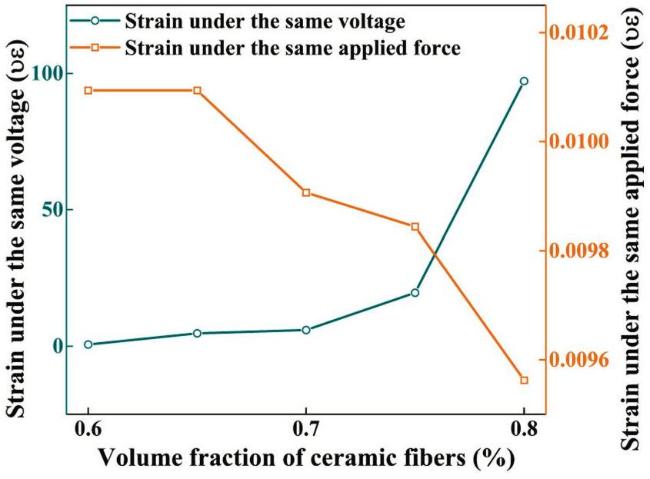
Fig. 4. Variation of strain with fiber volume fraction for D33-RVE under the same electromechanical conditions. |
At the same time, as the fiber volume fraction increases, the strain of the FPC increases under the same electric potential. When the fiber volume fraction is below 70%, the strain of the RVE model increases slightly with the increase in fiber volume fraction. However, when the fiber volume fraction exceeds 75%, the strain increases significantly. When a voltage is applied to the interdigitated electrodes (IDE) of the FPC, strain is generated in the FPC, primarily due to the piezoelectric active layer composed of PZT fibers and epoxy resin matrix. The piezoelectric effect of the active layer is more pronounced when the piezoelectric constant is larger, leading to higher strain in the FPC. The piezoelectric constant of the active layer is mainly determined by the piezoelectric ceramic fibers. As the fiber volume fraction increases, the piezoelectric active layer becomes closer to a piezoelectric ceramic plate, which increases the piezoelectric constant and enhances the piezoelectric effect.
Due to the complex influence of the PZT fiber volume fraction on the mechanical and electromechanical parameters of the FPC piezoelectric active layer, the relationship is not simply linear. As the PZT fiber volume fraction increases, the changes in the stiffness matrix parameters of the FPC piezoelectric active layer are non-linear. Although the variation of the FPC under force load follows a linear relationship with stiffness, the non-linear relationship between the stiffness parameters and the PZT fiber volume fraction leads to a non-linear strain response for FPCs with different fiber volume fractions under the same force load. Additionally, the relationship between the PZT fiber volume fraction and the electromechanical coupling parameters, such as the piezoelectric constant and dielectric constant, which affect the piezoelectric effect, is also non-linear. This results in non-linear strain variations in FPCs with different fiber volume fractions under the same voltage load, as shown in Fig. 4. When the PZT fiber volume fraction is below 75%, the strain of D33-FPC under the same voltage load increases slowly; when the PZT fiber volume fraction exceeds 75%, the strain of D33-FPC increases rapidly under the same voltage load. Furthermore, the presence of interdigital electrodes affects the stiffness, stress distribution, and electric field distribution of the FPC, which means that the strain of the FPC under certain electromechanical conditions is also influenced by the interdigital electrodes and does not vary linearly with the PZT fiber volume fraction.
3.3. Influence of fiber volume fraction on D31-FPC performance
When the FPC operates in the D31 mode, the structure of the piezoelectric active layer is the same as that of the D33-type FPC, with the only difference being the arrangement of the interdigitated electrodes. Therefore, similar to the D33-FPC, changing the fiber volume fraction affects the compliance parameters and piezoelectric constants of the piezoelectric active layer. The change in fiber volume fraction influences the mechanical properties of the active layer and the FPC in the same manner as it does for the D33-FPC. However, since the D31-FPC operates using the D31 effect of the piezoelectric active layer, the piezoelectric constant is the main factor affecting the sensing/actuating performance. As a result, the piezoelectric characteristics of the D31FPC with different fiber contents differ from those of the D33-FPC.
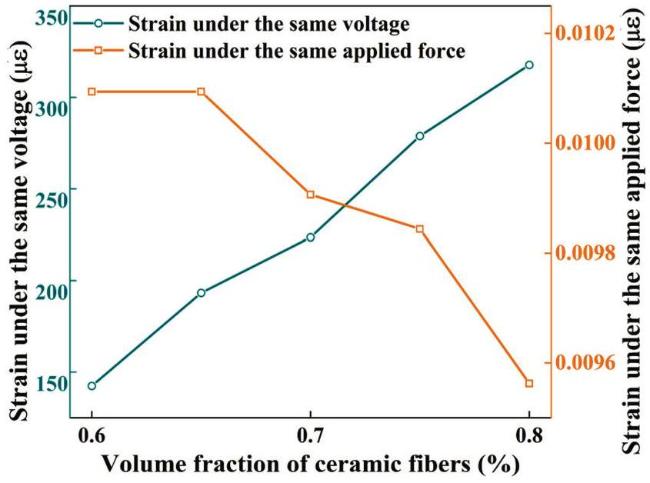
Fig. 5. Variation of strain with fiber volume fraction for D31-RVE under the same electromechanical conditions. |
To investigate the actuating performance of the D31-FPC, a voltage of 400 V is applied to the positive electrode on the upper surface of the RVE model, and 0 V is applied to the negative electrode on the lower surface of the model. The strain under these potential conditions is calculated by simulation, and the actuating performance of the D31FPC with different fiber volume fractions is examined, as shown in Fig. 5. When the fiber volume fraction in the RVE model increases, the strain under the same voltage condition increases, and the actuating effect significantly improves. From a theoretical perspective, the piezoelectric constant of the active layer increases in absolute value with the increase in fiber volume fraction, enhancing the piezoelectric effect.
In comparison with the D33-FPC, since the piezoelectric constant of the D33-FPC is greater than that of the D31-FPC, the strain output of the D33-FPC is higher under the same voltage.
3.4. Influence of fiber volume fraction on the electromechanical coupling parameters of D33-FPC and D31-FPC
According to the mixing rule, the piezoelectric active layer, composed of a polymer matrix and epoxy resin arranged in a periodic pattern, can be equivalently homogenized into a uniform material. The properties of this uniform material are related to the properties of the two constituent materials and their respective proportions. Specifically, the material parameters of the piezoelectric active layer in the flexible piezoelectric composite (FPC) - including the elastic stiffness matrix, dielectric constant matrix, piezoelectric constant matrix, etc. - are related to the PZT-5H and epoxy resin used, as well as their volume fractions. The relationship is as follows:
where, Vp represents the PZT fiber volume fraction in the FPC, and Vm represents the volume fraction of the epoxy resin matrix in the FPC; ${E}_{i}^{p}(i=\mathrm{1,2},3),{G}_{ij}^{p}(i,j=\mathrm{1,2},3),{v}_{ij}^{p}(i,j=\mathrm{1,2},3)$ represent the Young's modulus, shear modulus, and Poisson's ratio of PZT-5H, respectively; ${E}_{i}^{m}(i=\mathrm{1,2},3),\mathrm{ }{G}_{ij}^{m}(i,j=\mathrm{1,2},3),\mathrm{ }{v}_{ij}^{m}(i,j=\mathrm{1,2},3)\mathrm{ }$ represent the Young's modulus, shear modulus, and Poisson's ratio of the epoxy resin matrix, respectively; ${E}_{i}^{c}(i=\mathrm{1,2},3),{G}_{ij}^{c}(i,j=\mathrm{1,2},3),{v}_{ij}^{c}(i,j=\mathrm{1,2},3)$ represent the Young's modulus, shear modulus, and Poisson's ratio of the FPC piezoelectric active layer, respectively.
The stress-strain relationship of the anisotropic FPC piezoelectric active layer can be represented by the compliance matrix S
The parameters in the compliance matrix are calculated from the Young's modulus ${E}_{i}^{c}(i=\mathrm{1,2},3)$ , shear modulus ${G}_{ij}^{c}(i,j=\mathrm{1,2},3)$ , and Poisson's ratio ${v}_{ij}^{c}(i,j=\mathrm{1,2},3)$
The stiffness matrix C of the FPC is the inverse of the compliance matrix S
First, the effect of the PZT fiber volume fraction on the mechanical stiffness/compliance of the PZT is analyzed. The structural stiffness/ compliance parameters of the FPC's piezoelectric active layer are calculated for different PZT fiber volume fractions, as shown in Fig. 6. From Fig. 6(a) and (b), it can be seen that as the PZT fiber volume fraction increases, the Young's modulus, shear modulus, and Poisson's ratio of the FPC's piezoelectric active layer change. The material's compliance matrix parameters as a function of the PZT fiber volume fraction are calculated using Eqs. (3.8) and (3.9), as shown in Fig. 6(c). It can be observed that the compliance matrix parameters in all directions of the FPC's piezoelectric active layer decrease as the PZT fiber volume fraction increases, meaning the FPC's stiffness increases, and compliance decreases. When the FPC is placed on an irregular structure surface for sensor and actuator applications in curved structures, it is important to ensure that the FPC has a certain level of flexibility to allow bending. Therefore, an appropriate PZT fiber volume fraction should be selected, and the fiber volume fraction should not exceed 80 %.
Next, the effect of the PZT fiber volume fraction on the piezoelectric performance of the PZT is analyzed. The piezoelectric constant and dielectric constant of the FPC piezoelectric active layer are calculated for different PZT fiber volume fractions, as shown in Fig. 6. From Fig. 6(d) and (e), it can be seen that as the PZT fiber volume fraction increases, the values of d33 and d31 increase. That is, the piezoelectric constants in the length and thickness directions of the D33-FPC and D31-FPC increase as the PZT fiber volume fraction increases. The piezoelectric constant reflects the electromechanical coupling strength of the FPC. As the PZT fiber volume fraction increases, the piezoelectric constant of the FPC's piezoelectric active layer increases, leading to a higher charge output when the FPC is used as a sensor and a greater displacement when used as an actuator. As shown in Fig. 6(f), as the PZT fiber volume fraction increases, the values of the dielectric constants also increase. The dielectric constant reflects the polarization ability of the FPC. As the PZT fiber volume fraction increases, the dielectric constant of the FPC's piezoelectric active layer increases, making the FPC more easily polarized under an applied electric field, which improves the energy conversion efficiency. However, a higher dielectric constant may cause energy loss in the material, converting some of the energy into heat, which reduces the sensor output voltage or actuator displacement.
From the above analysis, it can be concluded that the stiffness/ compliance, piezoelectric constant, and dielectric constant of the FPC all affect its electromechanical coupling characteristics. A higher piezoelectric constant, moderate dielectric constant, and appropriate flexibility are more favorable for improving the electromechanical coupling properties of the FPC, thereby enhancing its sensing-actuating performance. When the fiber volume fraction of the FPC is 75%, its piezoelectric constant, dielectric constant, and compliance reach a balance, enabling better electromechanical energy conversion and enhancing the sensing-actuating performance of the FPC.
4. Influence of electrode geometrical parameters on the electromechanical properties of FPC
4.1. Electric field distribution in D33-FPC and D31-FPC
4.1.1. Electric field distribution in D33-FPC
In FPC, the upper and lower surfaces are covered with a polyimide film, on which interdigitated copper electrodes are etched in a crosspattern. When the FPC operates in the D33 mode, the positive and negative electrodes are arranged alternately in a periodic manner, and the distribution of electrodes and electric potential conditions on both surfaces are identical. As a result, the electric field distribution within the D33-FPC is symmetric about the xOy midplane. The electric field distribution in the RVE model of the D33-FPC is shown in Fig. 7. The electric field lines are directed from the positive electrode to the negative electrode. Below the electrodes, the electric field lines are densely packed, with the field direction primarily pointing downward, resulting in a larger longitudinal electric field component and a smaller transverse component. In the region between the electrodes, the electric field lines are more sparse, with the field direction aligning predominantly along the direction parallel to the ceramic fibers, meaning that the transverse electric field component is more significant while the longitudinal component is near zero.
In the RVE model, based on the electric field distribution, the model can be divided into two regions along the direction parallel to the fibers (y-direction): the dead zone (ineffective region) and the homogeneously polarized zone (effective region). Dead Zone (Ineffective Region): This region is located under the interdigitated electrodes, where the longitudinal electric field is non-homogeneously distributed. Homogeneously Polarized Zone (Effective Region): This region lies between the interdigitated electrodes, where the longitudinal electric field is homogeneously distributed.
During the operation of the FPC, the primary contributing factor is the electric field in the homogeneously polarized zone, while the electric field in the dead zone has a negligible effect on the actuation/ sensing performance of the FPC. Taking D33-FPC as an example, when the FPC is used as a sensor, the D33 effect causes the FPC to generate an electric field in the direction parallel to the fiber when subjected to a force perpendicular to the fiber direction. The voltage difference measured across the interdigitated electrodes is caused by the electric field in the fiber direction. When the FPC is used as an actuator, applying a potential across the interdigitated electrodes results in the electric field distribution shown in Fig. 7. However, only the electric field component parallel to the fiber direction can be converted into a force perpendicular to the fiber direction through the piezoelectric effect, thus controlling the deformation of the structure.
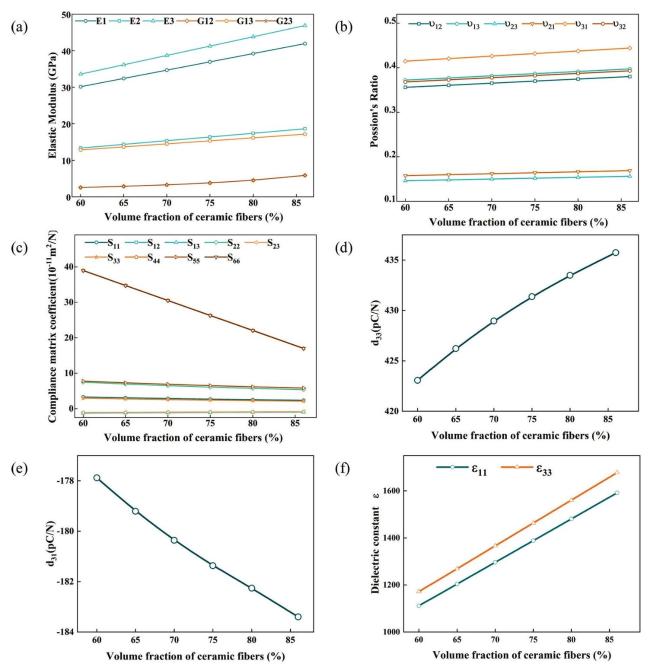
Fig. 6. (a) Effect of ceramic fiber volume fraction on the elastic modulus of the piezoelectric active layer. (b) Effect of ceramic fiber volume fraction on the Possion's Ratio of the piezoelectric active layer. (c) Effect of ceramic fiber volume fraction on the compliance of the piezoelectric active layer. (d) Effect of ceramic fiber volume fraction on the piezoelectric constant d33 of the piezoelectric active layer. (e) Effect of ceramic fiber volume fraction on the piezoelectric constant d31 of the piezoelectric active layer. (f) Effect of ceramic fiber volume fraction on the Dielectric Constant of the piezoelectric active layer. |
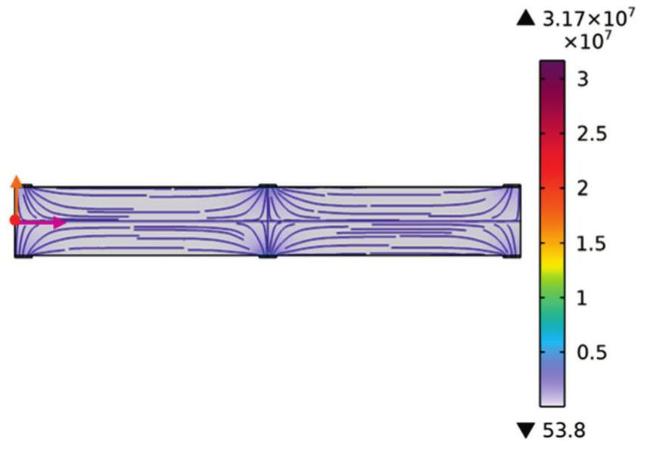
Fig. 7. Electric field distribution in the yOz plane of the RVE model for D33FPC. |
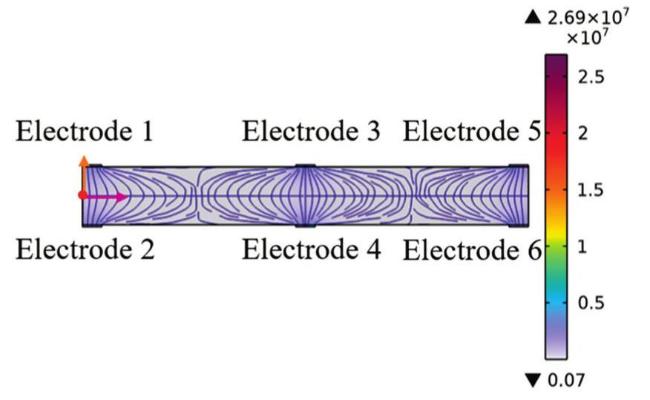
Fig. 8. Electric field distribution in the yOz plane of the RVE model for D31FPC. |
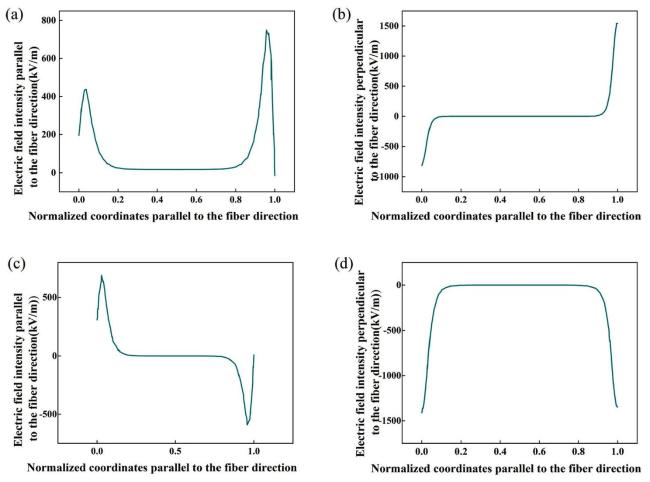
Fig. 9. (a) Electric field intensity parallel to the fiber direction for D33-Type FPC; (b) Electric field intensity perpendicular to the fiber direction for D33-Type FPC; (c) Electric field intensity parallel to the fiber direction for D31-Type FPC; (d) Electric field intensity perpendicular to the fiber direction for D31-Type FPC. |
Therefore, the larger electric field component parallel to the fiber direction in the homogeneously polarized zone plays the dominant role in the sensing/actuating function of the FPC, while the electric field component parallel to the fiber direction in the dead zone is minimal and has virtually no impact on the FPC's sensing/actuating performance. Examining the proportion of the homogeneously polarized zone between two adjacent electrodes in the RVE model is an effective method for evaluating the sensing/actuating performance of the FPC.
4.1.2. Electric field distribution in D31-FPC
When the FPC operates in the D31 mode, the positive and negative electrodes are distributed on the top and bottom surfaces of the FPC, respectively. The positive electrodes on the top surface are evenly spaced at regular intervals, while the negative electrodes on the bottom surface are also evenly distributed with the same interval. Therefore, the internal electric field lines in the D31-FPC primarily point vertically through the ceramic fibers, from the top surface to the bottom surface.
The internal electric field distribution of the RVE model of the D31FPC is shown in Fig. 8. Since both the positive and negative electrodes of the D31-FPC are arranged at equal intervals on the top and bottom surfaces, with a certain distance between each pair of positive and negative electrodes, interference occurs between adjacent electrode pairs. As a result, the internal electric field distribution of the D31-FPC is non-uniform. The electric field lines are not straight lines pointing from the top surface to the bottom surface. Instead, as shown in Fig. 8, the electric field lines start from the positive electrode 3 and point towards the adjacent positive electrode 4, while also pointing towards the negative electrodes 2 and 6 in the neighboring electrode pairs, generating an electric field component parallel to the fiber direction. The electric field lines from the positive electrode 3 to the negative electrodes 2 and 6 are affected by the adjacent positive electrodes 1 and 5, leading to repulsion between the positive electrodes and interfering with the direction of the electric field lines, causing them to bend. In the region directly below the positive electrode, the electric field lines are mostly straight, meaning the electric field component perpendicular to the fiber direction is larger, while the electric field component parallel to the fiber direction, influenced by adjacent electrodes, is smaller. In the regions between electrode pairs, the closer the distance between adjacent electrodes, the greater the interference from the neighboring electrode pairs' electric fields, which increases the parallel component along the fiber direction and the degree of bending of the electric field lines. Due to the interaction between the electrodes, along the central axis between electrode pairs, there is only the electric field component perpendicular to the fiber direction.
Due to the different electrode distribution configurations between the D31-FPC and D33-FPC, the electric field distributions parallel and perpendicular to the fiber direction differ. Fig. 9 shows the electric field distribution in both the parallel and perpendicular directions to the fiber axis for both D33-FPCand D31-FPC.
4.1.3. Effect of interdigital electrode spacing on the performance of D33-FPC
As shown in Fig. 9(d), the distribution of the electric field component perpendicular to the fiber direction (z-direction) between the midlines of two adjacent interdigital electrodes in the RVE model of D31-type FPC is presented. Similar to the electric field analysis method for D33-type FPC, the coordinate along the fiber direction (y-direction)
between adjacent electrodes is normalized. The horizontal axis represents the distance from the point of interest to the midline of the electrode in the fiber direction, normalized by the electrode spacing. This ratio, ranging from 0 to 1, reflects the position of the point of interest relative to the reference electrode midline along the fiber direction.
between adjacent electrodes is normalized. The horizontal axis represents the distance from the point of interest to the midline of the electrode in the fiber direction, normalized by the electrode spacing. This ratio, ranging from 0 to 1, reflects the position of the point of interest relative to the reference electrode midline along the fiber direction.
Below the electrodes, the electric field perpendicular to the fiber direction is relatively large. As the point approaches the gap between the two electrodes, the electric field component perpendicular to the fiber direction decreases. The rate at which the perpendicular electric field decreases also slows down (the slope decreases), which corresponds to the distribution of the electric field lines in the yOz plane (Fig. 8). The field lines become sparser as they move from the region beneath the electrodes towards the gap, until the electric field component perpendicular to the fiber direction becomes negligible.
According to the criteria for the dead zone and homogeneously polarization zone, the electric field distribution in the RVE model can be divided into dead zone and homogeneously polarization zone. As shown in the Fig, the region where the electric field component perpendicular to the fiber direction is zero is defined as the homogeneously polarization zone, while the other regions are considered the dead zone. By examining the corresponding ratio on the horizontal axis, the proportions of the homogeneously polarization zone and the dead zone can be determined.
The piezoelectric mechanisms of D31-type and D33-type FPC differ, leading to variations in the effective electric field. As an actuator, when a D31-type FPC is subjected to a force in the direction perpendicular to the fiber, the D31 piezoelectric effect causes charges to move in the direction perpendicular to the ceramic fibers, generating an electric field in this direction, which induces positive and negative charges on the upper and lower electrodes of the D31-FPC, respectively. As a sensor, when a positive voltage is applied to the upper electrode and 0 V is applied to the lower electrode of the D31-type FPC, the FPC is polarized in the vertical direction, and the electric field perpendicular to the fiber direction causes deformation according to the inverse piezoelectric effect, generating a force perpendicular to the fiber direction.
In the sensing/actuating operations of D31-FPC, the acting electric field is perpendicular to the fiber direction. Therefore, the evaluation of the sensing/actuating performance needs to focus on the polarization effects and electric field components in the direction perpendicular to the fibers.
Fig. 10 illustrates the distribution of the electric field component perpendicular to the ceramic fiber direction (z-direction) in the RVE model of D33-type FPC, between the midlines of two adjacent interdigital electrodes. Since adjusting the electrode width and spacing alters the distance between adjacent electrodes, the coordinate along the fiber direction ( y-direction) between adjacent electrodes is normalized. The horizontal axis represents the distance from the electrode midline to the point of interest in the fiber direction, normalized by the electrode spacing. This ratio, ranging from 0 to 1, reflects the position of the point of interest relative to the reference electrode midline along the fiber direction.
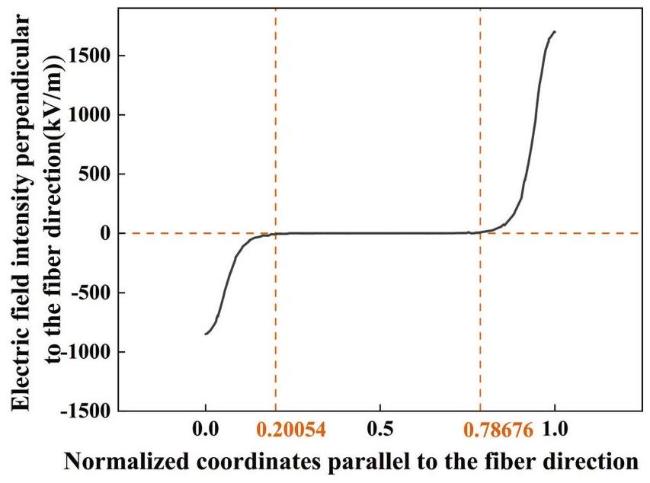
Fig. 10. Distribution of the electric field component perpendicular to the fiber direction between electrodes for D33-type FPC (the horizontal axis representing the normalized coordinate parallel to the electric field direction, i.e., the ratio of the distance from the observation point to the electrode centerline to the electrode spacing). |
Below the electrodes, the electric field perpendicular to the fiber direction is relatively large. As the point approaches the gap between two electrodes, the electric field component perpendicular to the fiber direction decreases. The rate at which the perpendicular electric field decreases also slows down (the slope decreases). This corresponds to the electric field distribution in the yOz plane (Fig. 7), where the electric field lines become sparse as they move from the region below the electrodes toward the gap, until the electric field component perpendicular to the fiber direction becomes negligible.
According to the criteria for the dead zone and homogeneously polarization zone, the electric field distribution in the RVE model can be divided into the dead zone and homogeneously polarization zone, as shown in Fig. 10. The region where the electric field component perpendicular to the fiber direction is zero corresponds to the homogeneously polarization zone, while the other regions are classified as the dead zone. From the corresponding ratio on the horizontal axis, the proportion of the homogeneously polarization zone and the dead zone can be determined.
On the upper and lower surfaces of the FPC, a polyimide film is coated, and copper electrodes are etched in a crossed pattern on the film. When the FPC operates in D33 mode, the electrodes are arranged in a periodic alternating pattern with positive and negative electrodes. The electrode spacing affects the polarization effect and actuation performance of the FPC. When the electrode spacing is altered, applying the same voltage potential across the electrodes results in different electric field distributions. In this study, we model and analyze the commonly used electrode parameters in manufacturing, keeping the electrode width fixed at 0.075 mm, and modify the electrode spacing in the RVE model. The electric field distribution between adjacent electrodes is investigated for electrode spacings of 0.65 mm, 1 mm,1.5 mm, and 2 mm.
Fig. 11 shows the electric field strength perpendicular to the fiber direction between two electrodes of the FPC RVE model for four different electrode spacings. As the electrode spacing increases, the distance between the two inflection points of the electric field strength curve increases, indicating an increase in the proportion of the homogeneously polarization zone. The proportions of the homogeneously polarization zone and the dead zone for each electrode spacing are calculated and presented in Table 4. As shown in Fig. 11, with increasing electrode spacing, the proportion of the homogeneously polarization zone between the two electrodes clearly increases, while the proportion of the dead zone decreases. This is because a larger electrode spacing provides sufficient space for the electric field distribution transition. The dead zone, also referred to as the transition zone, is influenced by the interdigital electrodes, where the electric field near the electrodes is relatively strong and changes rapidly. After passing through the transition zone, the electric field distribution stabilizes in magnitude and direction, providing a stable and reliable electric field for actuation/sensing.
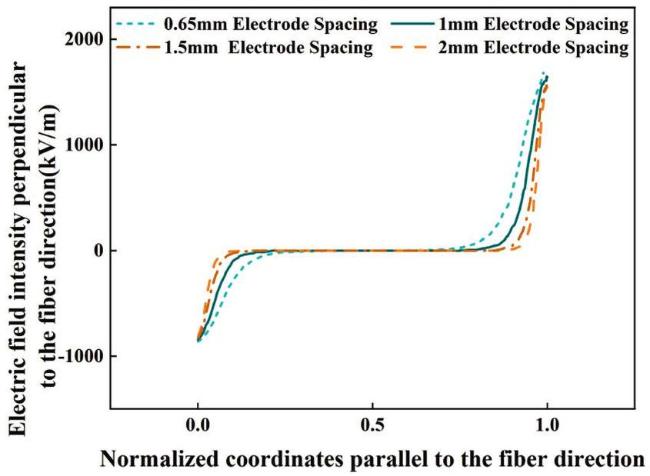
Fig. 11. Effect of electrode spacing on the electric field intensity perpendicular to the fiber direction for D33-FPC. |
Table 4 Effect of electrode spacing on the proportions of homogeneously polarization zone and dead zone in D33-FPC. |
| Electrode spacing (mm) | 0.65 | 1 | 1.5 | 2 |
|---|---|---|---|---|
| Homogeneously polarization zone | 43.249% | 57.106% | 70.586% | 79.995% |
| Dead zone | 56.751% | 42.894% | 29.414% | 20.005% |
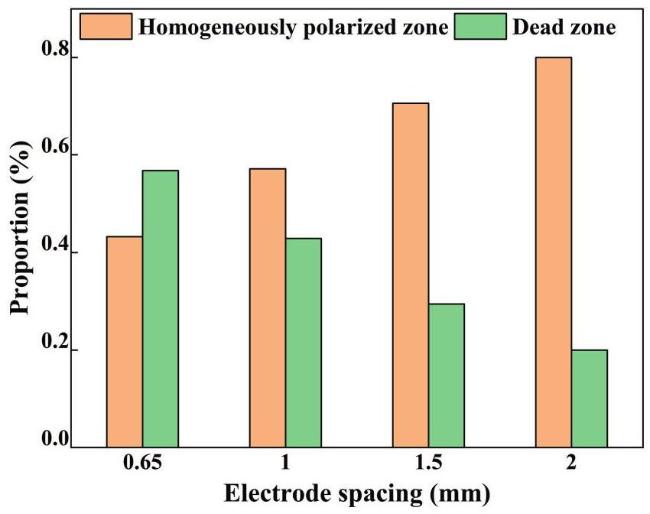
Fig. 12. Effect of electrode spacing on the electric field distribution region for D33-FPC. |
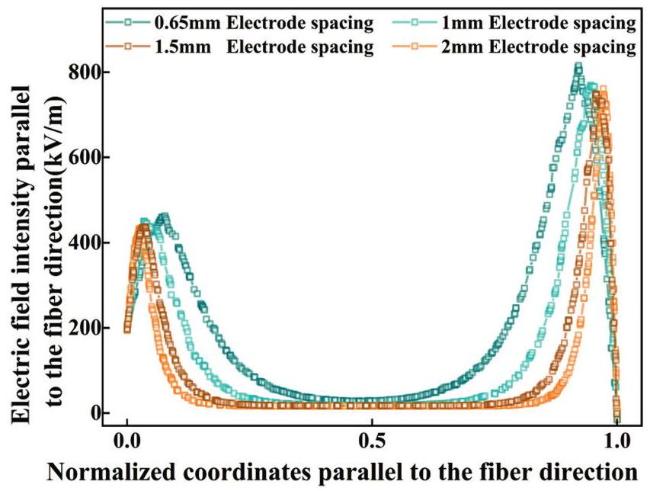
Fig. 13. Effect of electrode spacing on the electric field intensity parallel to the fiber direction for D33-FPC. |
The lengths of the homogeneously polarization zone (effective zone) and the dead zone (transition zone) in the mesoscopic FPC model for different electrode spacings are calculated and their proportions are determined, as shown in Table 4. Fig. 12 illustrates the impact of electrode spacing on the electrode distribution regions in the FPC. As the electrode spacing increases, the proportion of the homogeneously polarization zone increases, while the proportion of the dead zone decreases.
The electric field component parallel to the fiber direction in the FPC model with different electrode spacings is shown in the Fig. Due to the normalization of the coordinate system for the parallel-to-fiber direction (y-direction) between adjacent electrodes, the long distance is compressed. Therefore, when the electrode spacing changes, the slope of the increase/decrease in the electric field strength perpendicular to the fiber direction at the same position varies. Specifically, when the electrode spacing is large, a longer distance between the electrodes occupies a smaller proportion, resulting in a steeper slope for the increase/decrease in the electric field strength perpendicular to the fiber direction. Since the x-axis has been normalized, this graph can only represent the proportion of the dead zone and the homogeneously polarization zone and the trend of the longitudinal electric field variation, but it cannot visually represent the rate of change of the longitudinal electric field.
Fig. 13 shows the distribution of the electric field perpendicular to the fiber direction between adjacent electrodes of the D33-type FPC for different electrode spacings. In the region beneath and near the electrodes, the parallel-to-fiber electric field component first increases to a peak value, then decreases and stabilizes at a relatively small value close to zero, less than 50kV/m. This indicates that in the homogeneously polarization zone, the lateral electric field component affecting the sensing/actuation effect remains constant in magnitude, but the electric field intensity is small. In the dead zone (beneath the electrodes), the lateral electric field strength increases sharply and reaches a peak. The two maximum lateral electric field strengths in the dead zones are different because the RVE model used for simulation includes three electrodes. The leftmost electrode is a positive electrode at the far-left end, and the electric field distribution beneath this electrode is mainly driven by the voltage difference between this electrode and the adjacent right electrode, without being influenced by other electrodes. In contrast, the second peak in the graph is larger because the electrode in question is adjacent to electrodes on both sides, and the electric field distribution is primarily influenced by the voltages of the three electrodes, increasing the effect of the right-side positive electrode. It is important to note that while the parallel-to-fiber electric field component increases sharply in the electric field dead zone (beneath the electrodes), it is still relatively small compared to the per-pendicular-to-fiber electric field component. Therefore, the resultant electric field lines primarily point in the direction perpendicular to the fiber.
Comparing the parallel-to-fiber electric field component in the homogeneously polarization zone of models with different electrode widths, as the electrode spacing increases, the parallel-to-fiber electric field component in the homogeneously polarization zone decreases. This may lead to a weakening of the polarization effect and actuation characteristics of the FPC, which is contrary to the trend of the homogeneously polarization zone proportion. Therefore, the comprehensive effect of the electrode spacing on the FPC performance should be evaluated by considering both the change in the proportion of the homogeneously polarization zone and the electric field strength. The optimal electrode spacing should be selected based on this evaluation. As shown in Fig. 14, as the electrode spacing increases, the parallel-tofiber electric field strength (i.e., the dominant electric field strength) between the two electrodes in the homogeneously polarization zone decreases, while the proportion of the homogeneously polarization zone increases. When the electrode spacing approaches 1 mm, the proportion of the homogeneously polarization zone and the parallel-tofiber electric field strength are both at an optimal level. Therefore, an electrode spacing of 1 mm is selected as the optimal parameter.
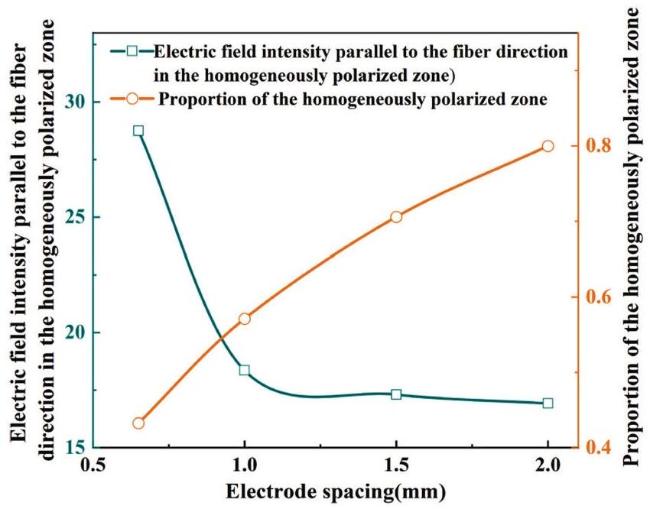
Fig. 14. Variation trend of the applied electric field intensity and effective electric field area ratio with electrode spacing in D33-FPC. |
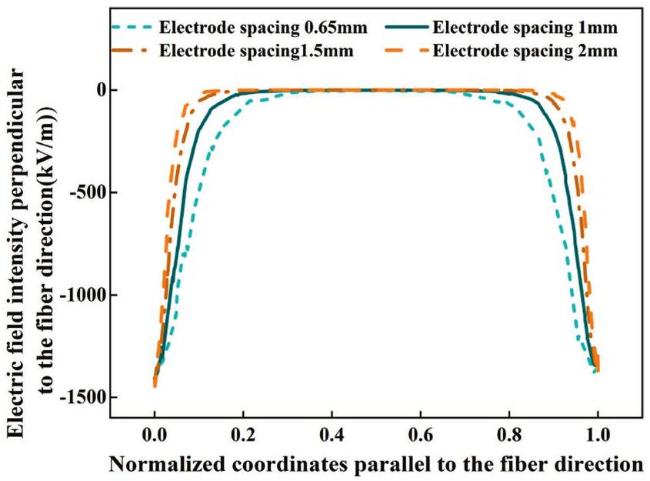
Fig. 15. Effect of electrode spacing on the electric field distribution perpendicular to the fiber direction for D31-FPC. |
4.1.4. Effect of interdigital electrode spacing on the performance of D31FPC
In a D31-type FPC, the positive and negative electrodes are distributed on the upper and lower surfaces of the FPC, respectively. The internal electric field primarily points perpendicular to the fiber direction. When the spacing between the electrodes arranged parallel to the fiber direction is changed, the impact on the electric field strength perpendicular to the fiber direction is relatively small. The primary effect is on the stable homogeneously polarization zone between the electrodes. Fig. 19 shows the impact of changing the electrode spacing on the distribution of the electric field perpendicular to the fiber direction in the D31-FPC. The electric field strength in Fig. 15 is negative, indicating that the direction of the electric field is perpendicular to the fiber, from the upper surface to the lower surface. For different electrode spacings, the electric field strength in the stable homogeneously polarization zone perpendicular to the fiber direction remains constant and unaffected by the electrode spacing. However, as the electrode spacing increases, the proportion of the homogeneously polarization zone in the D31-FPC increases. The length of the homogeneously polarization zone for different electrode spacings is calculated, with the results shown in Table 5 and Fig. 16. As the electrode spacing increases from 0.65 mm to 2 mm, the proportion of the homogeneously polarization zone increases from 14.541 % to 69.081 %. This is because increasing the electrode spacing provides enough space for the electric field distribution to transition from the unstable region beneath the electrodes to the stable region between the electrodes. The dead zone, also known as the transition zone, is influenced by the forked electrodes, where the electric field is stronger and changes steeply near the electrodes. After passing through the transition zone, the electric field distribution becomes more stable in magnitude and direction, providing a stable and reliable field for actuation/sensing.
Table 5 Effect of electrode spacing on the proportions of homogeneously polarization zone and dead zone in D31-FPC. |
| Electro spacing (mm) | 0.65 | 1 | 1.5 | 2 |
|---|---|---|---|---|
| Homogeneously polarization zone | 14.541 % | 37.431 % | 57.618 % | 69.081 % |
| Dead zone | 85.459 % | 62.569 % | 42.382 % | 30.919 % |
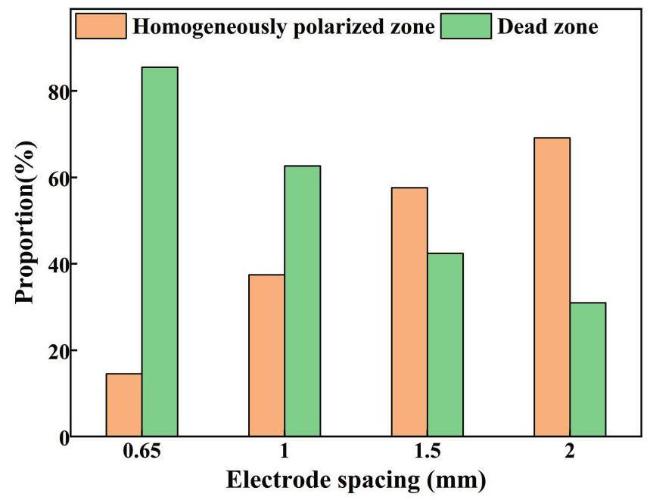
Fig. 16. Effect of electrode spacing on the electric field distribution region for D31-FPC. |
During polarization, the alignment of the electric dipoles inside the FPC matches the direction of the electric field. Uniform polarization ensures that the dipoles are uniformly aligned in the same direction. When the FPC is used for sensing-actuation, the piezoelectric effect depends on the orientation of the electric dipoles within the material, ensuring that the dipoles respond to the applied electric field perpendicular to the fiber direction, uniformly generating sensing output charge or actuation displacement. However, the non-uniform electric field distribution in the dead zone prevents the material from being uniformly polarized. During sensing-actuation, larger responses are generated in local areas with higher electric field intensity. But due to the overall non-uniformity of the FPC, the overall piezoelectric energy conversion efficiency of the FPC is reduced. Additionally, in vibration sensing applications, under random vibration frequencies, the nonuniform electric field in the dead zone may introduce noise, causing unstable sensing output voltage. Therefore, when designing the electrode parameters for the FPC, the proportion of the dead zone should be reduced, and the proportion of the homogeneously polarized region should be increased to ensure the stability of the internal polarization and the uniformity of the material's energy conversion.
Compared to the D33-type FPC, the proportion of the homogeneously polarization zone in the internal electric field distribution of the D31-type FPC is smaller. This is because the electric field lines in the D31-FPC mainly point perpendicular to the fiber direction, and the forked electrodes have a smaller effect on the polarization level and electric field distribution in the parallel-to-fiber direction.
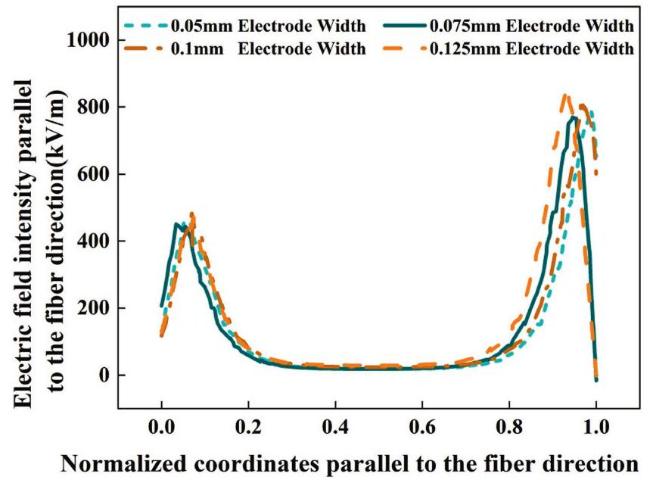
Fig. 17. Effect of electrode width on the electric field intensity parallel to the fiber direction for D33-Type FPC. |
Increasing the electrode spacing significantly increases the proportion of the homogeneously polarization zone in the internal electric field of the D31-FPC, thereby enhancing the polarization effect and actuation/sensing performance. However, when the length of the piezoelectric active region is fixed (i.e., when the total length of the forked electrode arrangement is constant), increasing the electrode spacing will reduce the number of electrodes, weakening the polarization effect and actuation/sensing performance of the FPC. Therefore, the electrode spacing in a D31-FPC should be set by simultaneously considering the length of the piezoelectric active region to ensure that the number of electrodes is sufficient to meet the electric field driving requirements for actuation and sensing.
4.2. Effect of interdigital electrode width on the performance of two different types of FPC
4.2.1. Effect of interdigital electrode width on the performance of D33-FPC
Electrode parameters include both electrode spacing and electrode width, and the electrode width has a significant impact on the polarization effect and the actuation/sensing performance of FPC. After determining the optimal electrode spacing, the next step is to analyze the width of the forked electrodes. When the electrode width changes, applying the same electric potential conditions to the FPC electrodes will result in different electric field distributions, which in turn affects the polarization and actuation performance.
A mesoscopic analysis model of FPC with an optimal electrode spacing of 1 mm was established, and the effect of varying electrode width on the FPC performance was studied. By selecting 1 mm as the electrode spacing, we also ensure that the ratio of electrode width to spacing is appropriate, preventing an imbalance in the electrode distribution that could affect the overall compliance of the FPC.
Fig. 17 shows the distribution of the electric field component parallel to the fiber direction between two adjacent electrode midlines in RVE models with different electrode widths. From the distribution of the parallel-to-fiber electric field component, it can be seen that in the homogeneously polarization zone, the transverse electric field component that affects the actuation/sensing performance remains constant, although its intensity is relatively low. In the dead zone (the region beneath the electrodes), the transverse electric field strength increases sharply, reaching a peak value. The maximum transverse electric field strength values in the two dead zones are different because the RVE model used for the simulation contains three electrodes. The leftmost electrode's electric field distribution is mainly driven by this electrode and the adjacent electrode to the right, with no influence from other electrodes. In contrast, the second peak in the field strength is higher because the electric field distribution is influenced by three electrodes, with an added impact from the right positive electrode.
It is important to note that while the transverse electric field component increases sharply in the dead zone (beneath the electrodes), it is still smaller than the electric field component perpendicular to the fiber direction. Therefore, the resulting electric field lines primarily point perpendicular to the fiber direction.
Comparing the parallel-to-fiber electric field components in the homogeneously polarization zone across models with different electrode widths, it is found that as the electrode width increases, the parallel-to-fiber electric field component in the homogeneously polarization zone increases. However, the difference is small, and the variation in the parallel-to-fiber electric field component across different electrode widths is less than 10kV/mm.
By modifying the electrode width in the range of 0.025 mm to 0.150 mm, the proportion of the homogeneously polarization zone and dead zone in the RVE electric field distribution was calculated for different electrode widths. As shown in Table 6 and Fig. 18, as the electrode width increases, the proportion of the homogeneously polarization zone in the RVE model increases, leading to improved actuation/ sensing performance. However, when the electrode width increases beyond 0.125 mm, no significant advantage in electric field distribution is observed. This is because the ratio of electrode width to spacing becomes relatively large, and the electric field in the region between the electrodes is significantly affected by the local fields of the adjacent electrodes, resulting in no notable increase in the homogeneously polarization zone.
The FPC is composed of an electrode layer and a piezoelectric active layer along the thickness direction. The mechanical properties of the material are primarily determined by the piezoelectric active layer, as the thickness of the interdigital electrode layer is 0.1 mm, much smaller than that of the piezoelectric active layer. However, the stiffness of the interdigital electrode differs significantly from that of the PZT fibers and epoxy resin. In the contact areas between the copper electrode, PZT, and epoxy resin, there is a sudden change in structural stiffness, leading to stress concentration. Fig. 19 shows the structural stress distribution in the RVE model of a D33-type FPC when the electrode is energized (i.e., when the FPC is in its actuation state). It can be observed that the stress in the contact region between the electrode and the piezoelectric active layer is considerably higher, by one to two orders of magnitude compared to other regions. When the stress exceeds the material's limit, fracture or delamination is likely to occur in the electrode and piezoelectric fiber composite layer. Through simulation, the maximum structural stress in d33-RVE models with different electrode widths under the same electric potential conditions is calculated, as shown in Fig. 20. It is found that as the electrode width increases, the maximum structural stress in the FPC decreases. Within a certain range, increasing the electrode width helps enhance the FPC's fatigue resistance and reduce the likelihood of material fracture or delamination.
Table 6 Effect of electrode width on the proportions of homogeneously polarization zone and dead zone in D33-FPC. |
| Electrode width (mm) | 0.025 | 0.050 | 0.075 | 0.100 | 0.125 | 0.150 |
|---|---|---|---|---|---|---|
| Homogeneously polarization zone | 56.045 % | 57.926 % | 58.440 % | 58.610 % | 59.740 % | 54.710 % |
| Dead zone | 43.955 % | 42.074 % | 41.560 % | 41.390 % | 40.260 % | 45.290 % |
Table 7 Effect of Electrode Width on The Proportions of Homogeneously Polarization Zone and Dead Zone in D31-FPC. |
| Electrode Width (mm) | 0.050 | 0.075 | 0.100 | 0.125 | 0.150 |
|---|---|---|---|---|---|
| Homogeneously polarization zone | 38.184 % | 38.356 % | 38.598 % | 39.519 % | 38.766 % |
| Dead zone | 61.816 % | 61.644 % | 61.405 % | 60.481 % | 61.234 % |
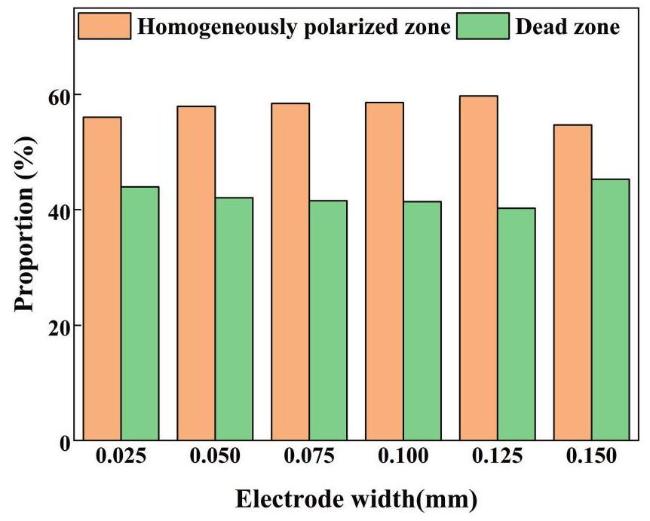
Fig. 18. Effect of electrode width on the electric field distribution region for D33-Type FPC. |
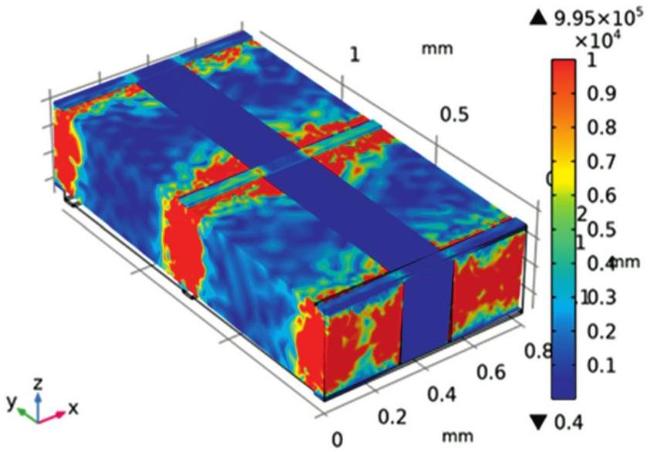
Fig. 19. Stress distribution of the RVE model of D33-FPC under 400 V voltage. |
4.2.2. Effect of interdigital electrode width on D31-FPC performance
After determining the optimal spacing of the interdigital electrodes for D31-FPC, a model is established based on this spacing, and the influence of the interdigital electrode width on the actuation/sensing performance of D31-FPC is investigated. By varying the width of the interdigital electrodes in the RVE model of D31-type FPC, the electric field distribution in D31-FPC with different electrode widths is compared. Similar to the D33-type FPC, the distance between the centers of adjacent electrodes along the fiber direction is normalized and used as the horizontal axis to calculate the vertical electric field component of the FPC, as shown in Fig. 21. The width of the interdigital electrodes has a minimal effect on the stable value of the vertical electric field component, but the distance between inflection points differs, indicating a variation in the proportion of the homogeneously polarization zone.
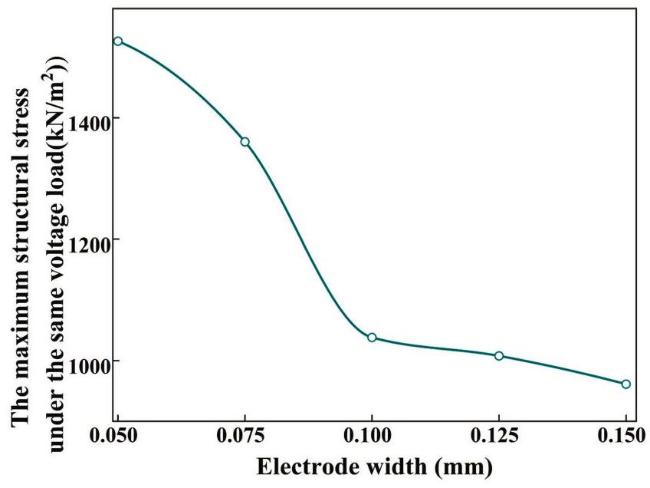
Fig. 20. Effect of electrode width on the maximum stress in D33-FPC. |
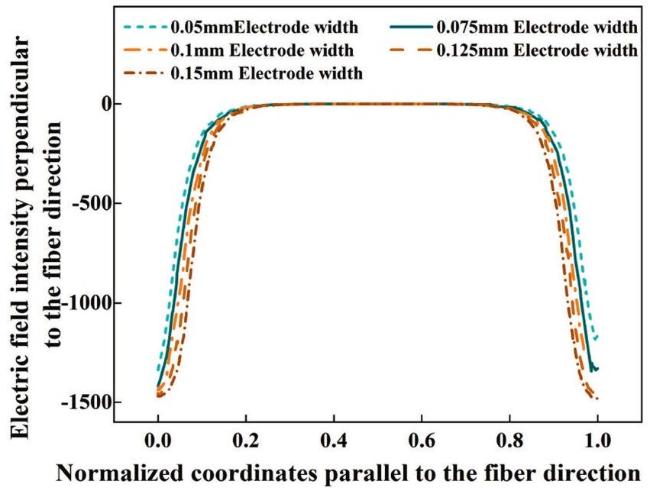
Fig. 21. Effect of electrode width on the electric field distribution perpendicular to the fiber direction for D31-FPC. |
As the actuation/sensing in D31-FPC is driven by the electric field perpendicular to the fiber direction, the region between adjacent electrodes is divided into a homogeneously polarization zone (effective zone) and a dead zone (ineffective zone) based on the distribution of the vertical electric field component. The proportions of the homogeneously polarization zone and the dead zone in FPC with different electrode widths are shown in Table 6 and Fig. 22. When the electrode width of D31-FPC increases, the proportion of the homogeneously polarization zone between the centers of adjacent electrodes increases, while the proportion of the dead zone decreases. However, the effect of electrode width is minor, and increasing the electrode width does not significantly enhance polarization or actuation/sensing performance. When the electrode width exceeds 0.125 mm, further increases in electrode width do not result in a larger proportion of the homogeneously polarization zone. This is because the electrodes in D31-FPC primarily influence the electric field distribution perpendicular to the fiber direction, with minimal impact on the parallel electric field. Additionally, the change in electrode width is relatively small compared to the changes in electrode spacing used in Fig. 19, and therefore, its effect on the electric field distribution is weaker.
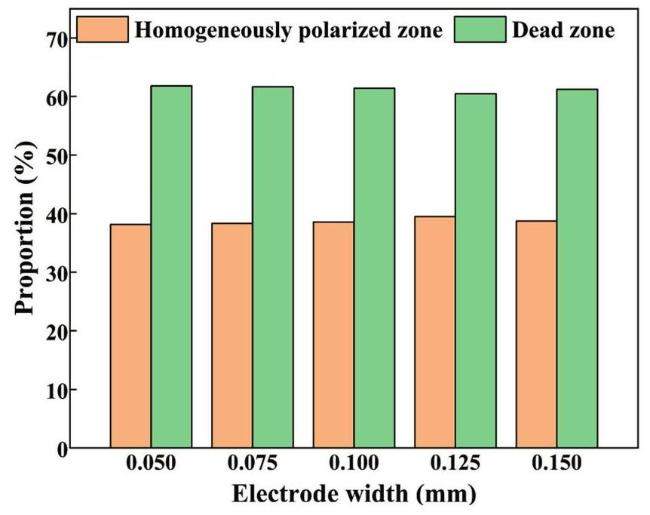
Fig. 22. Effect of electrode width on the electric field distribution region for D31-FPC. |
Fig. 23. Effect of electrode width on the maximum stress in D31-FPC. |
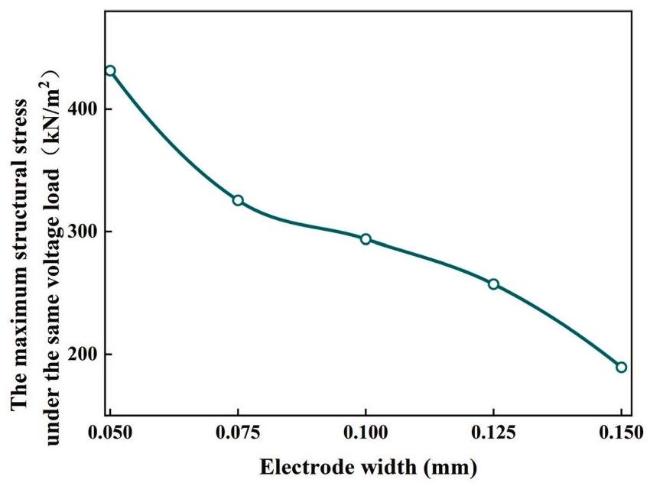
In the RVE model of D31-type FPC, stress concentration occurs at the interface between the electrode and the piezoelectric active layer, with the maximum stress located beneath the electrode. When a voltage of 400 V and 0 V is applied to the positive and negative electrodes on the upper and lower surfaces of D31-FPC, respectively, the maximum structural stress in the RVE models with different electrode widths is compared, as shown in Fig. 23. As the electrode width increases, the maximum structural stress of the FPC decreases, effectively improving its fatigue resistance. When the electrode width is 0.1 mm, the maximum stress within the D31-FPC model decreases to an optimal value. Therefore, when the interdigital electrode spacing of D31-FPC is 0.1 mm, the optimal electrode width is 0.01 mm, corresponding to an electrode width-to-spacing ratio of 1:10.
5. Conclusion
This study developed a mesoscopic scale representative volume element (RVE) model for flexible piezoelectric composites (FPC). The effects of piezoelectric fibers, epoxy resin matrix, and interdigital electrodes on FPC performance were analyzed from mechanical and electrical perspectives, considering structural behavior, physical properties, and internal electric field distribution. The key findings are listed as follows:
(1) Increasing the volume fraction of piezoelectric fibers enhances the piezoelectric effect, leading to higher output forces and charge generation. A performance threshold is reached when the PZT fiber volume fraction is 75%. Beyond this point, further fiber increases boost piezoelectric performance but reduce compliance, making the material less suitable for bending or irregular structures.
(2) The internal electric field of FPC is non-homogeneously. The region beneath the electrodes forms a dead zone (ineffective region), while the area between electrodes shows a homogeneously polarization zone (effective region). The homogeneously polarization zone is key to enhancing piezoelectric performance.
(3) Increasing electrode spacing enhances the homogeneously polarization zone, improving FPC piezoelectric performance. However, larger spacing reduces the number of electrodes, potentially impacting overall performance. The optimal electrode spacing for both D33-FPC and D31-FPC is 0.1 mm.
(4) Increasing electrode width slightly increases the homogeneously polarization zone and helps alleviate stress concentration, improving fatigue resistance. The optimal electrode width at 0.1 mm spacing is 0.01 mm, minimizing internal stress during sensing and actuating.
CRediT authorship contribution statement
Yanheng Guo: Writing - original draft, Methodology, Conceptualization. Weixuan Zhang: Data curation. Kecheng Li: Formal analysis. Di Wu: Resources. Wenfeng Zhang: Conceptualization. Yishou Wang: Project administration, Funding acquisition. Tao Liu: Investigation, Supervision.
Declaration of Competing Interest
The authors declare that they have no known competing financial interests or personal relationships that could have appeared to influence the work reported in this paper.