

1 Introduction
Ceramic matrix composites (CMCs) are ideal materials for replacing high-temperature alloys in aero engines due to their excellent high-temperature resistance, low density, and superior mechanical properties [1-6]. In dry environments, silicon-based materials form a dense oxide layer on the surface, providing effective protection. However, in high-temperature water-oxygen environments, the silicon oxide layer reacts with water vapor, leading to continuous consumption of Si and the formation of volatile products, which causes severe degradation of the matrix[1,6]. Therefore, it is necessary to apply environmental barrier coatings (EBCs) on the material surface to isolate it from the environment and extend its service life [7-9].
The design of EBCs requires a careful consideration of several key factors, including phase stability, coefficient of thermal expansion (CTE), corrosion resistance, and chemical compatibility[10]. Rare-earth disilicates have been widely studied due to their superior phase stability at high temperatures, low thermal conductivity, and closer CTE match with CMCs [11-12]. Our previous studies have confirmed that doping Y into Yb2Si2O7 can improve the performance of the coatings [13]. Additionally, Lv et al. [14] identified the optimal doping level of Ho in Yb-disilicate, showing a significant enhancement in water-oxygen corrosion resistance for (Yb1-xHox)2Si2O7. Tian et al.[15] synthesized RE2Si2O7 (RE = Y, Yb, and Lu) and conducted CMAS corrosion tests at 1300 ℃ and 1500 ℃, revealing the effects of different RE elements and temperatures on the CMAS corrosion process of RE2Si2O7.
Studies have revealed that the performance of rare-earth silicate EBCs is closely related to the presence of specific rare-earth elements performance ofin the system, and optimization of their composition has become a major research focus [16-17]. A promising strategy for enhancing EBC performance is the “cocktail effect” introduced through high-entropy design. It involves a combination of different features of multiple components, leading to synergistic enhancements and improved overall properties at a macroscopic level [18-19]. Research on EBCs has already demonstrated performance improvements through multi-principal co-doping via high-entropy design. For instance, Guo et al. [20] successfully prepared β-(Lu0.2Yb0.2Er0.2Tm0.2Sc0.2)2Si2O7 through solid-state sintering and hot pressing. This high-entropy rare-earth disilicate exhibited a stable phase structure at 1500 ℃, along with reduced thermal conductivity and improved resistance to steam corrosion compared to single-component RE2Si2O7 materials. Similarly, Wang et al.[21] employed a two-step method to fabricate (Y0.25Yb0.25Er0.25Sc0.25)2Si2O7 ceramics, which exhibited excellent corrosion resistance in CMAS molten salt corrosion tests at 1500 ℃. The enhanced resistance was attributed to the formation of a Y-Si-Al-O glass layer on the grain surfaces, acting as a barrier against the molten salts. Hence, these results further demonstrate the potential of high-entropy design for developing next-generation EBCs with superior performance.
For rare earth silicates, RE3+ ions with large ionic radii are more likely to promote apatite precipitate from CMAS, inhibiting the continuous infiltration of molten CMAS in high-temperature and harsh environments [22]. A significant difference in the radius of rare earth ions leads to a greater degree of lattice mismatch [4,22]. When rare earth ions with larger radii enter the lattice, they cause greater distortion of the lattice structure, making it more difficult to dissolve stably at the rare earth ion lattice points and increasing the difficulty of forming single-phase multi-principal-element solid solutions. Conversely, if the radius difference of rare earth ions is large, the resulting equivalent ionic radius of the high-entropy ceramic is very small. A smaller equivalent ionic radius tends to favor the re-precipitation of high-entropy rare earth disilicates over apatite in the residual CMAS glass.
Based on the previous report [22], the ionic radii of the Ho, Er, Tm, Yb, and Lu rare earth element are 1.072 Å, 1.062 Å, 1.052 Å, 1.042 Å, and 1.032 Å, respectively. Furthermore, the closer the ionic radius of rare earth elements, the easier it is to form a stable solid solution structure, and their properties are also more stable. Therefore, in this study, a novel high-entropy β-(5RE0.2)2Si2O7 (where RE represents a combination of Ho, Er, Tm, Yb, and Lu) disilicate bulk materials were synthesized using a solid-state reaction method due to the similar ionic radii. The phase composition, microstructure, mechanical properties, and thermal performance of the high-entropy bulk materials were systematically studied. Additionally, the high-temperature phase stability, water-oxygen corrosion resistance, and CMAS molten salt corrosion resistance of the bulk materials at 1500 ℃ were performed, aiming to provide a thorough understanding of their potential for high-temperature applications.
2 Experimental processes
2.1 Synthesis of high-entropy RE disilicate powder and bulk
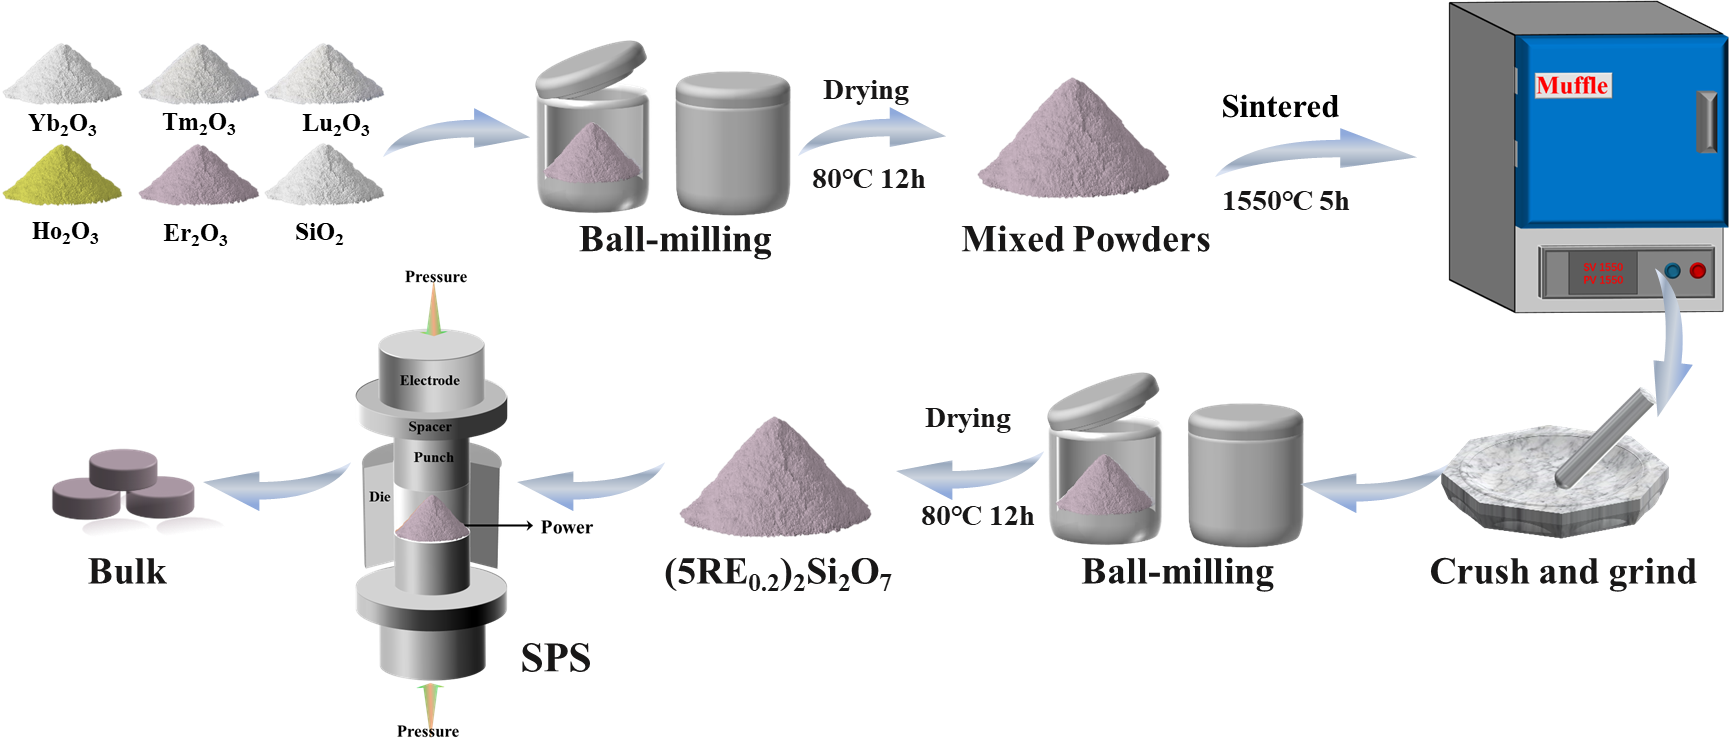
Commercially available powders of RE2O3 (RE= Ho, Er, Tm, Yb, and Lu) (99.99% purity, Ji’ning Zhongkai New Materials Co., Ltd., China) and SiO2 (Analytical reagent, Shanghai Aipi Chemical Reagent Co., LTD, China) were used as starting materials to synthesize the high-entropy silicate samples and Yb2Si2O7. All RE2O3 powders were heated at 1200 °C for 5 h to remove the carbides and moisture. Equimolar RE2O3 and SiO2 powders were mixed according to the stoichiometry of 1:10. Furthermore, To prevent the volatilization of SiO2 during the ball milling process, an additional 10% of SiO2 is added on this basis. The mixed powders were ball milled in a ZrO2 jar with ZrO2 balls and ethanol solution at 300 rpm for 4 h. Then the obtained slurry was dried at 60 °C for 12 h and sieved through a 120-mesh to obtain fine powders prior to consolidation. Pressure-less synthesis method was adopted to synthesize the (5RE0.2)2Si2O7 at 1550 °C for 5 h. The synthesized (5RE0.2)2Si2O7 was crushed, ground, and then ball milled in a ZrO2 jar at 380 rpm for 6 h and dried at 80 °C for 12 h to obtain the fine (5RE0.2)2Si2O7 powders. The dense (5RE0.2)2Si2O7 bulk was obtained by spark plasma sintering (SPS) with 30 MPa at 1600 °C for 30 min. The schematic diagram of the preparation of (5RE0.2)2Si2O7 powder and bulk is shown in Fig. 1.
Fig.1 Schematic diagram of preparation of (5RE0.2)2Si2O7 powder and bulk. |
2.2 CMAS corrosion of (5RE0.2)2Si2O7
The CMAS consists of a molar ratio of 33CaO-9MgO-13AlO1.5-45SiO2. The detailed preparation of CMAS was referred to previous report [13]. The CMAS powder was uniformly dispersed in ethanol and coated on the surface of the (5RE0.2)2Si2O7 bulk, and dried the samples in the oven at 80 ℃ to remove ethanol and moisture. The above operation was repeated until the loading of the CMAS powder was approximately 20 mg/cm2. The Al2O3 tube furnace was used for the CMAS corrosion experiments, and the temperature was maintained at 1500 ℃ for 2, 5, 10, and 20 hours, respectively.
2.3 Characterization
The phase composition of both synthesized and corroded (5RE0.2)2Si2O7 samples was determined using X-ray diffraction (XRD, Rigaku D/max 2500 PC, Japan) with Cu-Kα radiation, scanning from 10° to 90° at a rate of 5°/min. The Fullprof software was used to carry out Rietveld structural refinement of the samples to calculate the relative phase content. Raman spectra of (5RE0.2)2Si2O7 samples were obtained using a laser confocal Raman spectrometer (inVia, Renishaw, UK). Surface morphologies, cross-sectional microstructures, and elemental mappings of the (5RE0.2)2Si2O7 samples were observed and analyzed using the scanning electron microscopy (SEM, Gemini SEM 300, Zeiss, Germany) equipped with an energy-dispersion spectrometer (EDS, AZtecOne X-Max30). Thermogravimetric/differential thermal analysis (TGA/DSC1/1600, Mettler Toledo, Switzerland) was employed to analyze the thermal behavior of (5RE0.2)2Si2O7 ceramic powders from room temperature to 1500 °C in air conditions. The microhardness of the (5RE0.2)2Si2O7 ceramic was measured using a Vickers microhardness tester (MH-5LD, Shanghai Hengyi Precision Instrument Co., Ltd, China) with a 1000 gf load and 15 s dwell time. For each specimen, 10 points were randomly selected for hardness measurement, and then the average value of the measured hardness was taken as the final hardness value of the specimen. The fracture toughness (KIC) value was calculated referring to the Vickers indentation method following Eq. (1) [23].
Where, H is the microhardness (GPa), a is the average distance from the indentation center to the diagonal vertex (μm), and c is the average distance from the indentation center to the crack growth vertex (μm). The thermal diffusivity (α) of the (5RE0.2)2Si2O7 bulk was measured using a laser thermal conductivity instrument (Netzsch LFA 427, Germany) at room temperature (RT), 200 °C (473K), 400 °C (673K), 600 °C (873K), 800 °C (1073K), 1000 °C (1273K), 1200 °C (1473K), 1400 °C (1673K), and 1500 °C (1773K), respectively. The density (ρ) of the (5RE0.2)2Si2O7 bulk was measured using the Archimedes drainage method. The specific heat capacity (Cp) was obtained by referring to the Neumann-Kopp rule. The thermal conductivity (λ) of (5RE0.2)2Si2O7 ceramic was calculated following Eq. (2) [20]. Since it is difficult to obtain fully dense bulk samples during the preparation process, the thermal conductivity of dense samples needs to be corrected using Eq. (3) to exclude the influence of porosity (Φ) on thermal conductivity, where λ0 is the thermal conductivity of the material in the completely dense state.
3 Results and discussion
3.1 High-entropy (5RE0.2)2Si2O7 material
Fig. 2(a) shows the XRD patterns of synthesized (5RE0.2)2Si2O7 powder together with the standard X-ray diffraction pattern for the single-principal component disilicate, Yb2Si2O7. The results indicate that the characteristic peak positions of the synthesized high-entropy (5RE0.2)2Si2O7 powder are consistent with those of β-Yb2Si2O7 (PDF code: 01-082-0734, space group C2/m), suggesting that the synthesized (5RE0.2)2Si2O7 possesses a single-phase, monoclinic β-crystal structure. Rietveld refinement of the XRD pattern of the (5RE0.2)2Si2O7 is shown in Fig. 2(b). The close match between the calculated and experimental diffraction patterns of (5RE0.2)2Si2O7, with low R-factors (Rp = 7.39%, Rwp = 8.58%), shows the reliability of the modified structural model. Raman spectrum of the high-entropy (5RE0.2)2Si2O7 is shown in Fig. 2(c). The characteristic peak at 120 cm-1 corresponds to the vibration O-RE-O bond. Peaks at 416, 507, and 541 cm-1 are attributed to O-RE-O bending modes along with slight distortions of the [SiO4] tetrahedron. The peak at 642 cm-1 is associated with the O-Si-O vibration mode, while the peaks of 928 and 955 cm-1 are assigned to Si-O stretching vibrations. These findings align with previously reported Raman spectra for disilicate [12,20].
The crystal structure of high-entropy (5RE0.2)2Si2O7 is illustrated in Fig. 2(d). The refined crystal structure parameters of (5RE0.2)2Si2O7 are a=6.813 Å, b=8.886 Å, c=4.702 Å, and β = 101.9°. The related parameters of each single RE2Si2O7 were derived from the standard cards. Comparison with the standard data for individual RE2Si2O7 compounds (Table 1) reveals that the lattice parameters of high-entropy (5RE0.2)2Si2O7 are indeed closer to those of Yb2Si2O7 (PDF code: 01-082-0734), corroborating the XRD results. Furthermore, the lattice parameters of high-entropy (5RE0.2)2Si2O7 are slightly larger than those of Yb2Si2O7, which is consistent with the experimental results in previous reports [21-22].
The lattice distortion (η) of high-entropy (5RE0.2)2Si2O7 was calculated following Eq. (4),
Here, a0, b0, c0, and β0 are the standard lattice parameters of Yb2Si2O7, and Δ is the difference between the measured value and the standard value. The lattice distortion rate of (5RE0.2)2Si2O7 is calculated to be 1.23%, confirming significant lattice deformation. This phenomenon can be attributed to the lattice distortion resulting from the solid solution of multi-rare earth elements in (5RE0.2)2Si2O7. Further structural analysis through Rietveld refinement shows that the average Si-O bond length in the [SiO4]4- tetrahedra of (5RE0.2)2Si2O7 is 1.62 Å (compared to 1.64 Å in Yb2Si2O7), and the average RE-O bond length in the [REO6]9- octahedra is 2.21 Å (compared to 2.18 Å in Yb2Si2O7).With the increase in the RE3+ radius, the average Si-O bond length of [SiO4]-4 tetrahedron decreases while the average RE-O bond length of [REO6]-9 hexahedron increases [21]. Therefore, the (5RE0.2)2Si2O7 possesses a larger degree of deformation relative to Yb2Si2O7.
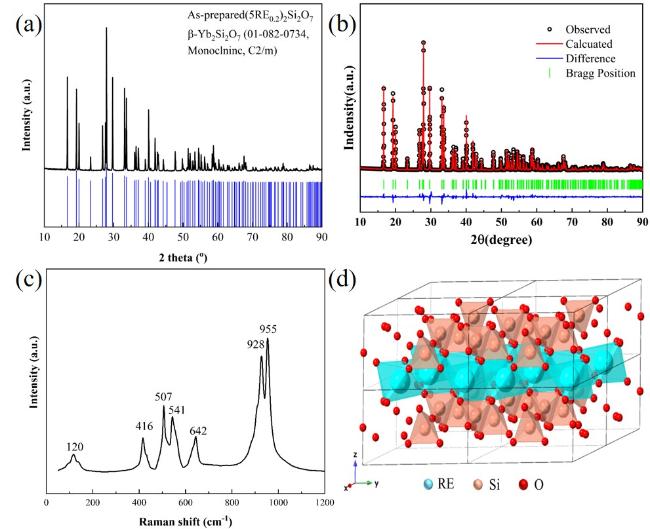
Fig.2 XRD patterns (a), Rietveld refinement of XRD pattern (b), Raman spectrum (c), and crystal structure (d) of high-entropy (5RE0.2)2Si2O7 |
Table 1 Crystal structure parameters of high-entropy (5RE0.2)2Si2O7 and individual RE2Si2O7 |
| Material | Structure | a(Å) | b(Å) | c(Å) | β(°) | Reference |
|---|---|---|---|---|---|---|
| (5RE0.2)2Si2O7 | Monoclinic, C2/m | 6.813 | 8.886 | 4.702 | 101.9 | This work |
| Ho2Si2O7 | Monoclinic, C2/m | 6.875 | 8.962 | 4.730 | 101.7 | 00-033-0594 |
| Er2Si2O7 | Monoclinic, C2/m | 6.849 | 8.940 | 4.722 | 101.8 | 01-082-0733 |
| Tm2Si2O7 | Monoclinic, C2/m | 6.821 | 8.906 | 4.697 | 101.8 | 96-223-9661 |
| Yb2Si2O7 | Monoclinic, C2/m | 6.799 | 8.876 | 4.710 | 102.0 | 01-082-0734 |
| Lu2Si2O7 | Monoclinic, C2/m | 6.778 | 8.880 | 4.724 | 102.0 | 00-034-0509 |
Fig. 3 shows the microstructures and EDS maps of high-entropy (5RE0.2)2Si2O7. The (5RE0.2)2Si2O7 ceramic exhibits a dense structure with small pores. The porosity of (5RE0.2)2Si2O7 ceramic was determined to be approximately 1.2% using image analysis. For this, ten SEM images of polished cross-sections were analyzed with ImageJ software to minimize errors. EDS mapping confirms the uniform distribution of principal rare earth elements (Ho, Er, Tm, Yb, and Lu) within the (5RE0.2)2Si2O7 ceramic with no elemental segregation. The atomic proportion of each element in high-entropy (5RE0.2)2Si2O7 is shown in Fig. 3. The theoretical molar percentage of each rare earth element in high-entropy (5RE0.2)2Si2O7 is 3.64%. The atomic proportions obtained through surface scanning range from 3.5% to 3.9%, which closely matches the theoretical values. The atomic percentage of Si and O is also consistent with the theoretical values. These results indicate that the prepared high-entropy (5RE0.2)2Si2O7 ceramic possesses a high chemical homogeneity.
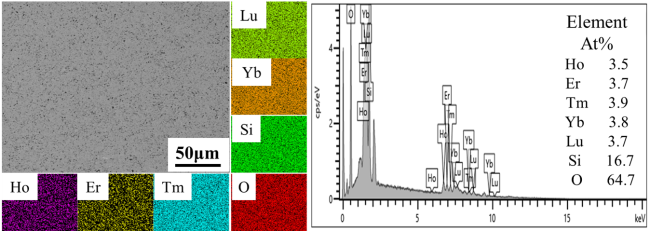
Fig. 3 Microstructure, EDS maps, and elemental composition of high-entropy (5RE0.2)2Si2O7 ceramic |
3.2 Thermophysical and mechanical properties of high-entropy (5RE0.2)2Si2O7 ceramic
The increasing operating temperatures of high-performance engines have received significant interest in the thermal insulation properties of high-entropy ceramics for their applications in thermal/environmental barrier coatings [21,24 -25]. High thermal insulation, characterized by low thermal conductivity, is crucial for reducing the operating temperature of the hot-end components and extending their service life. The specific heat capacity (Cp) of the high-entropy (5RE0.2)2Si2O7 was calculated based on RE2O3 and SiO2 constituent components using the Neumann-Kopp rule. Fig. 4(a) shows the Cp of high-entropy (5RE0.2)2Si2O7 from room temperature to 1500 ℃. The Cp increases with the increase in temperature and gradually stabilizes above 800 ℃. The thermal diffusivity coefficient (α) of (5RE0.2)2Si2O7 ceramic decreased with increasing temperature from room temperature to 1200 °C and then increased with increasing temperature, as seen in Fig. 4(b). The bulk density (ρ) of high-entropy (5RE0.2)2Si2O7 bulk is 5.5609 g/cm3 based on the Archimedes drainage method. The thermal conductivity (λ0) of high-entropy (5RE0.2)2Si2O7, as shown in Fig. 4(c), was calculated using Eq. (2-3). The λ0 has the same trend as Cp with temperature changes. Phonon harmonic scattering and thermal radiation are the primary mechanisms influencing thermal conductivity. Phonon harmonic scattering is the dominant factor affecting the thermal diffusion coefficient and thermal conductivity below 1200 °C [20]. Increased phonon collisions with rising temperature enhance phonon scattering, resulting in a significant decrease in the mean free path of the phonons, and consequently decrease α and λ0 [24,26]. On the other hand, the influence of thermal radiation dominates above 1200 °C, resulting in an increase in both α and λ with increasing temperature. The thermal conductivity of high-entropy (5RE0.2)2Si2O7 ceramic increased from 1.46 to 2.43 W·m−1·K−1 with increasing temperature from 1200 °C to 1500 °C[21,23].
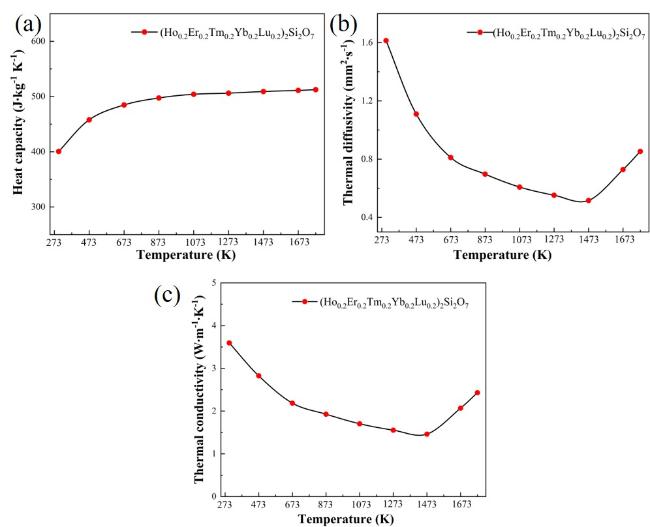
Fig. 4 Heat capacity (a), thermal diffusivity coefficient (b), and thermal conductivity (c) of high-entropy (5RE0.2)2Si2O7 ceramic |
Table 2. Thermal conductivity of (5RE0.2)2Si2O7 and each single principal RE2Si2O7 |
The thermal conductivity of (5RE0.2)2Si2O7 and each single principal RE2Si2O7 as shown in Table 2. The thermal conductivity of (5RE0.2)2Si2O7 is significantly lower than that of a single component RE2Si2O7. This decrease is attributed to the mass differences and lattice distortions caused by multi-component doping in (5RE0.2)2Si2O7, which enhance the non-harmonic scattering of phonons. In addition, the high entropy effect introduces additional lattice distortion and increases the concentration of point defects, further enhancing the scattering process. Therefore, under the combined influence of the above two factors, the thermal conductivity of high-entropy (5RE0.2)2Si2O7 materials is effectively reduced.
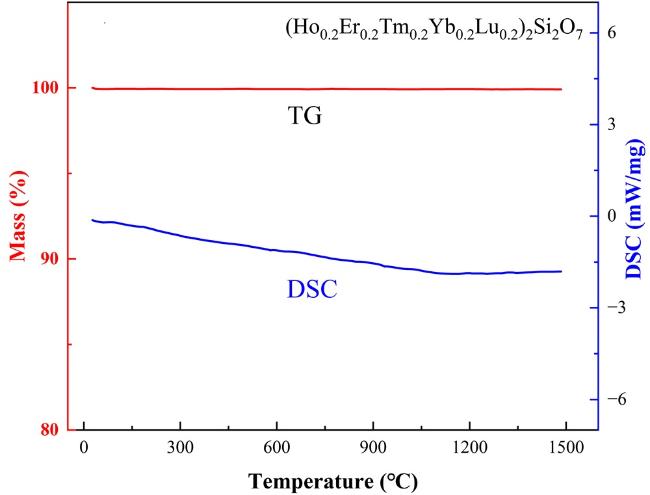
Fig. 5 TG/DSC curves of high-entropy (5RE0.2)2Si2O7 from room temperature to 1500 °C |
Fig. 5 shows the TG/DSC curves of high-entropy (5RE0.2)2Si2O7 from room temperature to 1500 °C in air conditions. Notably, the TG curve of high-entropy (5RE0.2)2Si2O7 remains horizontal, indicating no weight change. Meanwhile, the absence of exothermic and endothermic peaks in the DSC curve of high-entropy (5RE0.2)2Si2O7 confirms that the high-entropy (5RE0.2)2Si2O7 did not undergo phase transformation or decomposition during the heating process in air condition. These results suggest that the high-entropy (5RE0.2)2Si2O7 is able to maintain excellent phase stability from room temperature to 1500 °C.
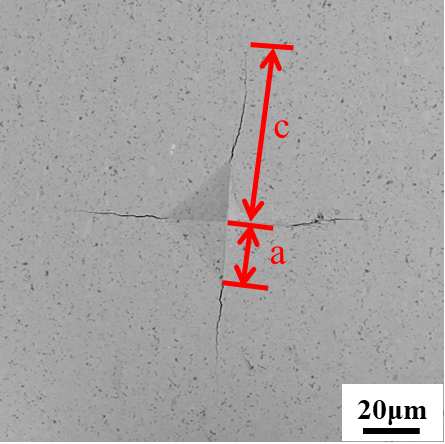
Fig. 6 Schematic diagram of microhardness of high-entropy (5RE0.2)2Si2O7 |
Stress generation, including quenching stress, thermal stress, and sintering stress, significantly deteriorates the performance and life of EBCs during thermal cycling, and fracture toughness is the key factor affecting EBCs’ durability[27-29]. Therefore, the EBCs should have excellent strain damage tolerance. The measured microhardness and the fracture toughness of high-entropy (5RE0.2)2Si2O7 are 6.97 ± 0.19 GPa and 1.90 ± 0.03 MPa·m1/2, respectively. However, the fracture toughness of high-entropy (5RE0.2)2Si2O7 is slightly lower than that of the pure Yb2Si2O7 ceramics since the lattice of high-entropy ceramics is severely distorted due to the varying atomic sizes of the constituent metal atoms. The fracture toughness of high-entropy (5RE0.2)2Si2O7 in this work is higher than that reported for other high-entropy ceramics in the literature [21]. The high fracture toughness is conducive to preventing crack propagation and alleviating premature coating failure caused by internal stress, which extends the service life of EBCs. Therefore, high-entropy (5RE0.2)2Si2O7 also possesses excellent mechanical properties.
3.3 CMAS corrosion behavior of high-entropy (5RE0.2)2Si2O7
Fig. 7 shows the XRD patterns of the molten CMAS corrosion of (5RE0.2)2Si2O7 pellets exposed at 1500 ℃ for 2, 10, and 20 h. Compared to the XRD pattern of the sintered (5RE0.2)2Si2O7 ceramic, additional peaks at 2θ = 28.95° and 33.45° appear in the patterns of the corroded samples. These peaks, indexed according to PDF code 04-006-0320, are characteristic of hexagonal apatite (Ca2RE8(SiO4)6O2, space group P63/m) corrosion product. Furthermore, the characteristic peaks of (5RE0.2)2Si2O7 ceramic are also observed in the corroded samples due to the presence of unreacted (5RE0.2)2Si2O7 ceramic. The ratio of characteristic peaks between Ca2RE8(SiO4)6O2 and (5RE0.2)2Si2O7 increased as the corrosion time extended from 2 h to 20 h, indicating the progressive formation of the apatite phase during the CMAS corrosion process.
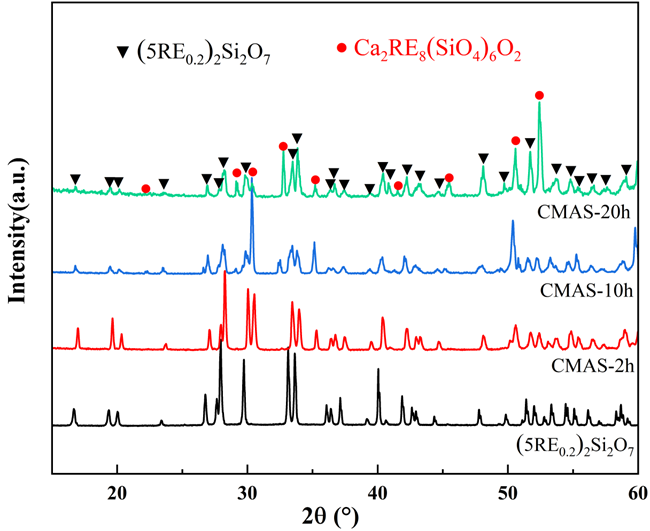
Fig.7 XRD patterns of the molten CMAS corrosion of (5RE0.2)2Si2O7 pellets for different times at 1500℃ |
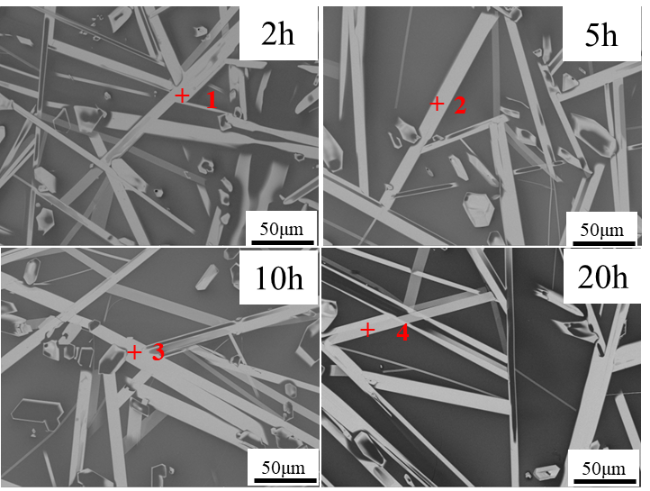
Fig.8 Surface morphologies of the molten CMAS corrosion of (5RE0.2)2Si2O7 pellets for various durations at 1500 °C |
Table 3 Atomic ratios (at%) of the corresponding points in Fig. 8 |
| Num. | O | Ca | Si | Ho | Er | Tm | Yb | Lu | RE:Ca | Product |
|---|---|---|---|---|---|---|---|---|---|---|
| #1 | 61.85 | 4.65 | 14.34 | 3.87 | 4.02 | 3.69 | 3.82 | 3.76 | 4.12 | Ca2RE8(SiO4)6O2 |
| #2 | 60.99 | 4.18 | 15.42 | 4.65 | 4.65 | 2.70 | 3.94 | 3.48 | 4.65 | Ca2RE8(SiO4)6O2 |
| #3 | 65.79 | 3.81 | 13.79 | 3.76 | 3.70 | 2.65 | 3.36 | 3.05 | 4.34 | Ca2RE8(SiO4)6O2 |
| #4 | 51.94 | 6.00 | 17.81 | 6.45 | 5.94 | 3.75 | 4.05 | 3.83 | 4.01 | Ca2RE8(SiO4)6O2 |
Fig. 8 shows the surface morphologies of the (5RE0.2)2Si2O7 pellets corroded by molten CMAS at 1500 °C at different times. Two different kinds of contrasts are observed on the surface of (5RE0.2)2Si2O7 pellets. The granular or strip grains with light grey contrast are the precipitate formed after corrosion between CMAS and (5RE0.2)2Si2O7 pellets. Granular grains are observed mostly at the intercept points of strip grains perpendicular to the observation angle. The dark contrast represents the unreacted CMAS. The atomic ratios of the corresponding points (#1-#4) in Fig. 8 are listed in Table 3. EDS analysis revealed that Mg and Al elements are absent while Ca is present in these points. The atomic ratio of total RE:Ca is close to 4:1, the ratio of RE:Ca in Ca2RE8(SiO4)6O2. Combined with the XRD results (Fig. 7) and the atomic ratios presented in Table 3, these light-contrast strips and granular grains are identified as the corrosion product apatite, Ca2RE8(SiO4)6O2. Hence, these results confirm that the (5RE0.2)2Si2O7 pellets reacted with the molten CMAS, forming the Ca2RE8(SiO4)6O2 apatite phase.
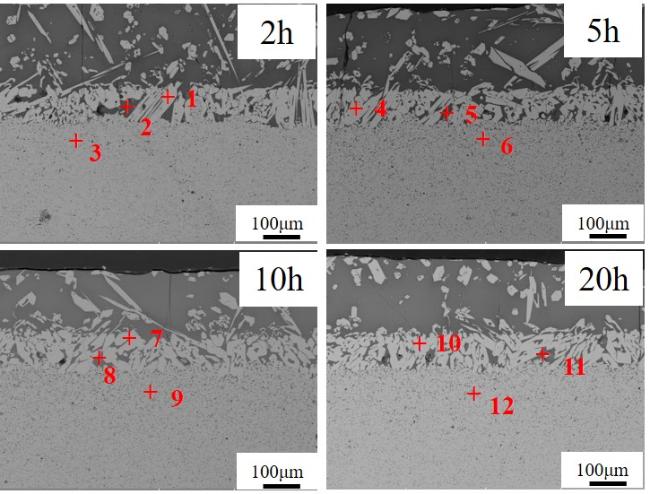
Fig. 9 Cross-sectional microstructures of the molten CMAS corrosion of (5RE0.2)2Si2O7 pellets for different times at 1500 °C. |
Fig. 9 presents cross-sectional microstructures of (5RE0.2)2Si2O7 pellets corroded by molten CMAS salt at 1500 °C for varying durations. A residual CMAS layer is observed on the upper surface of the corrosion layer. The reaction layer, situated between the residual CMAS layer and (5RE0.2)2Si2O7 pellets, consists of strip-like apatite grains (light grey contrast) and the infiltrated CMAS salt (dark contrast). While some apatite grains are observed in the residual CMAS layer, the majority of them are concentrated within the reaction layer. The atomic ratios of the selected points in Fig. 9 are listed in Table 4. Points 1, 4, 7, and 10 correspond to the reaction product, Ca2RE8(SiO4)6O2 apatite; points 2, 5, 8, and 11 represent residual CMAS; and points 3, 6, 9, and 12 indicate the unreacted (5RE0.2)2Si2O7 ceramic. The presence of some CMAS salt in the reaction layer suggests that the molten CMAS penetrated the corrosion product layer and then trapped in the reaction layer during the cooling stage. Although some vertical cracks were observed in the reaction layer, they ended at the interface between the reaction layer and unreacted (5RE0.2)2Si2O7 ceramic, indicating that the underlying (5RE0.2)2Si2O7 ceramic still maintained its structural integrity.
Table 4 Atomic ratios (at%) of the corresponding points in Fig. 9 |
| Num. | O | Ca | Mg | Al | Si | Ho | Er | Tm | Yb | Lu | RE:Ca | Products |
|---|---|---|---|---|---|---|---|---|---|---|---|---|
| #1 | 61.8 | 4.7 | -- | -- | 15.2 | 3.6 | 3.9 | 3.7 | 3.1 | 4 | 3.9 | Ca2RE8(SiO4)6O2 |
| #2 | 60.5 | 8.4 | 2.6 | 5.5 | 22.5 | 0.1 | -- | -- | 0.2 | 0.2 | CMAS | |
| #3 | 64.2 | 0.1 | -- | -- | 18.2 | 3.8 | 3.9 | 3.5 | 3.2 | 3.1 | (5RE0.2)2Si2O7 | |
| #4 | 58.3 | 4.9 | 0.1 | -- | 16.3 | 4.7 | 4.2 | 3.8 | 4.1 | 3.6 | 4.2 | Ca2RE8(SiO4)6O2 |
| #5 | 59.3 | 8.2 | 3.6 | 4.9 | 23.4 | -- | 0.1 | -- | 0.3 | 0.2 | CMAS | |
| #6 | 63.9 | -- | -- | -- | 17.6 | 3.9 | 4.2 | 3.4 | 3.9 | 3.1 | (5RE0.2)2Si2O7 | |
| #7 | 60.1 | 5.1 | -- | -- | 15.2 | 4.6 | 3.9 | 4.2 | 3.5 | 3.4 | 3.8 | Ca2RE8(SiO4)6O2 |
| #8 | 59.8 | 7.6 | 2.3 | 5.4 | 24.8 | -- | -- | 0.1 | -- | -- | CMAS | |
| #9 | 66.3 | 0.1 | -- | -- | 16.6 | 3.2 | 3.3 | 3.2 | 4.2 | 3.1 | (5RE0.2)2Si2O7 | |
| #10 | 60.3 | 4.6 | -- | 0.2 | 16.3 | 3.8 | 3.7 | 4.3 | 3.2 | 3.6 | 4.0 | Ca2RE8(SiO4)6O2 |
| #11 | 58.3 | 7.3 | 3.2 | 4.3 | 26.3 | 0.2 | 0.1 | -- | 0.3 | -- | CMAS | |
| #12 | 64.3 | 0.1 | -- | -- | 17.9 | 3.2 | 3.5 | 3.6 | 4.1 | 3.3 | (5RE0.2)2Si2O7 |
Fig. 10 shows the cross-sectional microstructures and EDS maps of (5RE0.2)2Si2O7 and Yb2Si2O7 pellets corroded by molten CMAS for 20 h at 1500 ℃. EDS maps revealed that Ca is mainly enriched in the reaction layer of Ca2RE8(SiO4)6O2 apatite. The absence of Ca below the reaction layer confirms that it did not infiltrate into the interior of (5RE0.2)2Si2O7. However, the Yb2Si2O7 pellets exhibited no reaction with the molten CMAS at 1500 ℃. Instead, Ca infiltrated into the depth of the Yb2Si2O7 pellet, and the infiltration thickness exceeded 700 μm. In addition, the Yb2Si2O7 pellet displayed increased porosity. While no direct reaction occurred between the molten CMAS and Yb2Si2O7 pellet, the molten CMAS could infiltrate into the Yb2Si2O7 along defects, such as the pores, resulting in the premature failure of Yb2Si2O7 ceramic in the CMAS conditions at ultra-high temperatures. These results suggest that the (5RE0.2)2Si2O7 ceramic reacts with molten CMAS to form Ca2RE8(SiO4)6O2 apatite, thereby limiting further CMAS infiltration, reducing the corrosion rate, and prolonging the service life of (5RE0.2)2Si2O7 as EBCs.
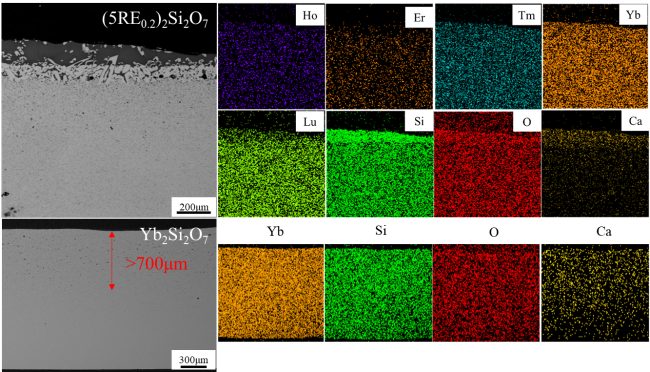
Fig. 10 Cross-sectional microstructures and EDS maps of (5RE0.2)2Si2O7 and Yb2Si2O7 pellets after CMAS corrosion for 20 h at 1500 ℃ |
The thickness of the reaction layer (Ca2RE8(SiO4)6O2 apatite layer) formed after the reaction of (5RE0.2)2Si2O7 with molten CMAS at 1500 ℃ for various corrosion durations is shown in Fig. 11. The thickness of Ca2RE8(SiO4)6O2 apatite was measured as 86.8±6.9 μm, 94.9±7.3 μm, 95.6±8.4 μm, and 95.9±8.6 μm, for 2, 5, 10, and 20 h, respectively. The (5RE0.2)2Si2O7 rapidly reacted with molten CMAS salt, forming Ca2RE8(SiO4)6O2 apatite. Initially, as the temperature increased, the CMAS gradually melted. The molten CMAS then diffused towards the (5RE0.2)2Si2O7, dissolving some of the (5RE0.2)2Si2O7 ceramic into the melt. Then, the Ca2RE8(SiO4)6O2 apatite formed and precipitated. Meanwhile, the molten CMAS continued to penetrate pores and cracks within apatite and the (5RE0.2)2Si2O7, further promoting Ca2RE8(SiO4)6O2 apatite formation and precipitation. Eventually, the CaO in the CMAS was depleted, decreasing and ultimately eliminating the driving force for further apatite formation, resulting in the residual CMAS equilibrating with the Ca2RE8(SiO4)6O2 apatite [23]. The infiltration of the molten CMAS was inhibited simultaneously due to the formation of the Ca2RE8(SiO4)6O2 apatite. The corrosion product, Ca2RE8(SiO4)6O2 apatite, in the reaction layer was formed through the following mechanism (4)[22,30]:
$4(5RE_{0.2})_{2}Si_{2}O_{7}+ 2 CaO (CMAS)→Ca_{2}RE_{8}(SiO_{4})_{6}O_{2}+ 2 SiO_{2}$
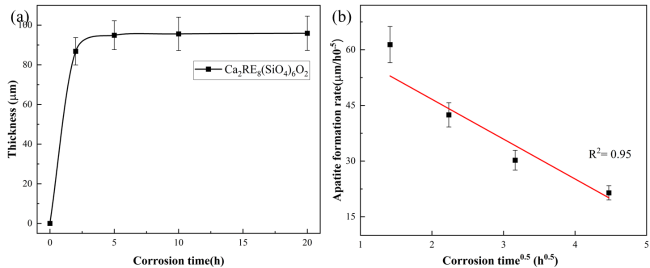


Fig.11 Reaction layer thickness in (5RE0.2)2Si2O7 ceramic (a), and average apatite formation rate (μm/h0.5) vs. corrosion time 0.5 (h0.5) for Yb2Si2O7 ceramic (b) pellets during CMAS corrosion for different times at 1500 ℃ |
where the t is the corrosion time (h), kt is the tortuosity factor, Dc is the capillary diameter, ω is the pore fraction open to flow, d is the infiltration depth (μm), σLV is the surface tension, and η is the viscosity of the molten CMAS. Therefore, it could be considered that the corrosion depth d is related to corrosion time t, and Eq. (5) is simplified as Eq. (6):
where a is the relationship constant. The relationship between the corrosion depth d and corrosion time t follows a parabolic equation, which is consistent with the experimental results, as shown in Fig. 11(a). The average apatite formation rate (μm/h0.5) and corrosion time0.5 (h0.5) exhibited a linear relationship with the increase in time, as shown in Fig. 11(b). The Ca2RE8(SiO4)6O2 apatite rapidly formed at the interface between the molten CMAS and (5RE0.2)2Si2O7 ceramic within 2 h. Then, the apatite formation rate linearly decreased with time, which is attributed to the pores being sealed and the apatite layer accumulating. After corrosion for 5 h, the thickness of the reaction layer did not show significant changes, indicating that the formation of Ca2RE8(SiO4)6O2 apatite inhibited the corrosion reaction.
Yue et al. studied the corrosion resistance of (Yb0.25Y0.25Er0.25Sc0.25)2Si2O7 against molten CMAS at 1500 °C [34]. They found that the molten CMAS did not react with (Yb0.25Y0.25Er0.25Sc0.25)2Si2O7 but completely infiltrated into the substrate along the grain boundaries. This behavior is attributed to the small ionic radius of Sc3+ (0.87 Å). The incorporation of Sc high-entropy rare earth silicate with a small equivalent ionic radius, which promotes the precipitation of high-entropy rare earth disilicates in the residual CMAS glass, rather than apatite. In contrast, Zhi et al. prepared high-entropy (Ho0.2Er0.2Tm0.2Yb0.2Lu0.2)2Si2O7 and studied its CMAS corrosion resistance at 1400 °C [35]. At the higher temperature of 1500 °C, the molten CMAS exhibited high fluidity, while the chemical reaction between the high-entropy (Ho0.2Er0.2Tm0.2Yb0.2Lu0.2)2Si2O7 material and the molten CMAS was extremely vigorous. The high-entropy (Ho0.2Er0.2Tm0.2Yb0.2Lu0.2)2Si2O7 reacted rapidly with molten CMAS, forming a continuous and dense Ca₂RE₈(SiO₄)₆O₂ apatite reaction layer approximately 95.9±8.6 μm thick in this work. This layer effectively acted as a physical barrier, inhibiting further molten CMAS penetration. In contrast, , the reaction rate was relatively moderate at 1400 °C, resulting in a porous and loosely structured apatite layer that failed to effectively block CMAS, allowing the melt to penetrate through the reaction layer and continue infiltrating along grain boundaries. Furthermore, the molten CMAS still infiltrated its interior along the pores since this material possessed a relatively high porosity of 6.54%. Therefore, lower porosity in high-entropy ceramics also plays a significant role in inhibiting the infiltration and corrosion by molten CMAS salt at high temperatures.
where a and b are the valences of RE and Si; x, y, and z are the stoichiometric coefficients for RE3+, Si4+, and O2− for the (5RE0.2)2Si2O7, respectively. The OB values of the ΛHo2O3, ΛEr2O3, ΛTm2O3, ΛYb2O3, ΛLu2O3, and ΛSiO2 are 0.945, 0.929, 0.913, 0.893, 0.886, and 0.480, respectively [13,38]. The calculated Λ(5RE0.2)2Si2O7 and ΛYb2Si2O7 are 0.666 and 0.657, respectively. The ΛCMAS is 0.630 [33,38]. The ΔΛ((5RE0.2)2Si2O7-CMAS) and ΔΛ(Yb2Si2O7-CMAS) are 0.036 and 0.027, respectively. The ΔΛ((5RE0.2)2Si2O7-CMAS) is greater than ΔΛ(Yb2Si2O7-CMAS). Thus, the reaction activity of (5RE0.2)2Si2O7 towards molten CMAS is greater than that of Yb2Si2O7. While Yb2Si2O7 did not react with the molten CMAS at 1500 °C, the (5RE0.2)2Si2O7 demonstrated a rapid reaction with molten CMAS forming Ca2RE8(SiO4)6O2 apatite, inhibiting the infiltration of residual CMAS.
Zhang et al. investigated the corrosion resistance of β-(Yb0.25Y0.25Er0.25Tm0.25)2Si2O7 against molten CMAS at 1500 °C [39]. The calculated Λ value for this material, determined using Eq. (7) was 0.674. As a result, it reacted with the molten CMAS, forming an apatite reaction layer. The ΔΛ value for the (Yb0.25Y0.25Er0.25Tm0.25)2Si2O7-CMAS system was determined to be 0.044, which is greater than that of the (5RE0.2)2Si2O7-CMAS system. Therefore, the reaction activity of (Yb0.25Y0.25Er0.25Tm0.25)2Si2O7 towards molten CMAS is higher than that of (5RE0.2)2Si2O7. However, despite this higher reaction activity, the thickness of the apatite reaction layer formed on (Yb0.25Y0.25Er0.25Tm0.25)2Si2O7 was 118 μm after 48 h, which was thicker than the layer observed for (5RE0.2)2Si2O7 under similar conditions. The increased thickness of the reaction layer is attributed to the higher porosity of (Yb0.25Y0.25Er0.25Tm0.25)2Si2O7, approximately 6%, which is greater than that of (5RE0.2)2Si2O7. The molten CMAS was able to infiltrate the interior of (Yb0.25Y0.25Er0.25Tm0.25)2Si2O7 along these pores, resulting in a thicker reaction layer. Consequently, these findings suggest that while the intrinsic reaction activity between disilicate and CMAS determines whether apatite can be generated, the porosity of the ceramic significantly influences the thickness of the resulting apatite product layer.
Conclusion
This study investigated the high-temperature CMAS corrosion performance of a novel high-entropy (Ho0.2Er0.2Tm0.2Yb0.2Lu0.2)2Si2O7 ((5RE0.2)2Si2O7) environmental barrier coating (EBC) material, fabricated via high-temperature solid-state reaction and spark plasma sintering (SPS) process. The following key findings were obtained:
(1) Dense (5RE0.2)2Si2O7 ceramic material with a homogeneous distribution of rare earth elements and a single stable β-phase structure was successfully fabricated. (5RE0.2)2Si2O7 ceramic material exhibited good thermodynamic properties, hardness of 6.97 ± 0.19 GPa, and fracture toughness of 1.90 ± 0.03 MPa·m1/2. The (5RE0.2)2Si2O7 ceramic demonstrated excellent high-temperature stability with no decomposition or phase transformation up to 1500 ℃. The thermal conductivity of (5RE0.2)2Si2O7 ranges from 1.46 to 3.49 W · m−1·K−1 from room temperature to 1500 °C, suggesting (5RE0.2)2Si2O7 as a potential candidate for the next generation EBC ceramic material.
(2) In an ultra-high CMAS molten salt environment, (5RE0.2)2Si2O7 ceramic material underwent a rapid reaction forming Ca2RE8(SiO4)6O2 apatite, which effectively inhibited the infiltration and diffusion of molten CMAS salt. In contrast, Yb2Si2O7 ceramic material exhibited no chemical interaction with molten CMAS salt. Instead, the molten CMAS penetrated into the interior of Yb2Si2O7 along the defects such as grain boundaries and pores, forming bubble cracking and crack propagation. These findings demonstrate the superior CMAS corrosion resistance of (5RE0.2)2Si2O7 ceramic material.
Availability of data and materials
The data that support the findings of this study are available from the corresponding author upon reasonable request.