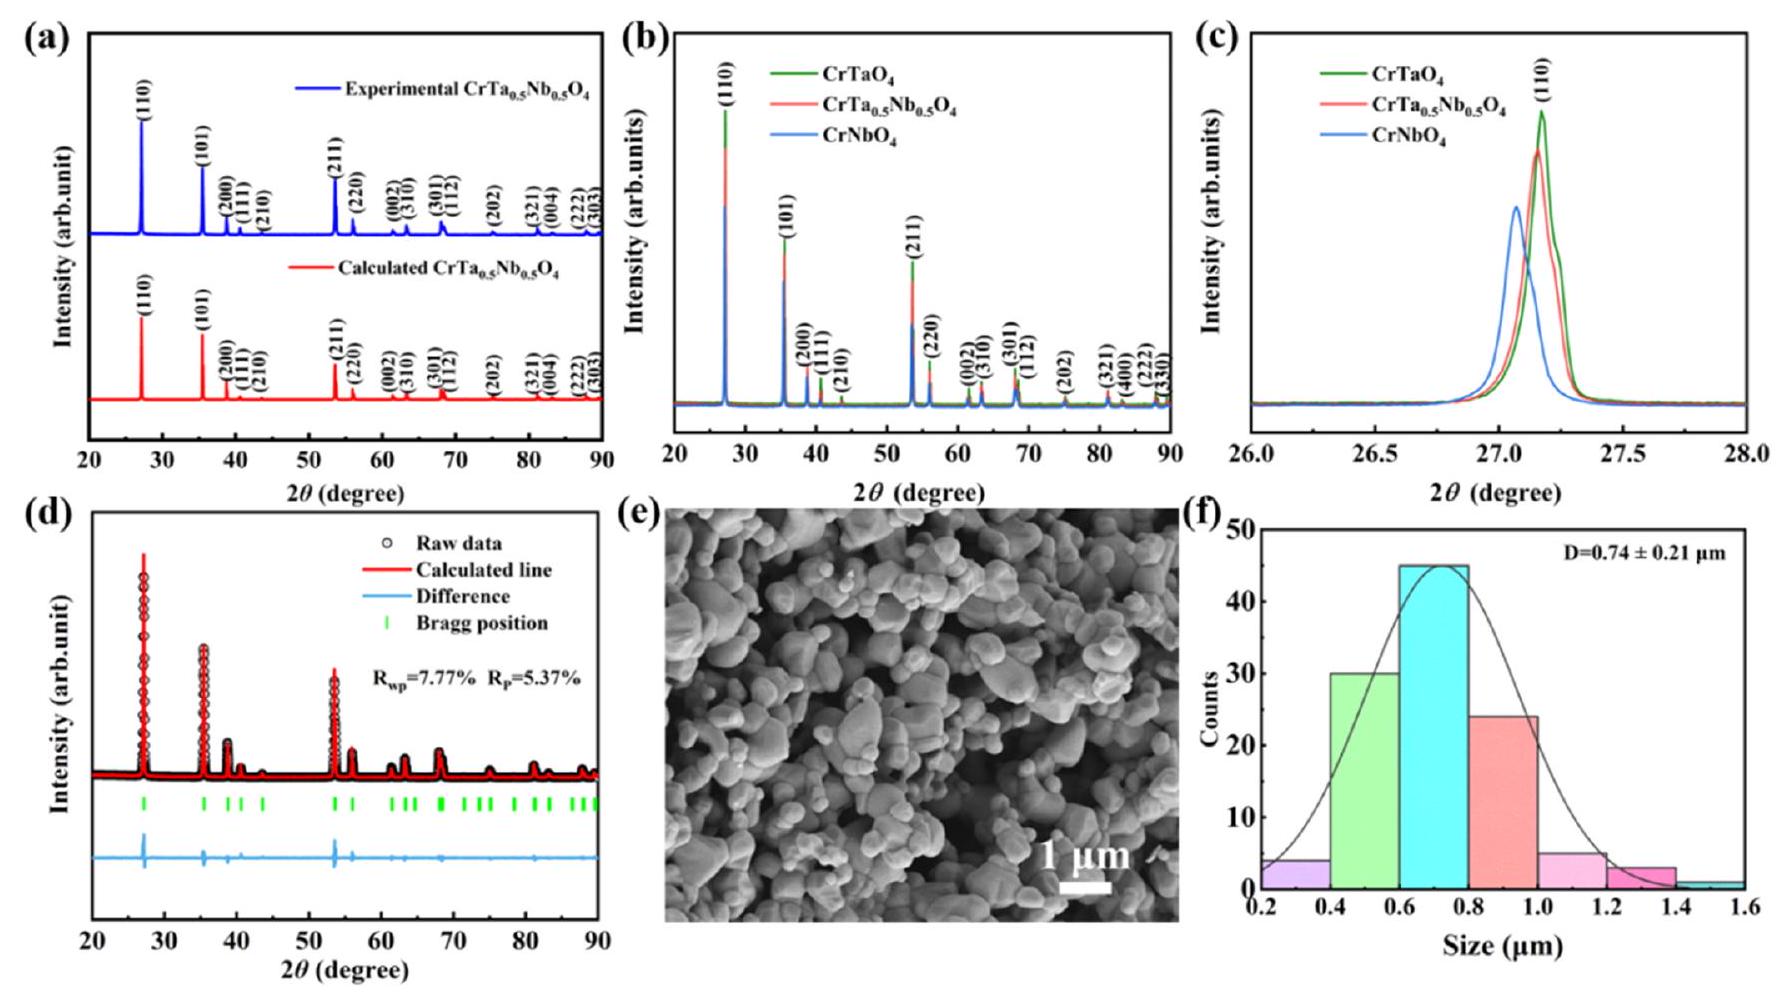
Fig. 1. (a) Comparison of the XRD pattern of CrTa0.5Nb0.5O4 powders synthesized at 1150∘C for 2 h with the theoretical one for CrTa0.5Nb0.5O4. (b) Comparison of the experimental XRD patterns of CrTaO4,CrNbO4 and CrTa0.5Nb0.5O4. (c) An enlarged view of the (110) diffraction peak in Fig. 1(b). (d) The experimental (black line) and calculated (red line) XRD patterns of CrTa0.5Nb0.5O4. The difference plot (blue line) is shown in the lower part. Vertical marks indicate the Bragg reflection positions of CrTa0.5Nb0.5O4 (green). (e) SEM image of CrTa0.5Nb0.5O4 powders. (f) particle size distribution of CrTa0.5Nb0.5O4 powders.
Other figure/table from this article