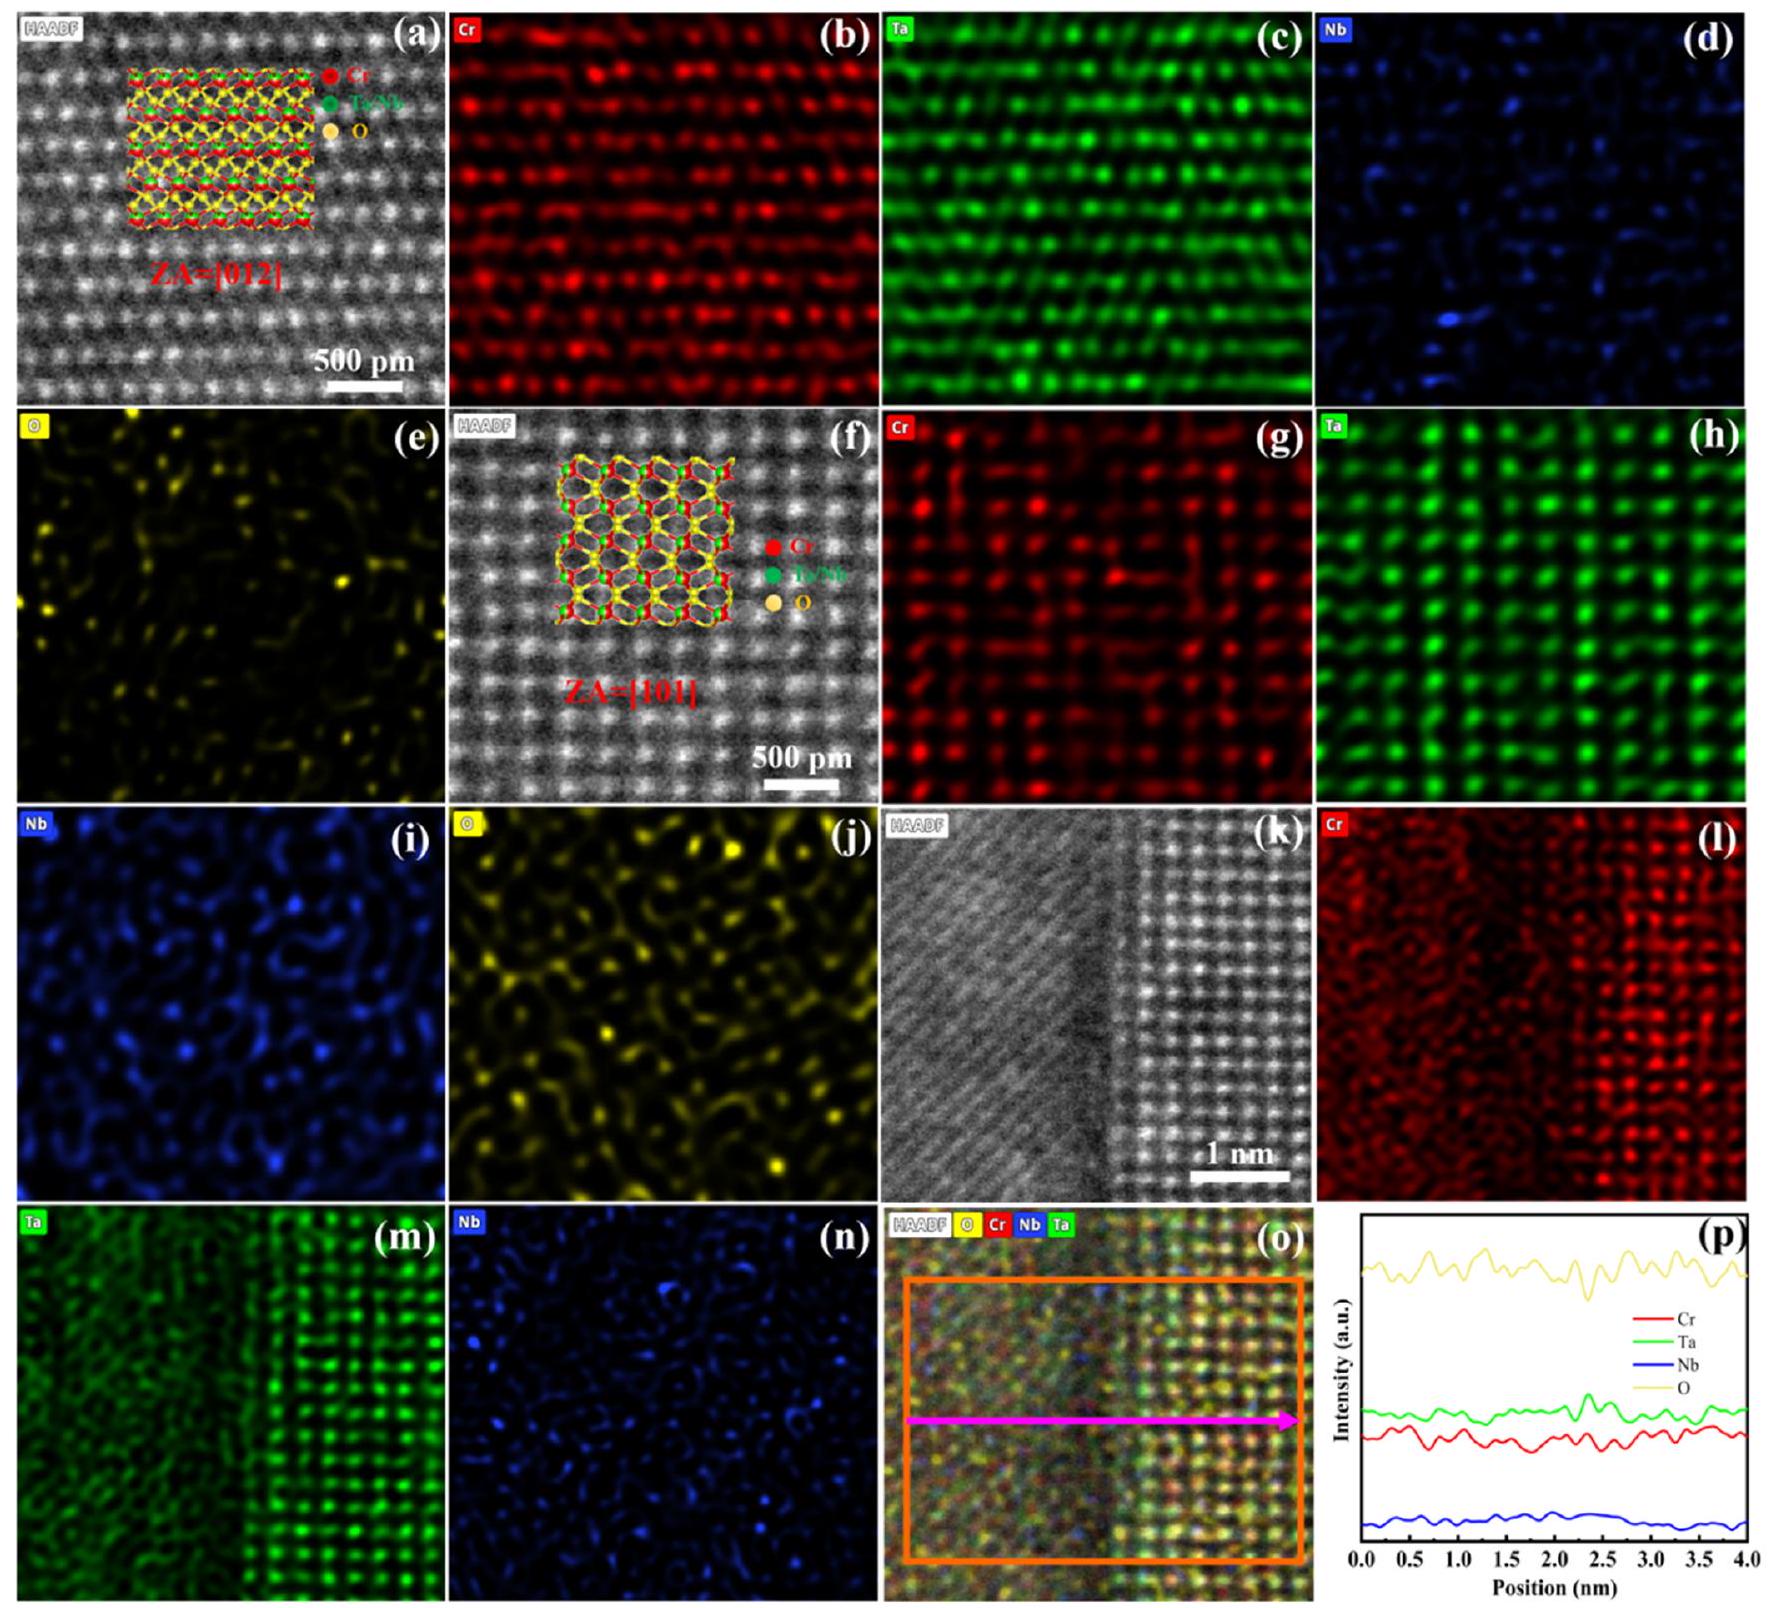
Fig. 6. (a) HAADF image of rutile-type CrTa0.5Nb0.5O4 in [012] zone axis. (b-e) EDS element mapping of Cr,Ta,Nb and O corresponding to the HAADF in Fig. 6(a). (f) HAADF image of rutile-type CrTa0.5Nb0.5O4 in [101] zone axis. (g-j) EDS element mapping of Cr,Ta,Nb and O corresponding to the HAADF in Fig. 6(f). (k) HAADF image of a grain boundary with the right grain in [101] zone axis, (l-n) EDS element mapping of Cr,Ta, and Nb corresponding to the HAADF in Fig. 6(k). (o) The merged mapping image of Cr,Ta,Nb and O, position of line scanning across the grain boundary is shown in the orange box. (p) Distribution of Cr (red), Ta (green), Nb (blue) and O (yellow) across the grain boundary along the purple line shown in Fig. 6(o).
Other figure/table from this article