×
Title
Text
Close
Close
Submit
Cancel
Confirm
×
Title
×
Search
Submit
Toggle navigation
Home
About Journal
Journal Information
Editorial Board
Awards
Journal Metrics
Contact
Journal Online
Just Accepted
Current Issue
Highlights
Archive
Most Read
Most Download
Most Cited
Guide for Authors
Subscribe
EM in ScienceDirect
Figure/Table detail
Corrosion performance of high-entropy (Ho
0.2
Er
0.2
Tm
0.2
Yb
0.2
Lu
0.2
)
2
Si
2
O
7
environmental barrier coating material under CMAS conditions at 1500 ℃
Zhang Zhenya, Yuan Shuai, Zhu Zihao, Gao Wei, Meng Yifan, Xue Zhaolu, Xiang Tengfei, Shen Yizhou, Yan Kai, Gyawali Gobinda, Zhang Shihong
Extreme Materials
, DOI:
10.1016/j.exm.2026.01.001
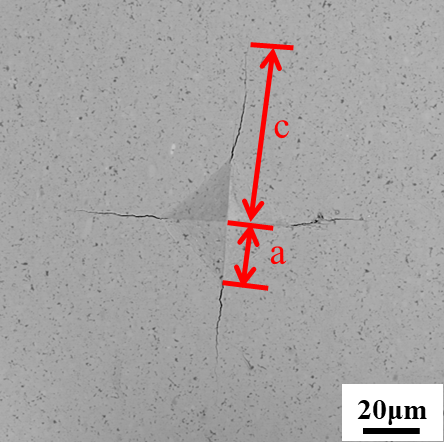
Fig. 6
Schematic diagram of microhardness of high-entropy (5RE
0.2
)
2
Si
2
O
7
Other figure/table from this article
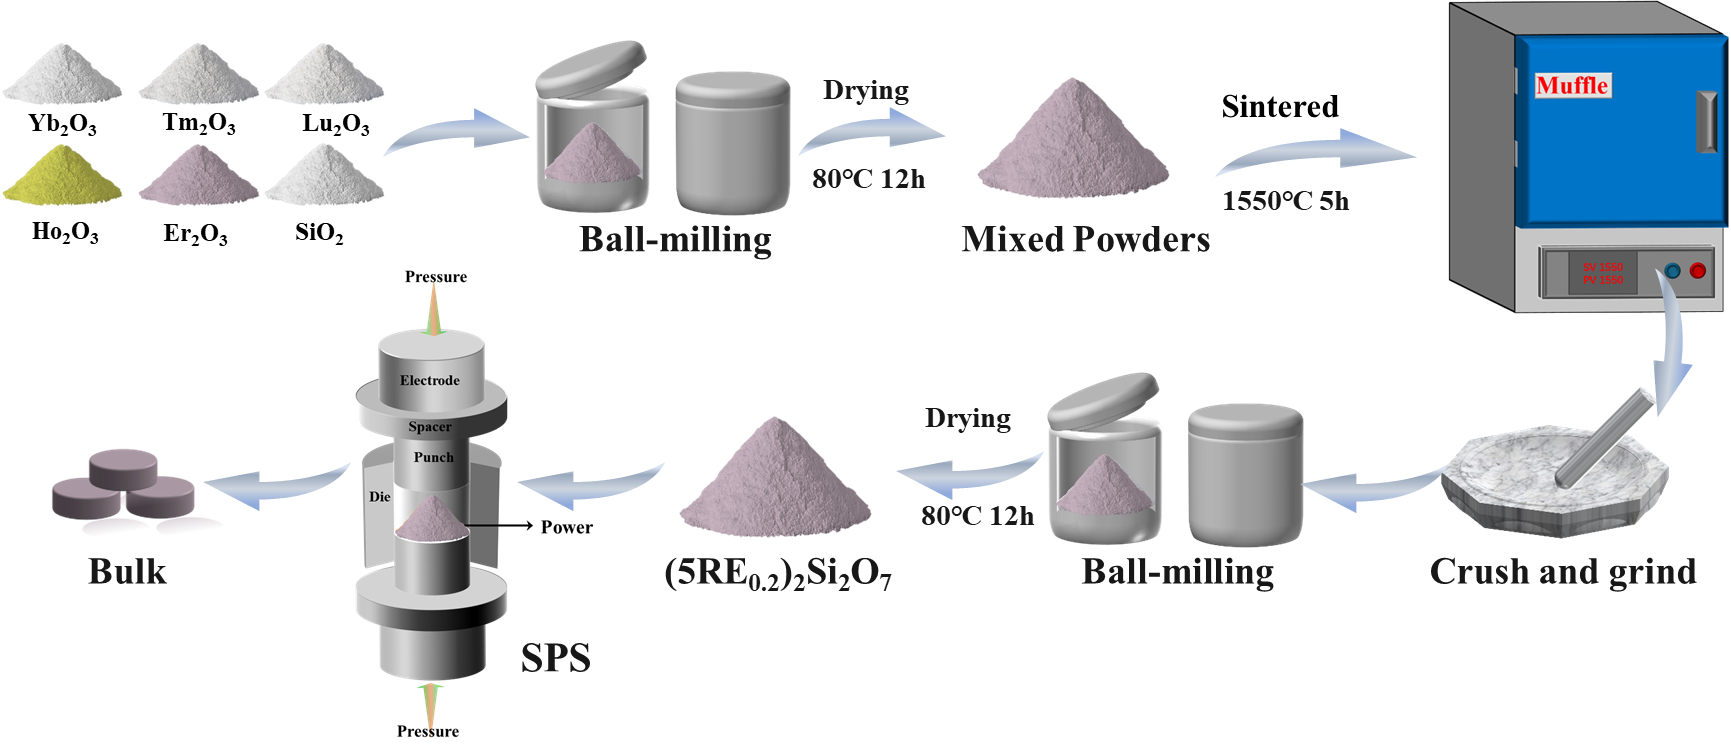
Fig.1
Schematic diagram of preparation of (5RE
0.2
)
2
Si
2
O
7
powder and bulk.
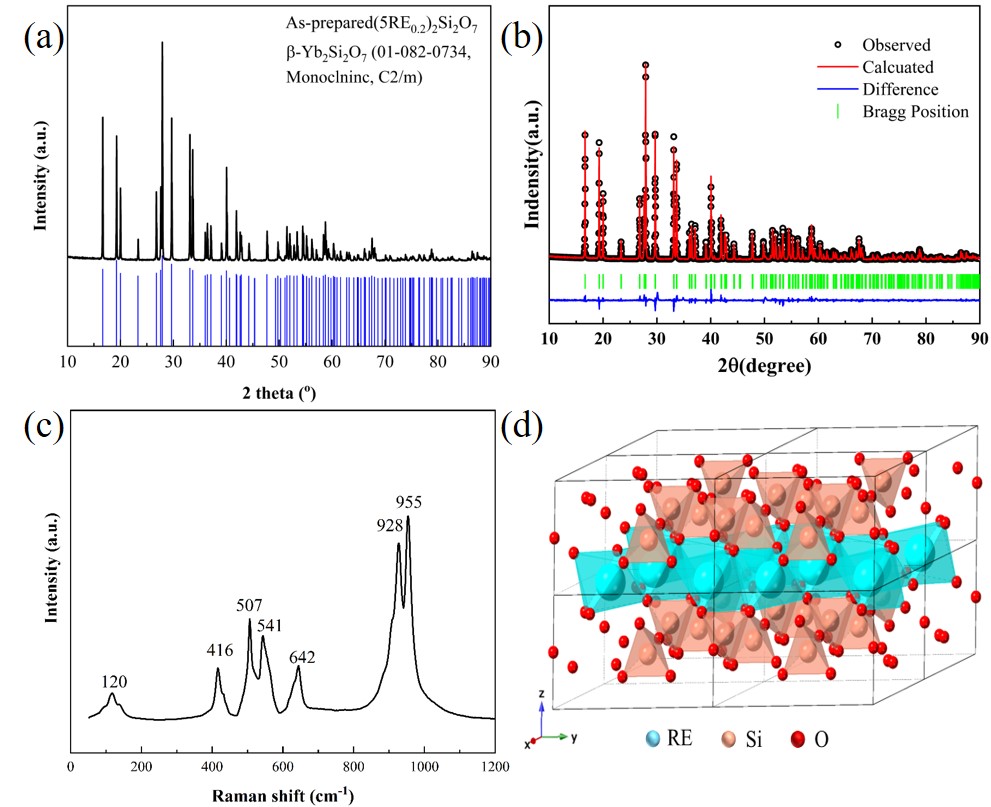
Fig.2
XRD patterns (a), Rietveld refinement of XRD pattern (b), Raman spectrum (c), and crystal structure (d) of high-entropy (5RE
0.2
)
2
Si
2
O
7
Table 1
Crystal structure parameters of high-entropy (5RE
0.2
)
2
Si
2
O
7
and individual RE
2
Si
2
O
7
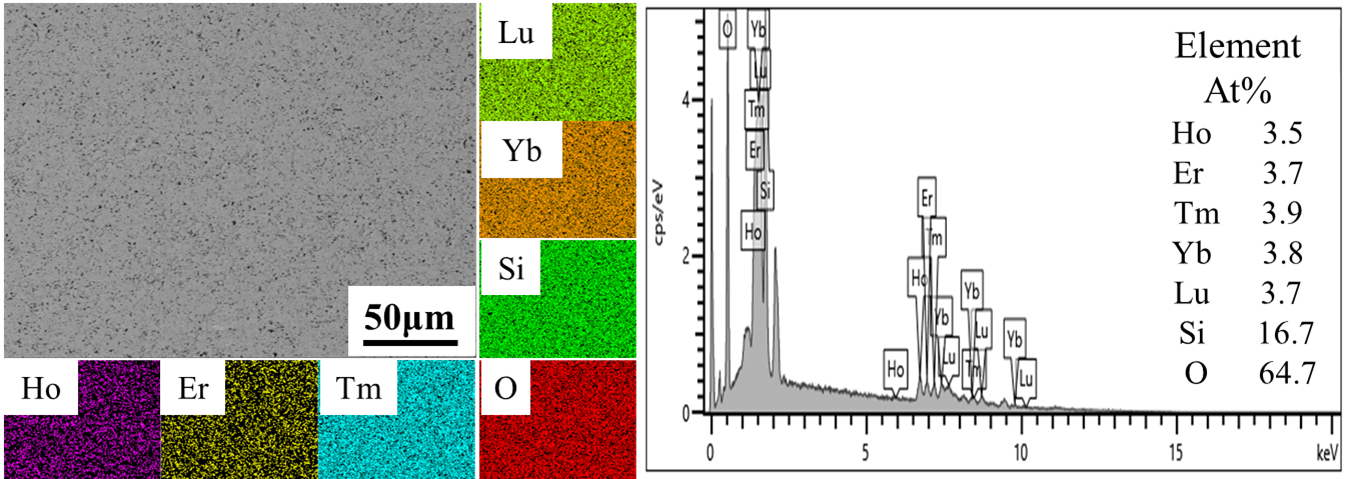
Fig. 3
Microstructure, EDS maps, and elemental composition of high-entropy (5RE
0.2
)
2
Si
2
O
7
ceramic
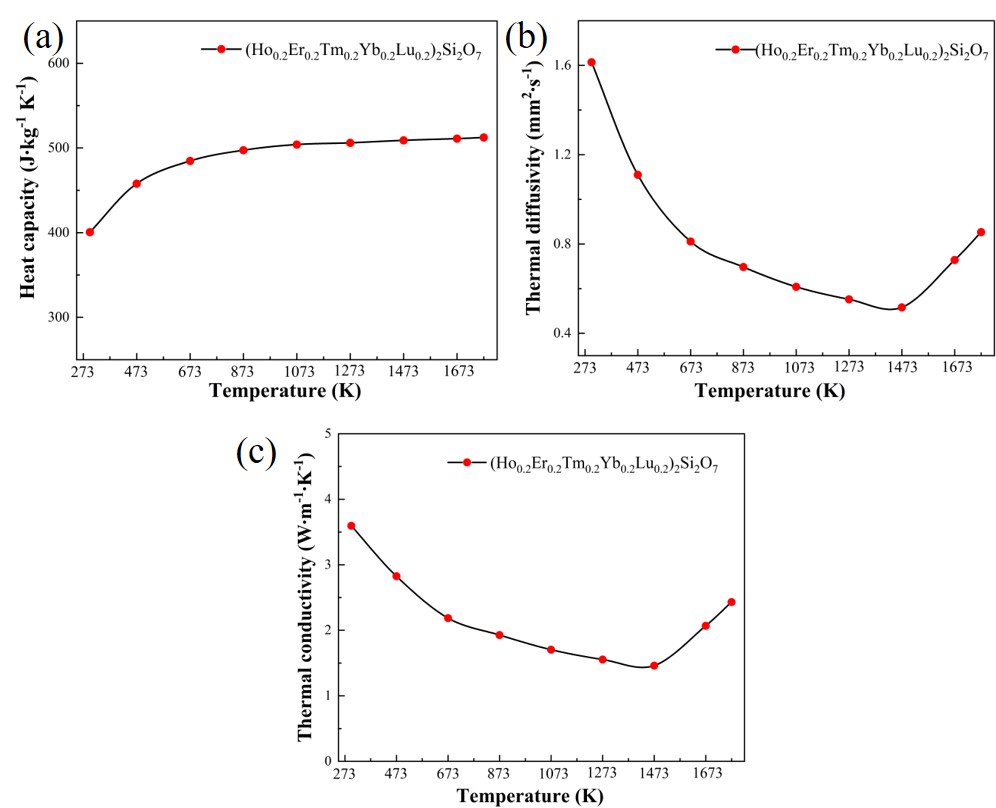
Fig. 4
Heat capacity (a), thermal diffusivity coefficient (b), and thermal conductivity (c) of high-entropy (5RE
0.2
)
2
Si
2
O
7
ceramic
Table 2.
Thermal conductivity of (5RE
0.2
)
2
Si
2
O
7
and each single principal RE
2
Si
2
O
7
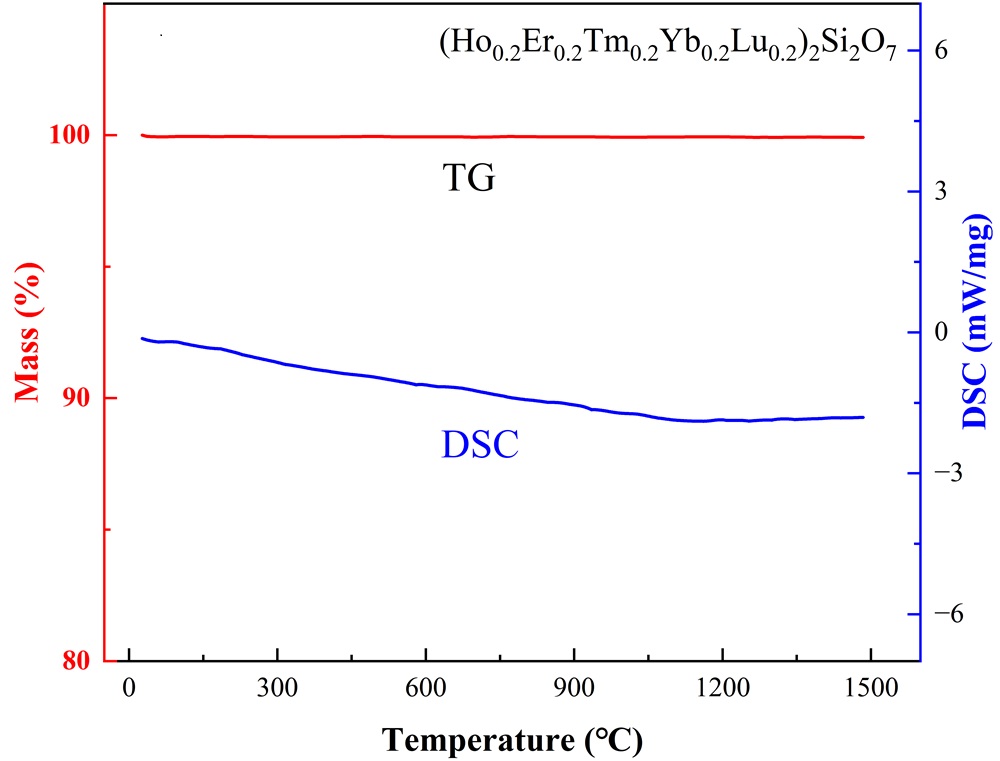
Fig. 5
TG/DSC curves of high-entropy (5RE
0.2
)
2
Si
2
O
7
from room temperature to 1500 °C
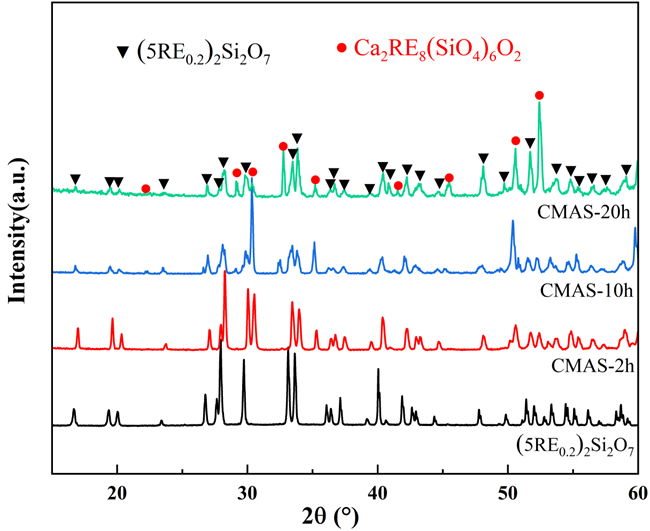
Fig.7
XRD patterns of the molten CMAS corrosion of (5RE
0.2
)
2
Si
2
O
7
pellets for different times at 1500℃
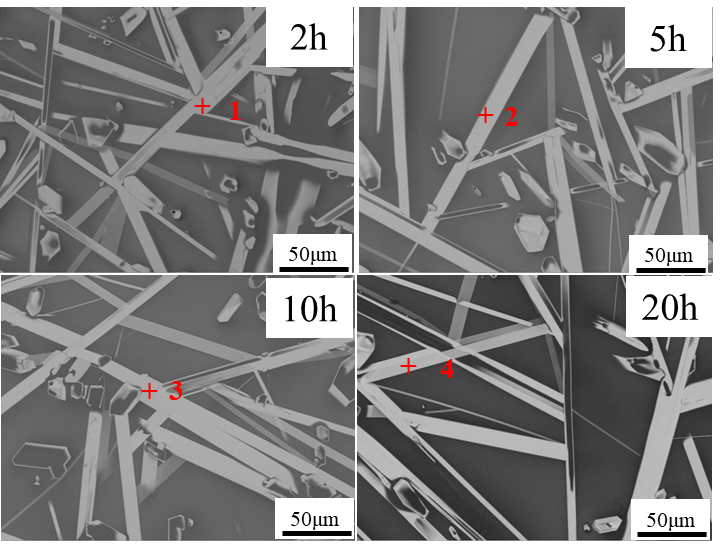
Fig.8
Surface morphologies of the molten CMAS corrosion of (5RE
0.2
)
2
Si
2
O
7
pellets for various durations at 1500 °C
Table 3
Atomic ratios (at%) of the corresponding points in
Fig. 8
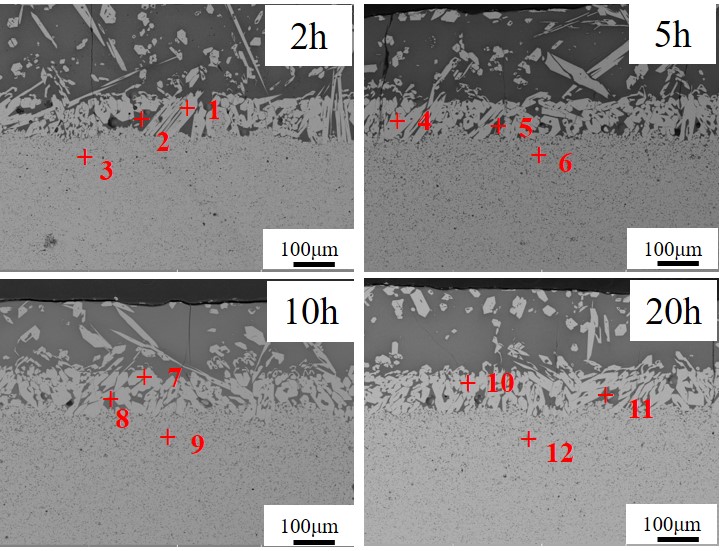
Fig. 9
Cross-sectional microstructures of the molten CMAS corrosion of (5RE
0.2
)
2
Si
2
O
7
pellets for different times at 1500 °C.
Table 4
Atomic ratios (at%) of the corresponding points in
Fig. 9
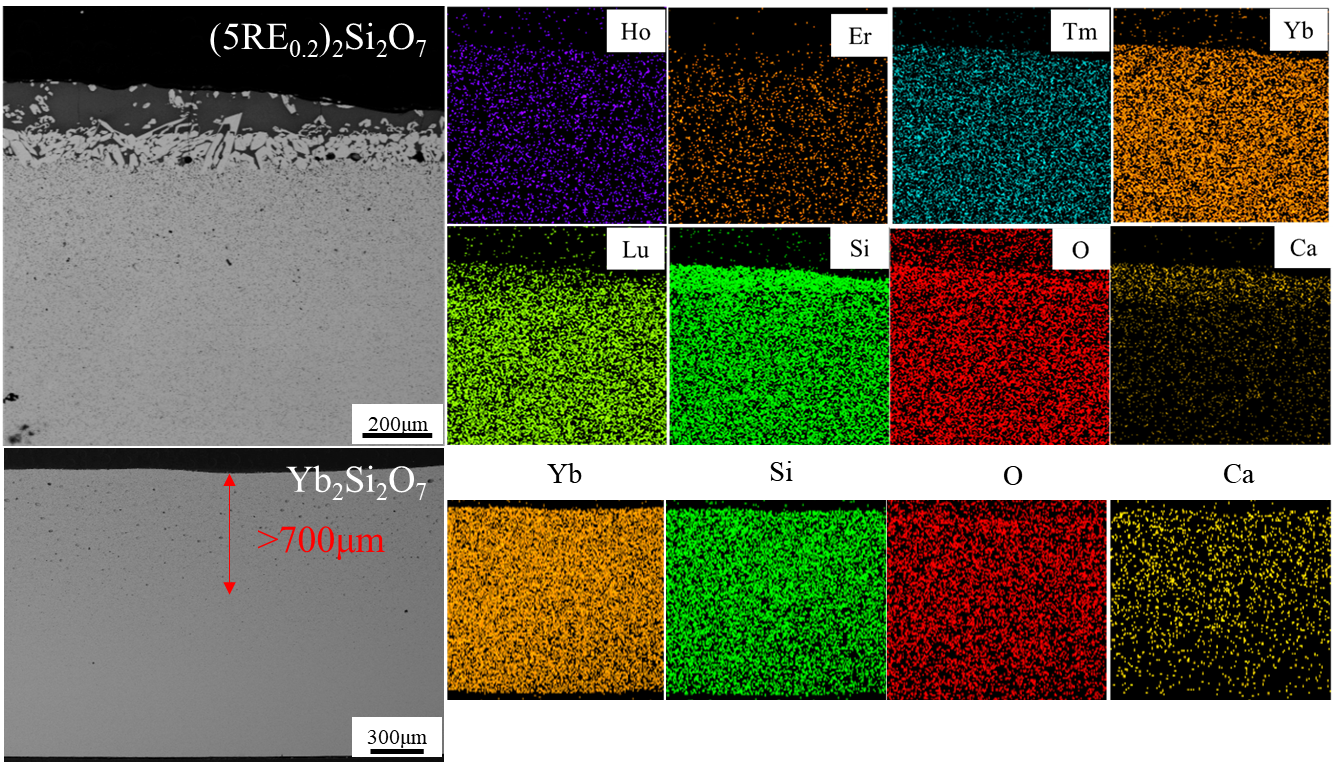
Fig. 10
Cross-sectional microstructures and EDS maps of (5RE
0.2
)
2
Si
2
O
7
and Yb
2
Si
2
O
7
pellets after CMAS corrosion for 20 h at 1500 ℃
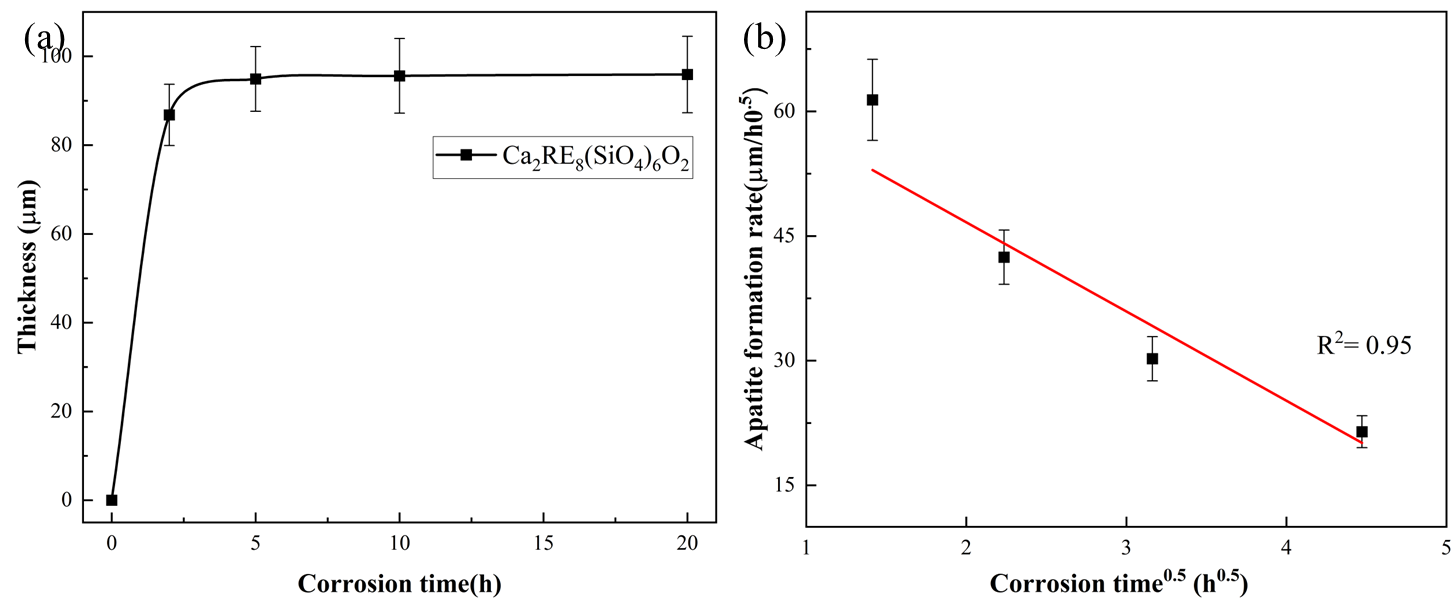
Fig.11
Reaction layer thickness in (5RE
0.2
)
2
Si
2
O
7
ceramic (a), and average apatite formation rate (μm/h
0.5
) vs. corrosion time
0.5
(h
0.5
) for Yb
2
Si
2
O
7
ceramic (b) pellets during CMAS corrosion for different times at 1500 ℃