×
模态框(Modal)标题
在这里添加一些文本
Close
Close
Submit
Cancel
Confirm
×
模态框(Modal)标题
×
Submit
Search
Toggle navigation
Home
About Journal
Journal Information
Editorial Board
Awards
Journal Metrics
Contact
Journal Online
Just Accepted
Current Issue
Highlights
Archive
Most Read
Most Download
Most Cited
Guide for Authors
Subscribe
EM in KeAi
Figure/Table detail
Progress in the degradation of thermal and environmental barrier coating materials caused by calcium-magnesium-aluminum-silicate deposit
Zhilin Chen, Xingwang Lai, Yuting Liang, Lingxi Qu, Zhilin Tian, Bin Li
Extreme Materials
, 2025, 1(
1
): 9-37. DOI:
10.1016/j.exm.2024.12.001
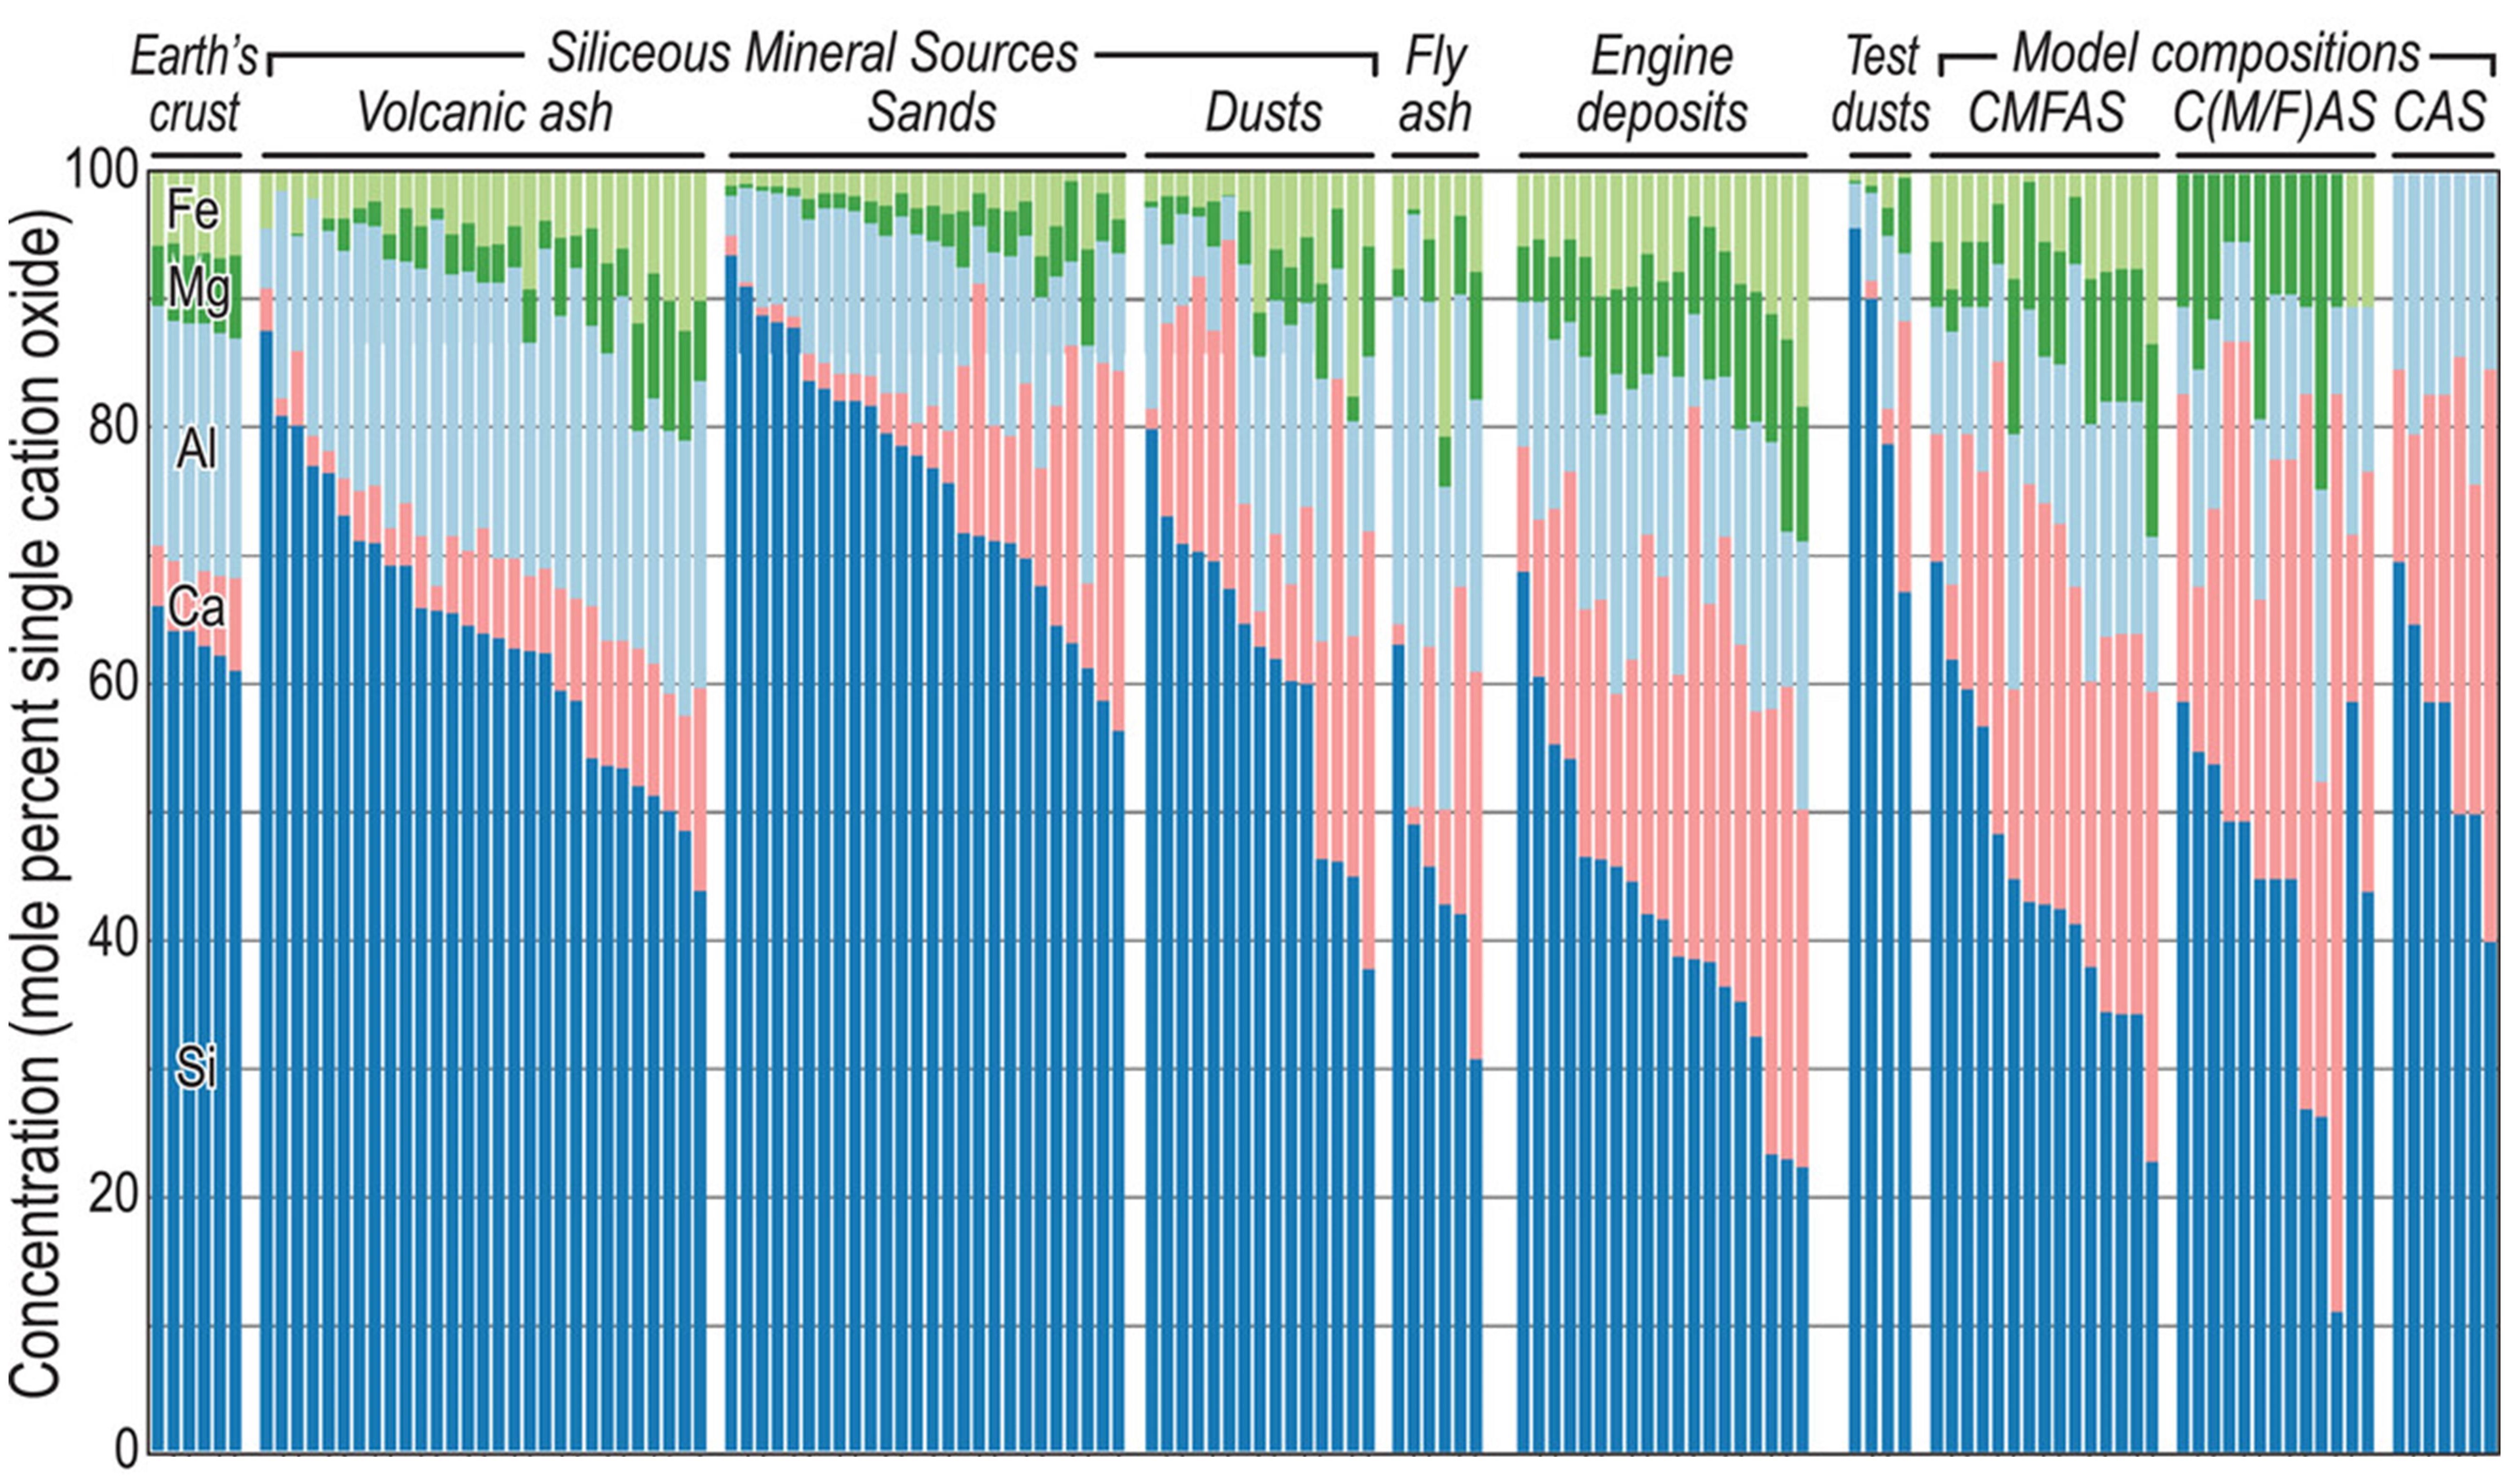
Fig. 7
The composition of CMAS from different sources. Reproduced with permission from Ref. [
33
], © Wiley Online Library 2022.
Other figure/table from this article
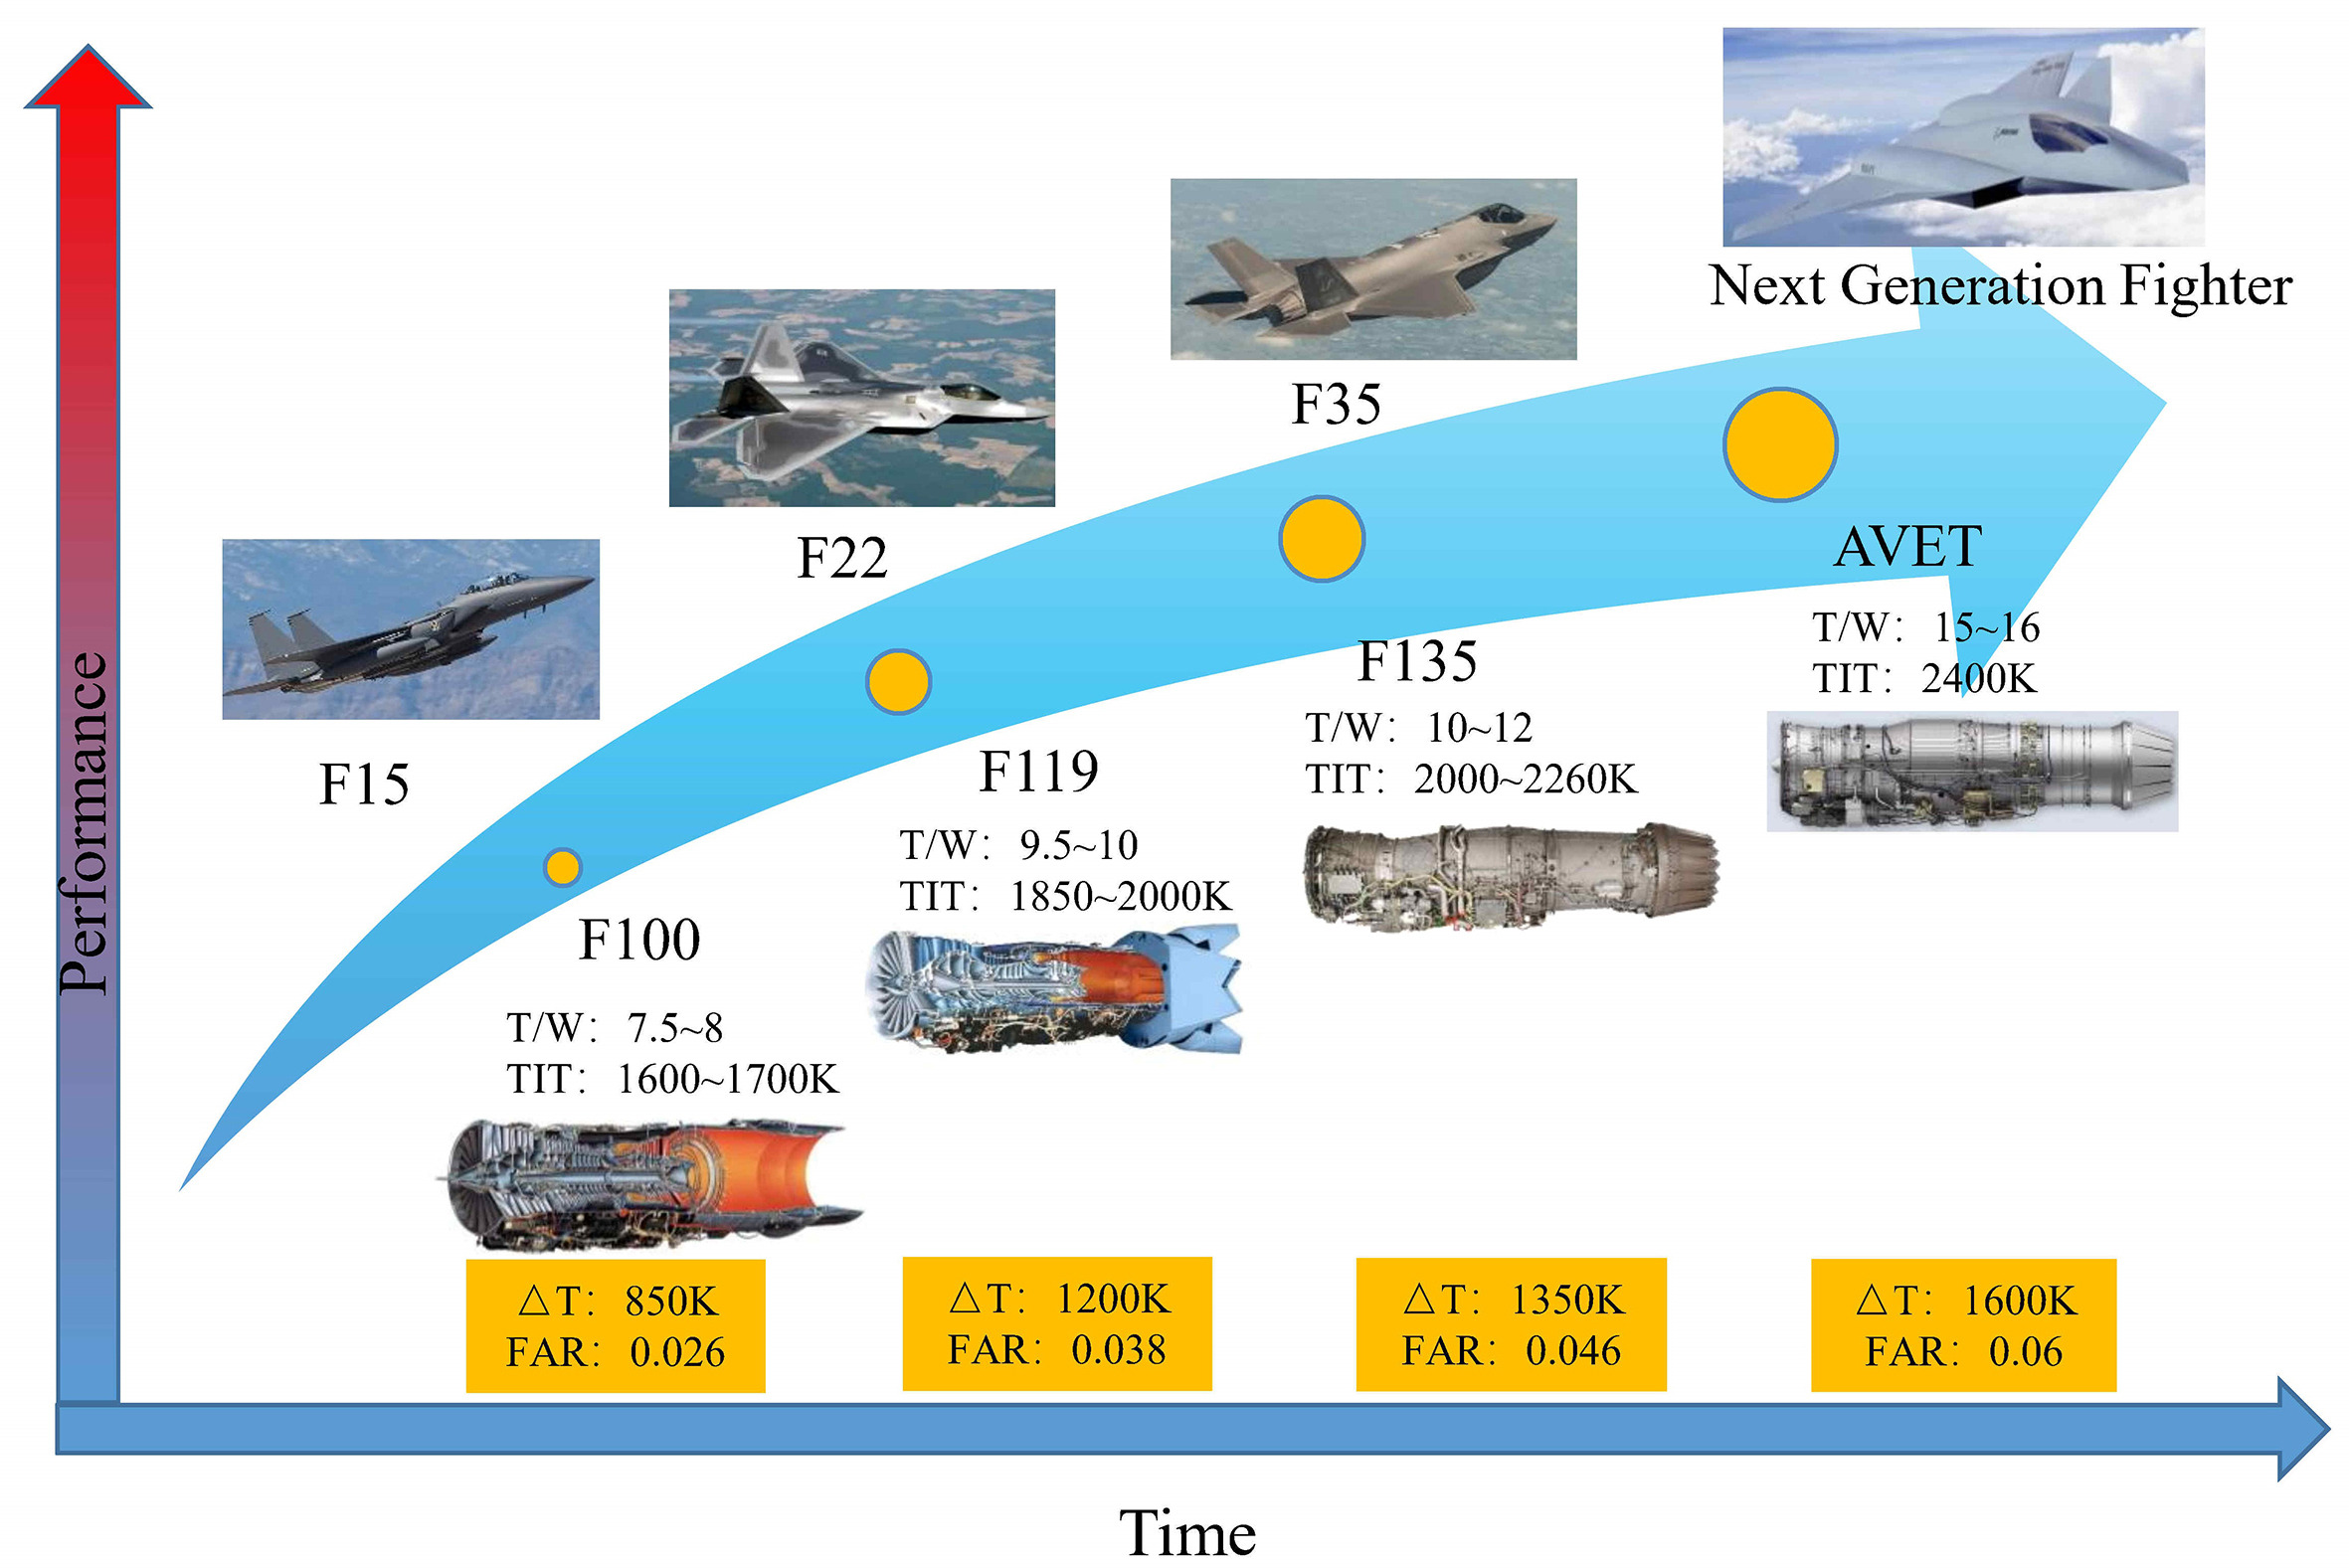
Fig. 1
Development trend of the engine and its combustor. Reproduced with permission from Ref. [
5
], © Elsevier 2023.
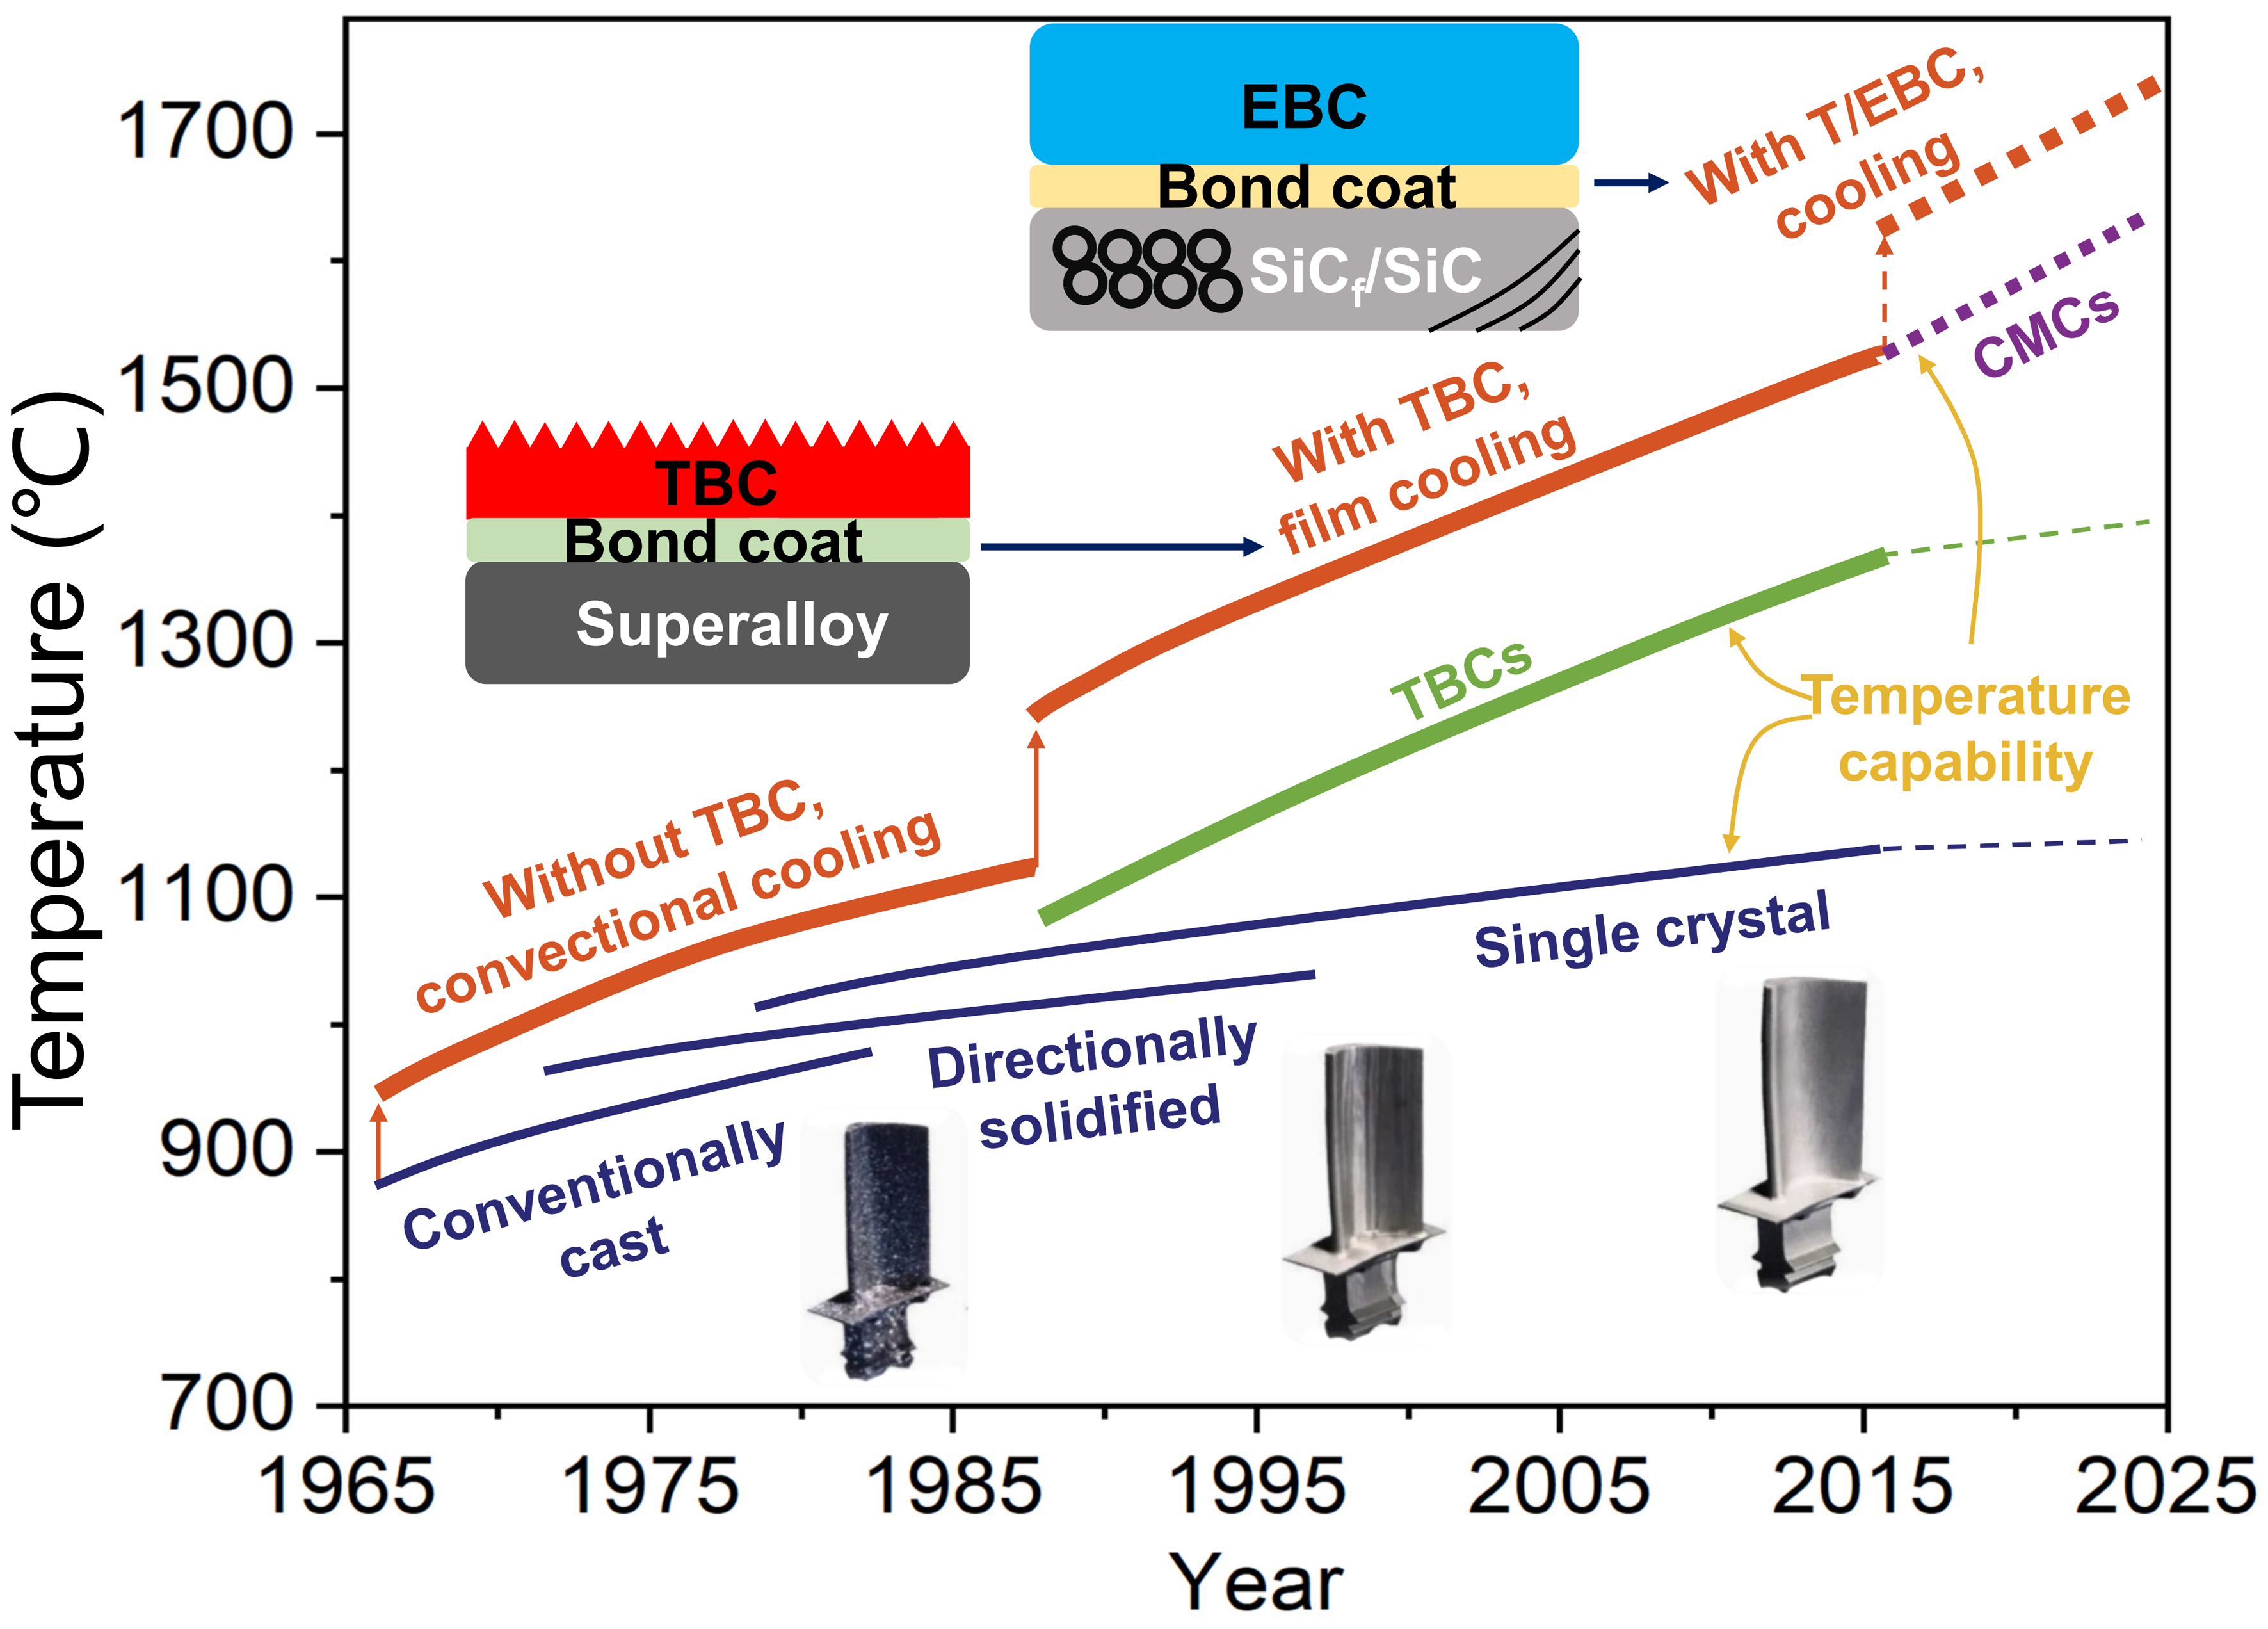
Fig. 2
The progression and projection of temperature capabilities of Ni-based superalloy, TBC, EBC and CMC gas-turbine engine materials, and maximum allowable gas temperatures with cooling [
6
].
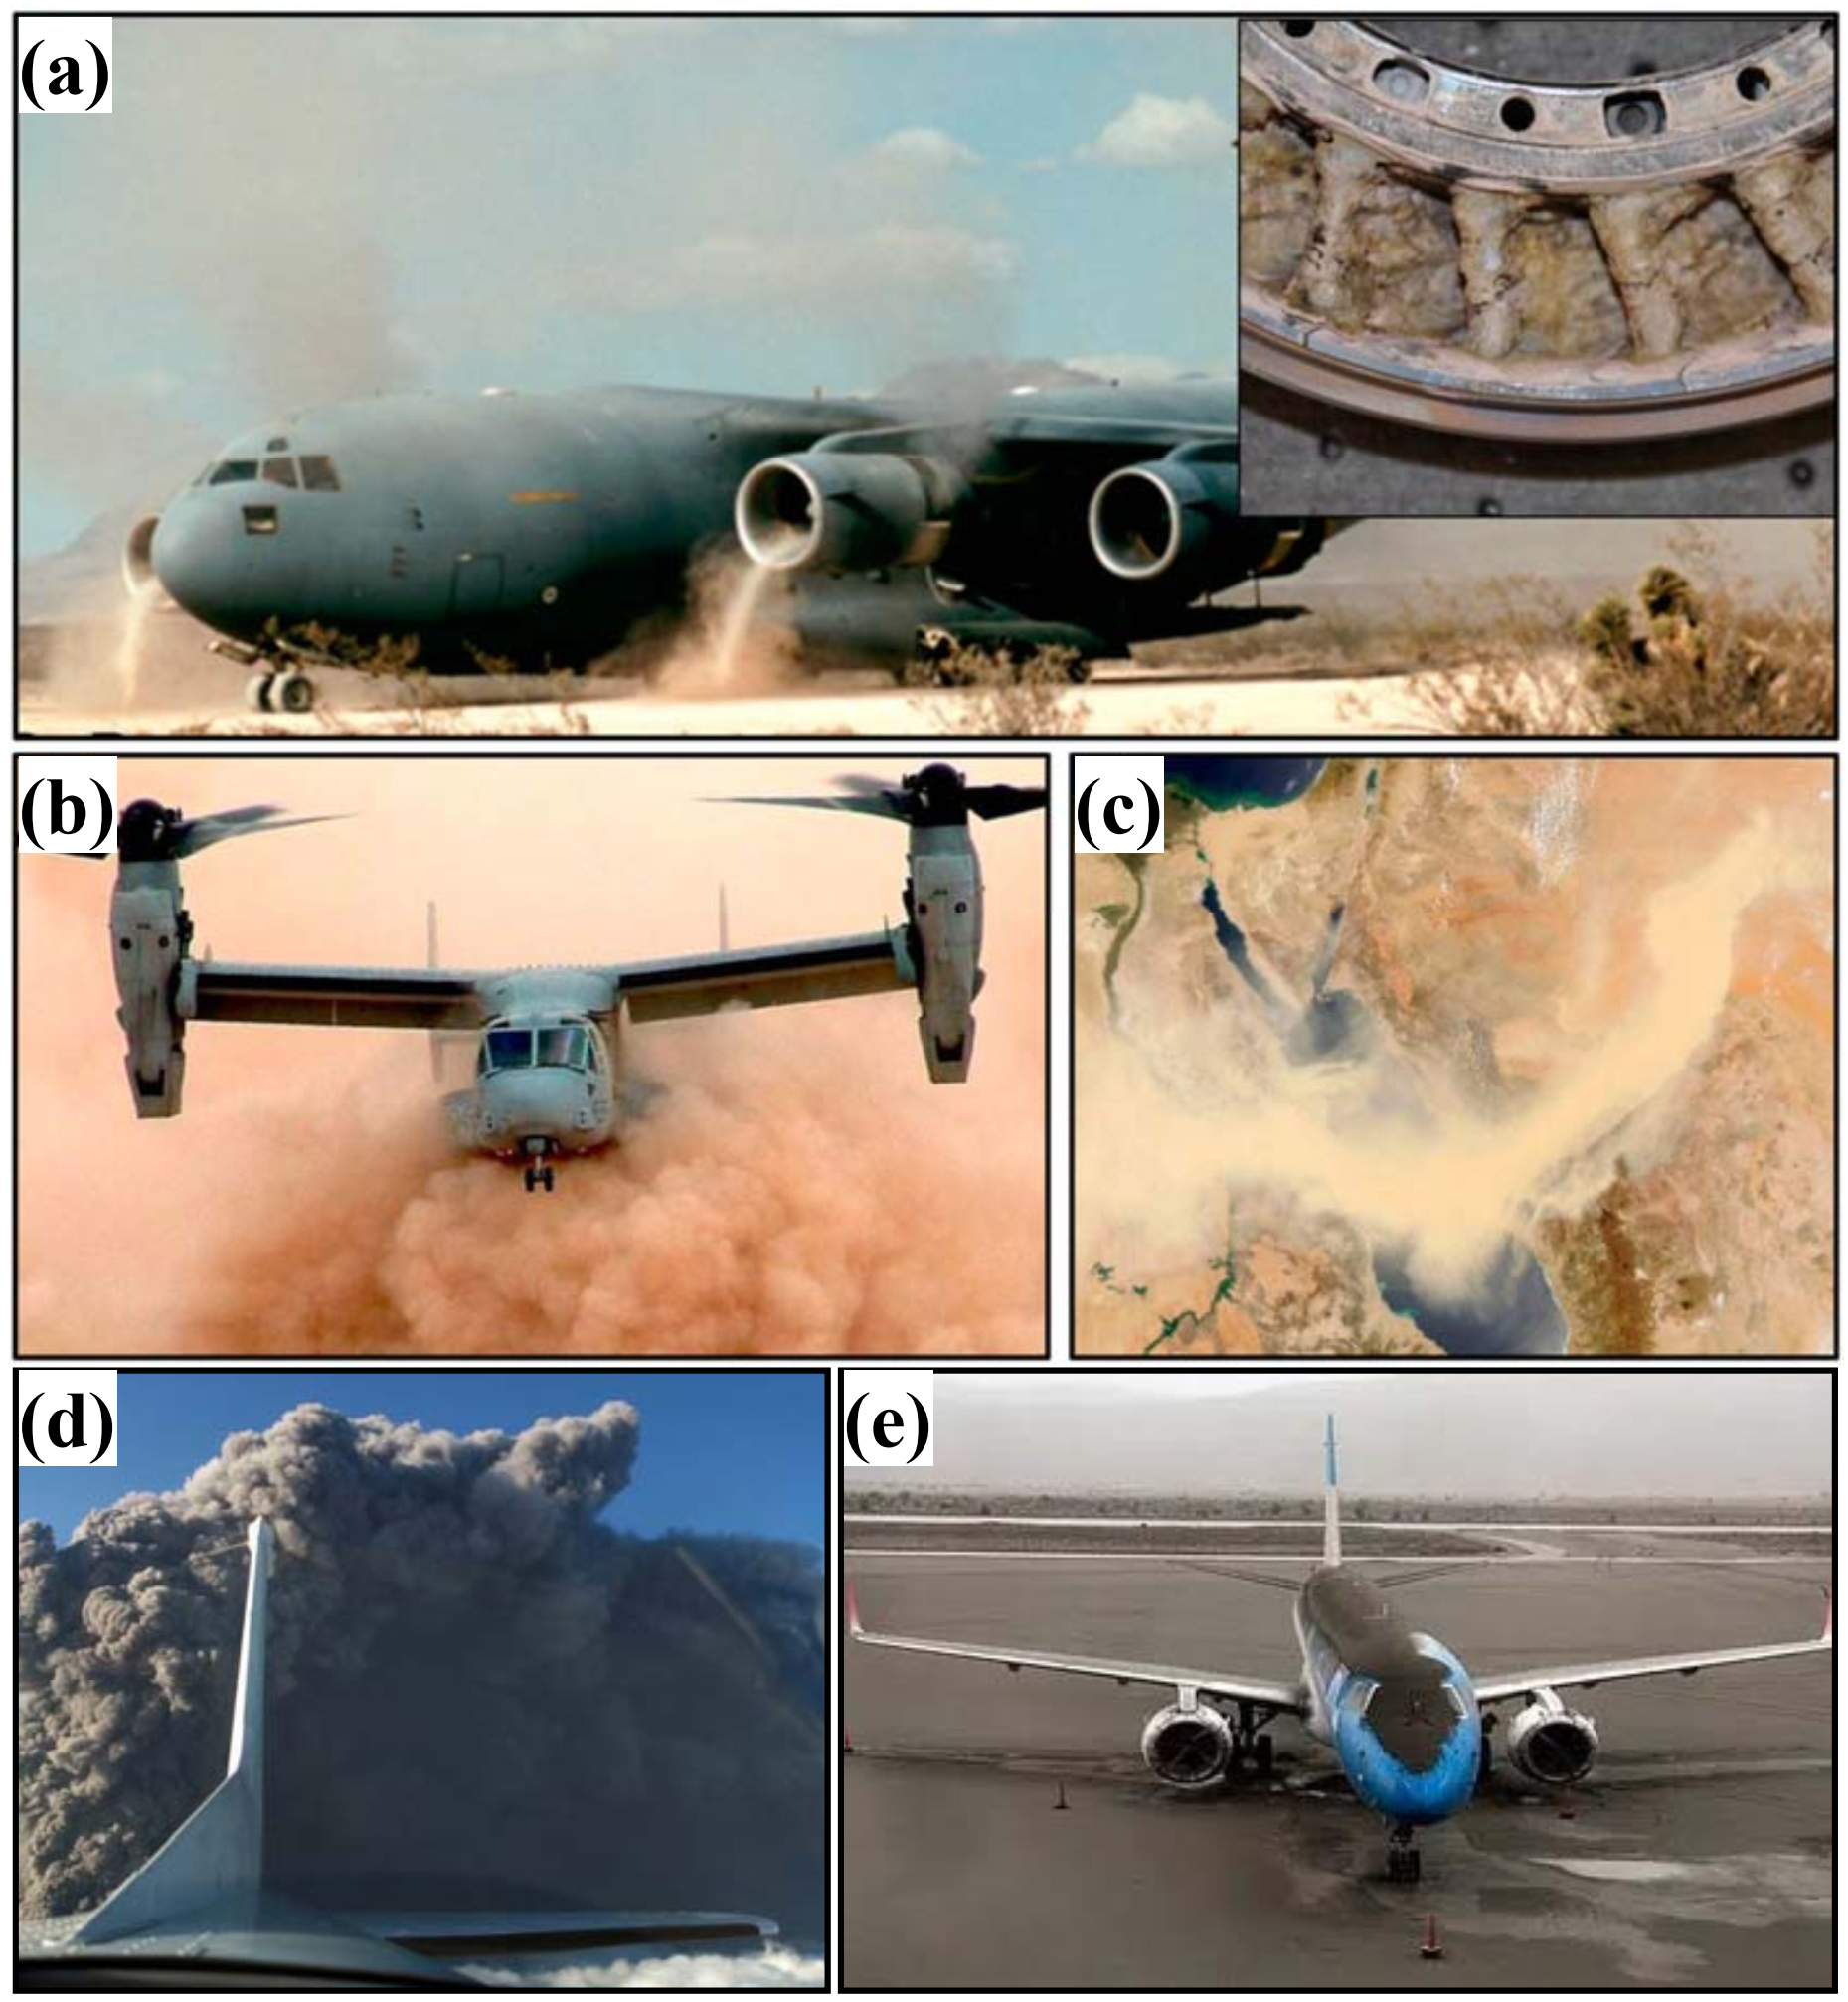
Fig. 3
(a) C-17 military aircraft ingesting sand during take-off on unimproved runway Inset: Gas turbine engine vanes with molten CMAS deposits, (b) NAVY V-22 rotorcraft performing landing maneuver under severe ‘brown-out’ heavy dust/sand conditions, (c) Dust storm across the Red Sea May 13, 2005, (d) A plane passing through a cloud of volcanic ash, and (e) Volcanic ash deposited on aircraft. Reproduced with permission from Ref. [
18
], © Sage 2021.
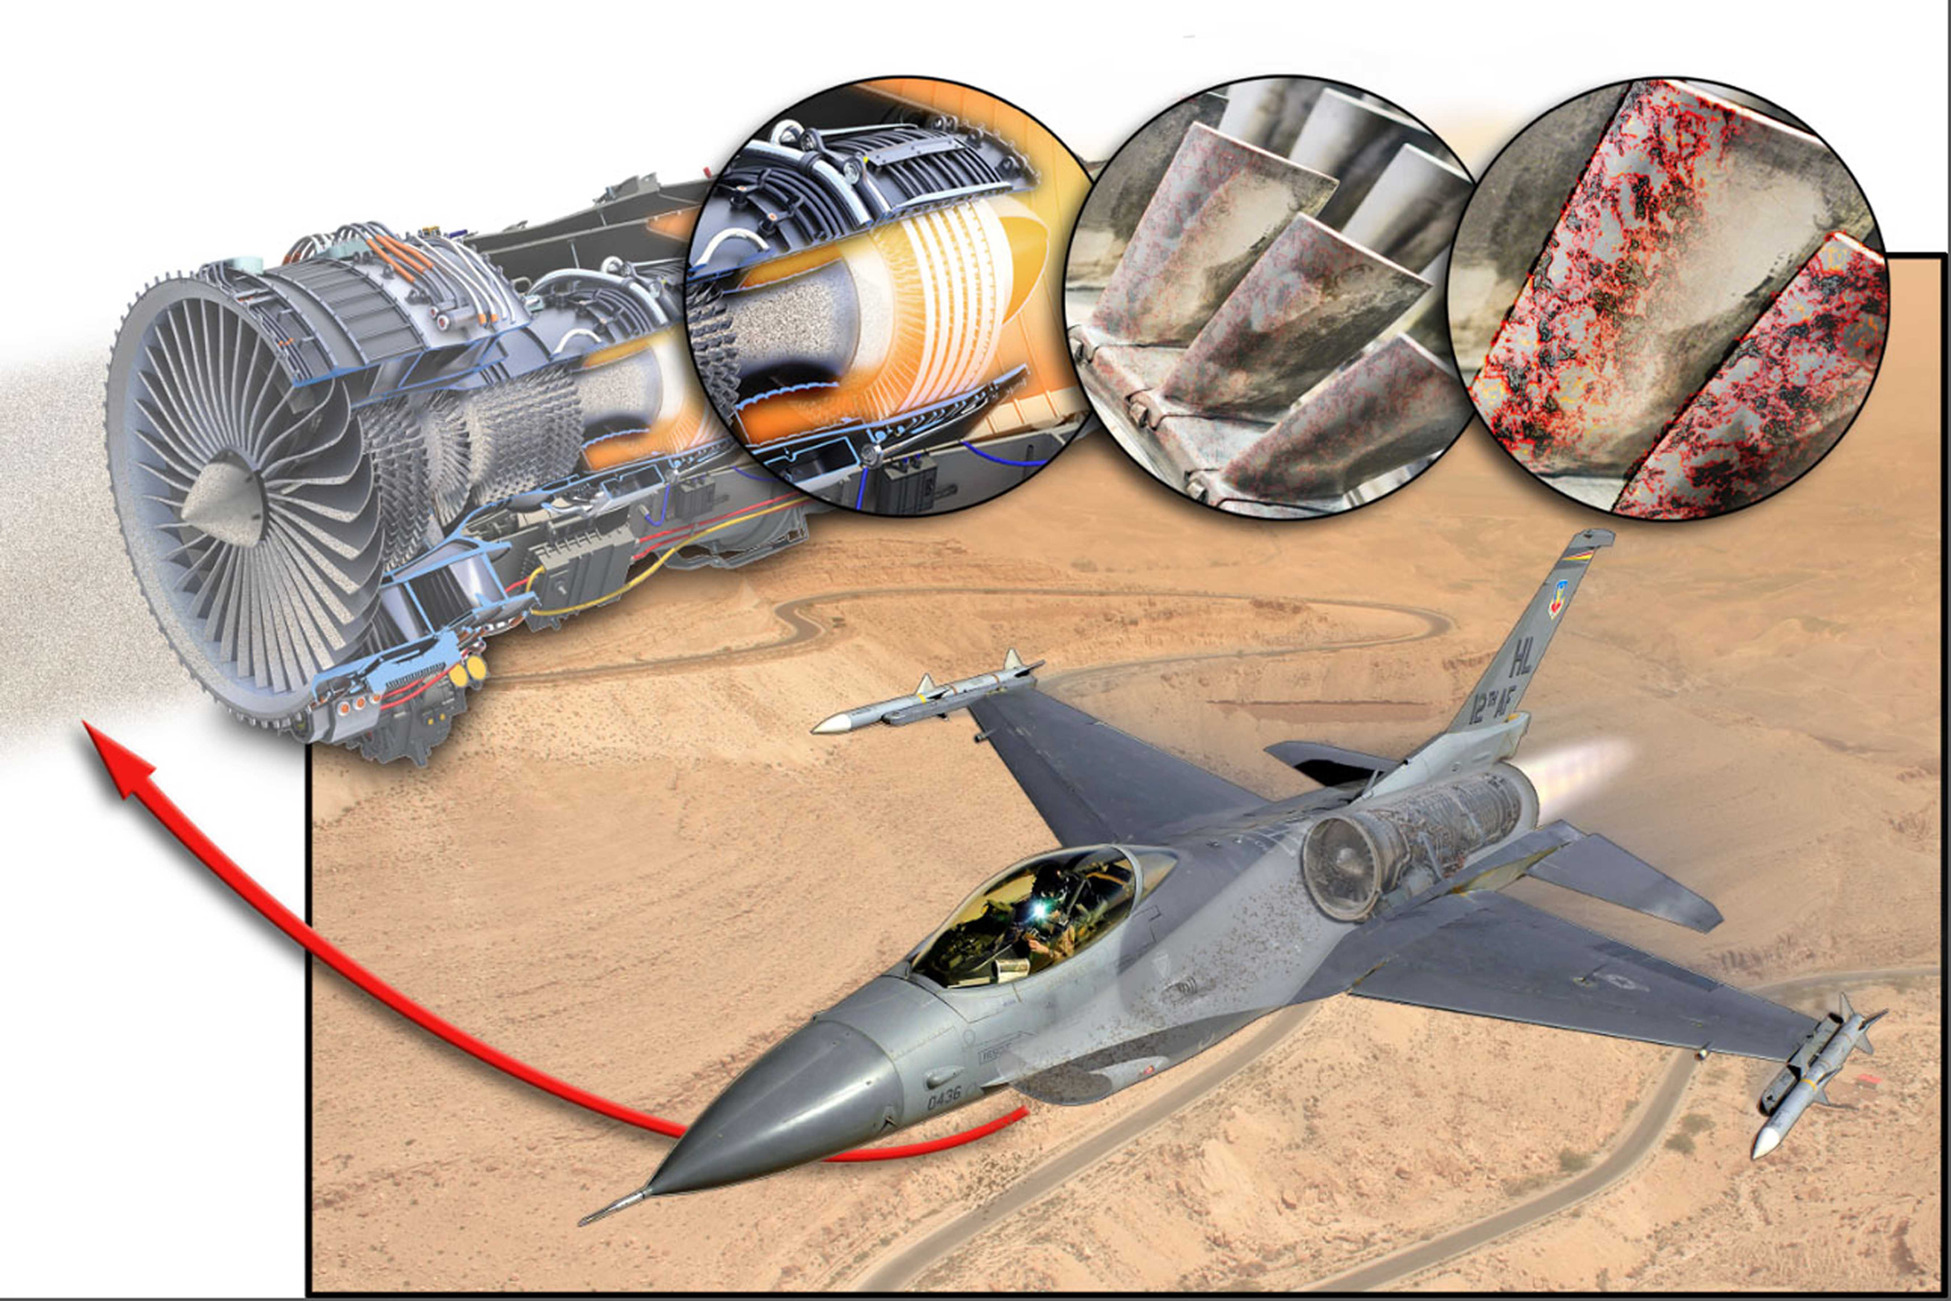
Fig. 4
Military aircraft flying during a sand storm in an arid region. Image insert—mineral dust particles passing through the gas-turbine and corroding the ceramic coatings and metallic surfaces of the hot section components. Reproduced with permission from Ref. [
21
], © Wiley Online Library 2019.
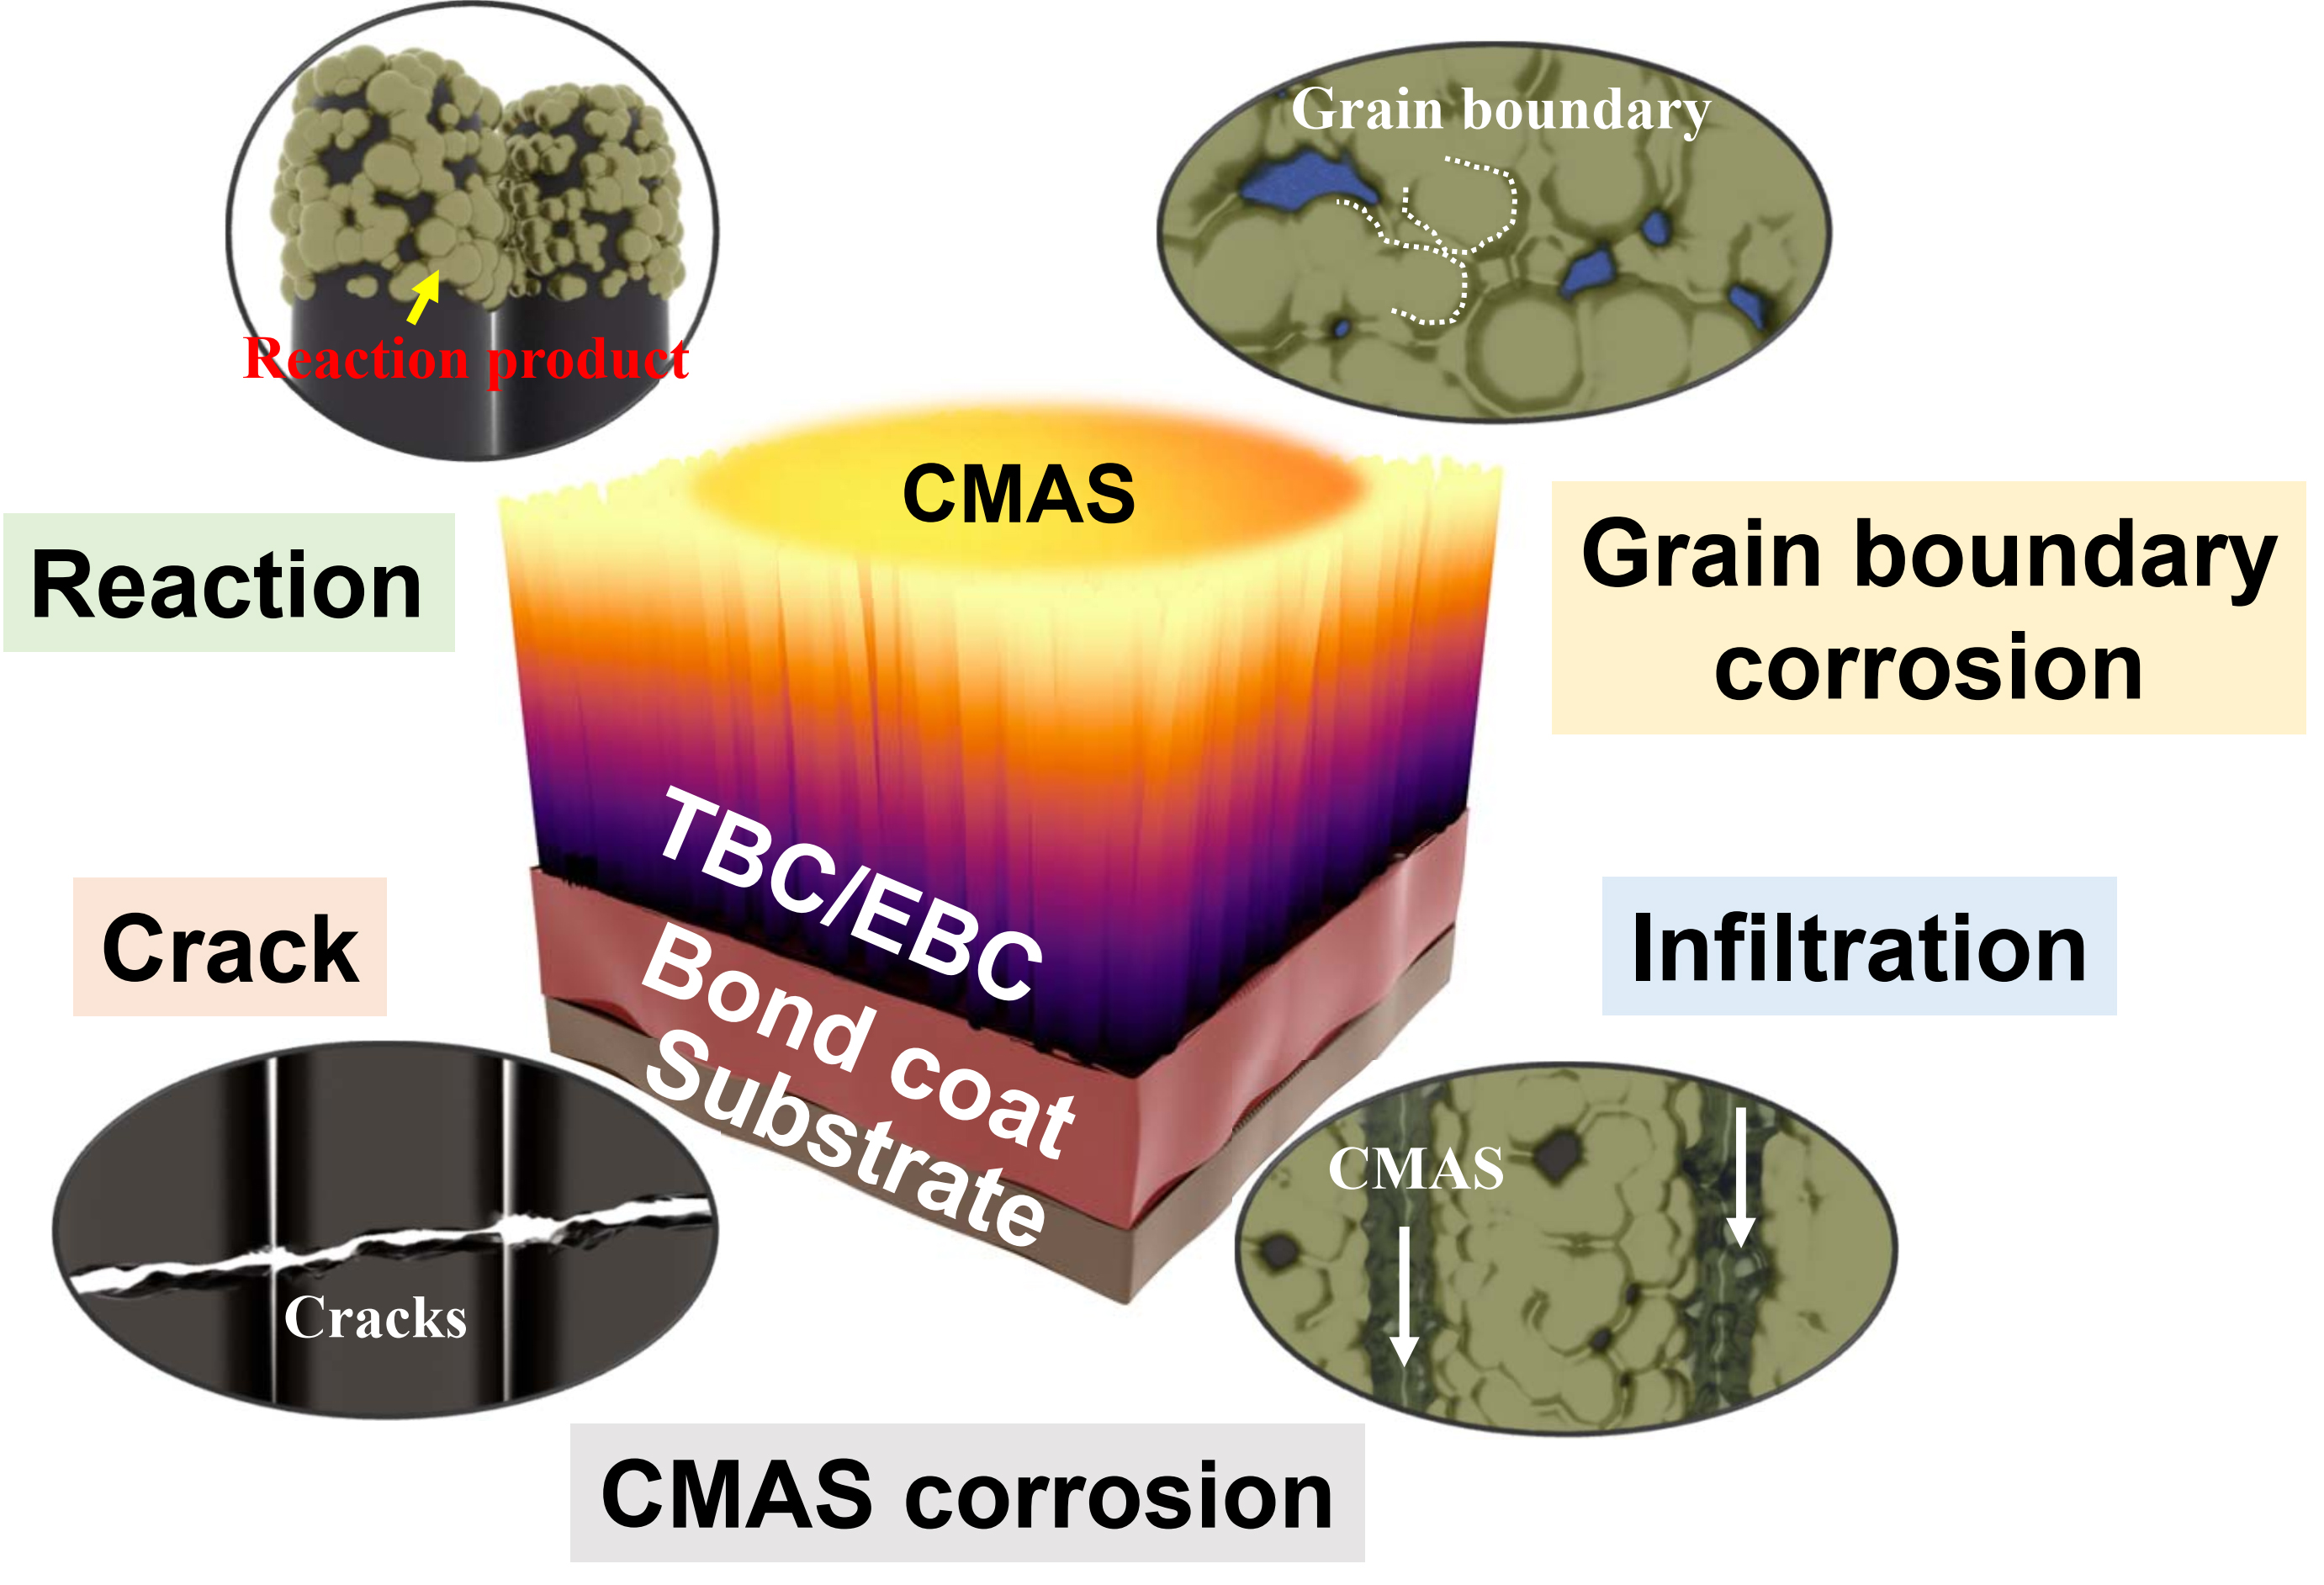
Fig. 5
Schematic diagram of failures caused by CMAS on TBCs and EBCs.
Fig. 6
The historical overview of the CMAS corrosion [
23
⇓
⇓
⇓
⇓
⇓
-
29
].
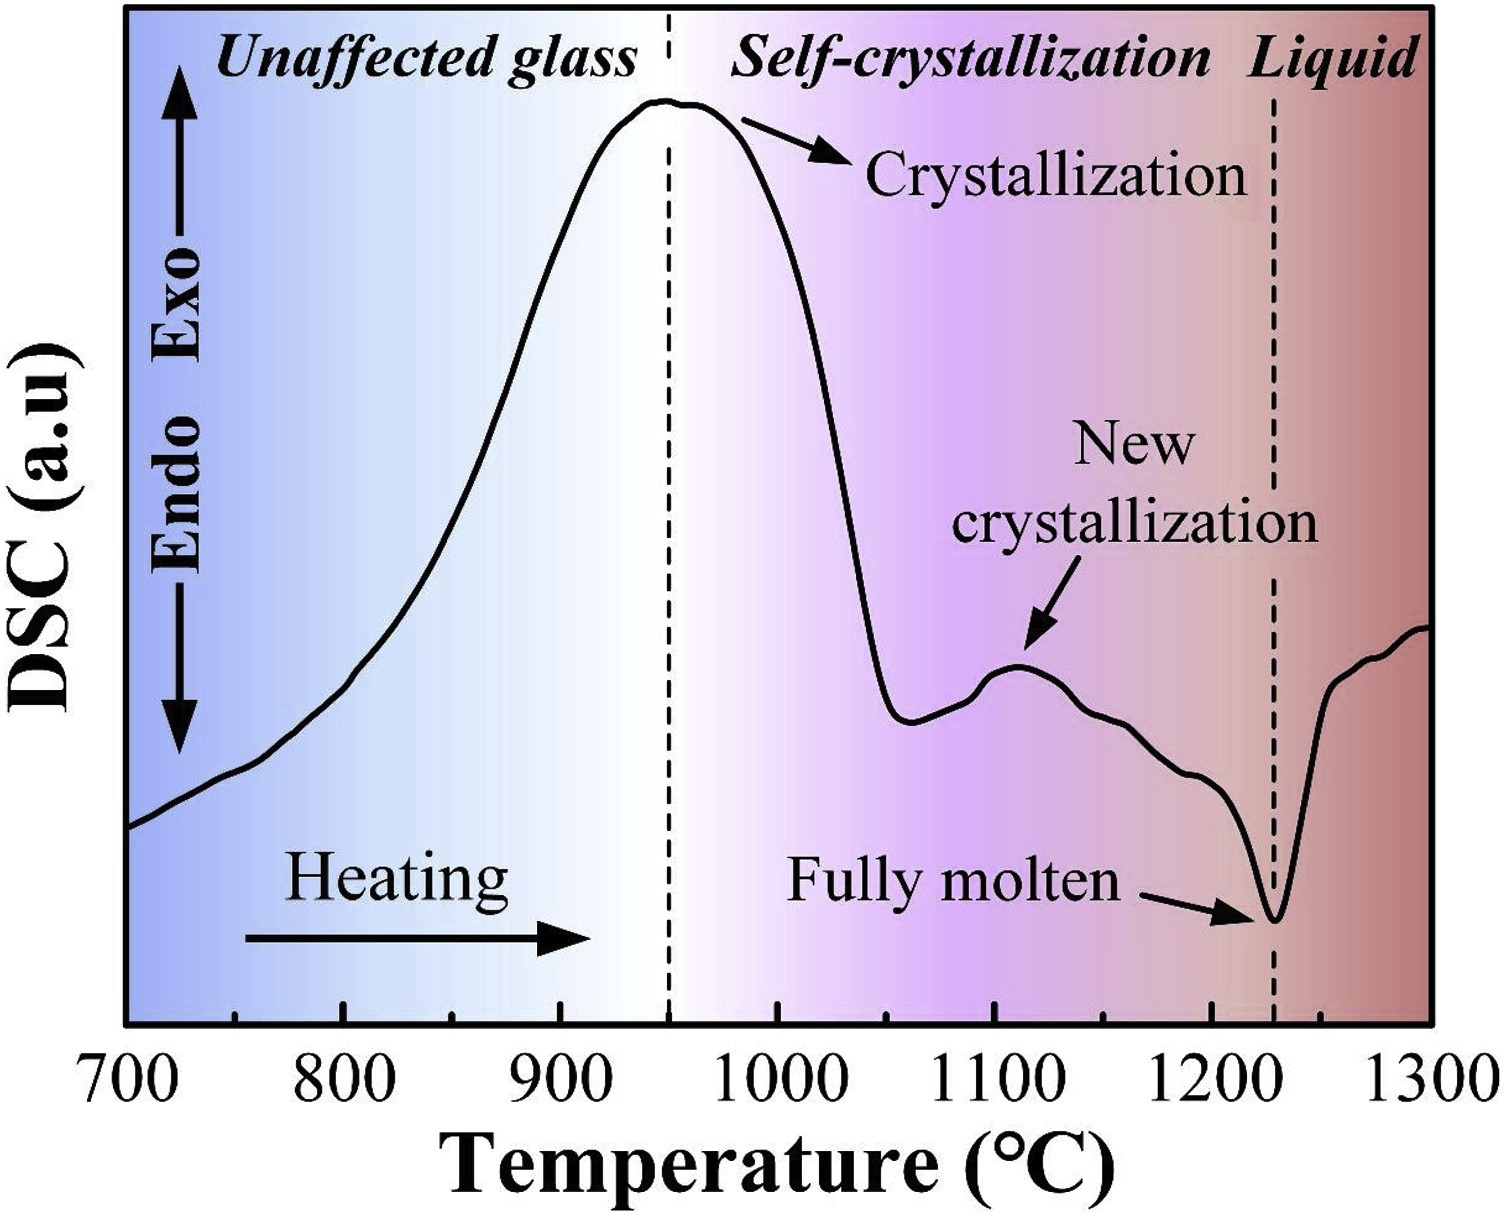
Fig. 8
The DSC curve of CMAS with a composition of 33CaO-9MgO-13AlO
1.5
-45SiO
2
. Reproduced with permission from Ref. [
35
], © Elsevier 2020.
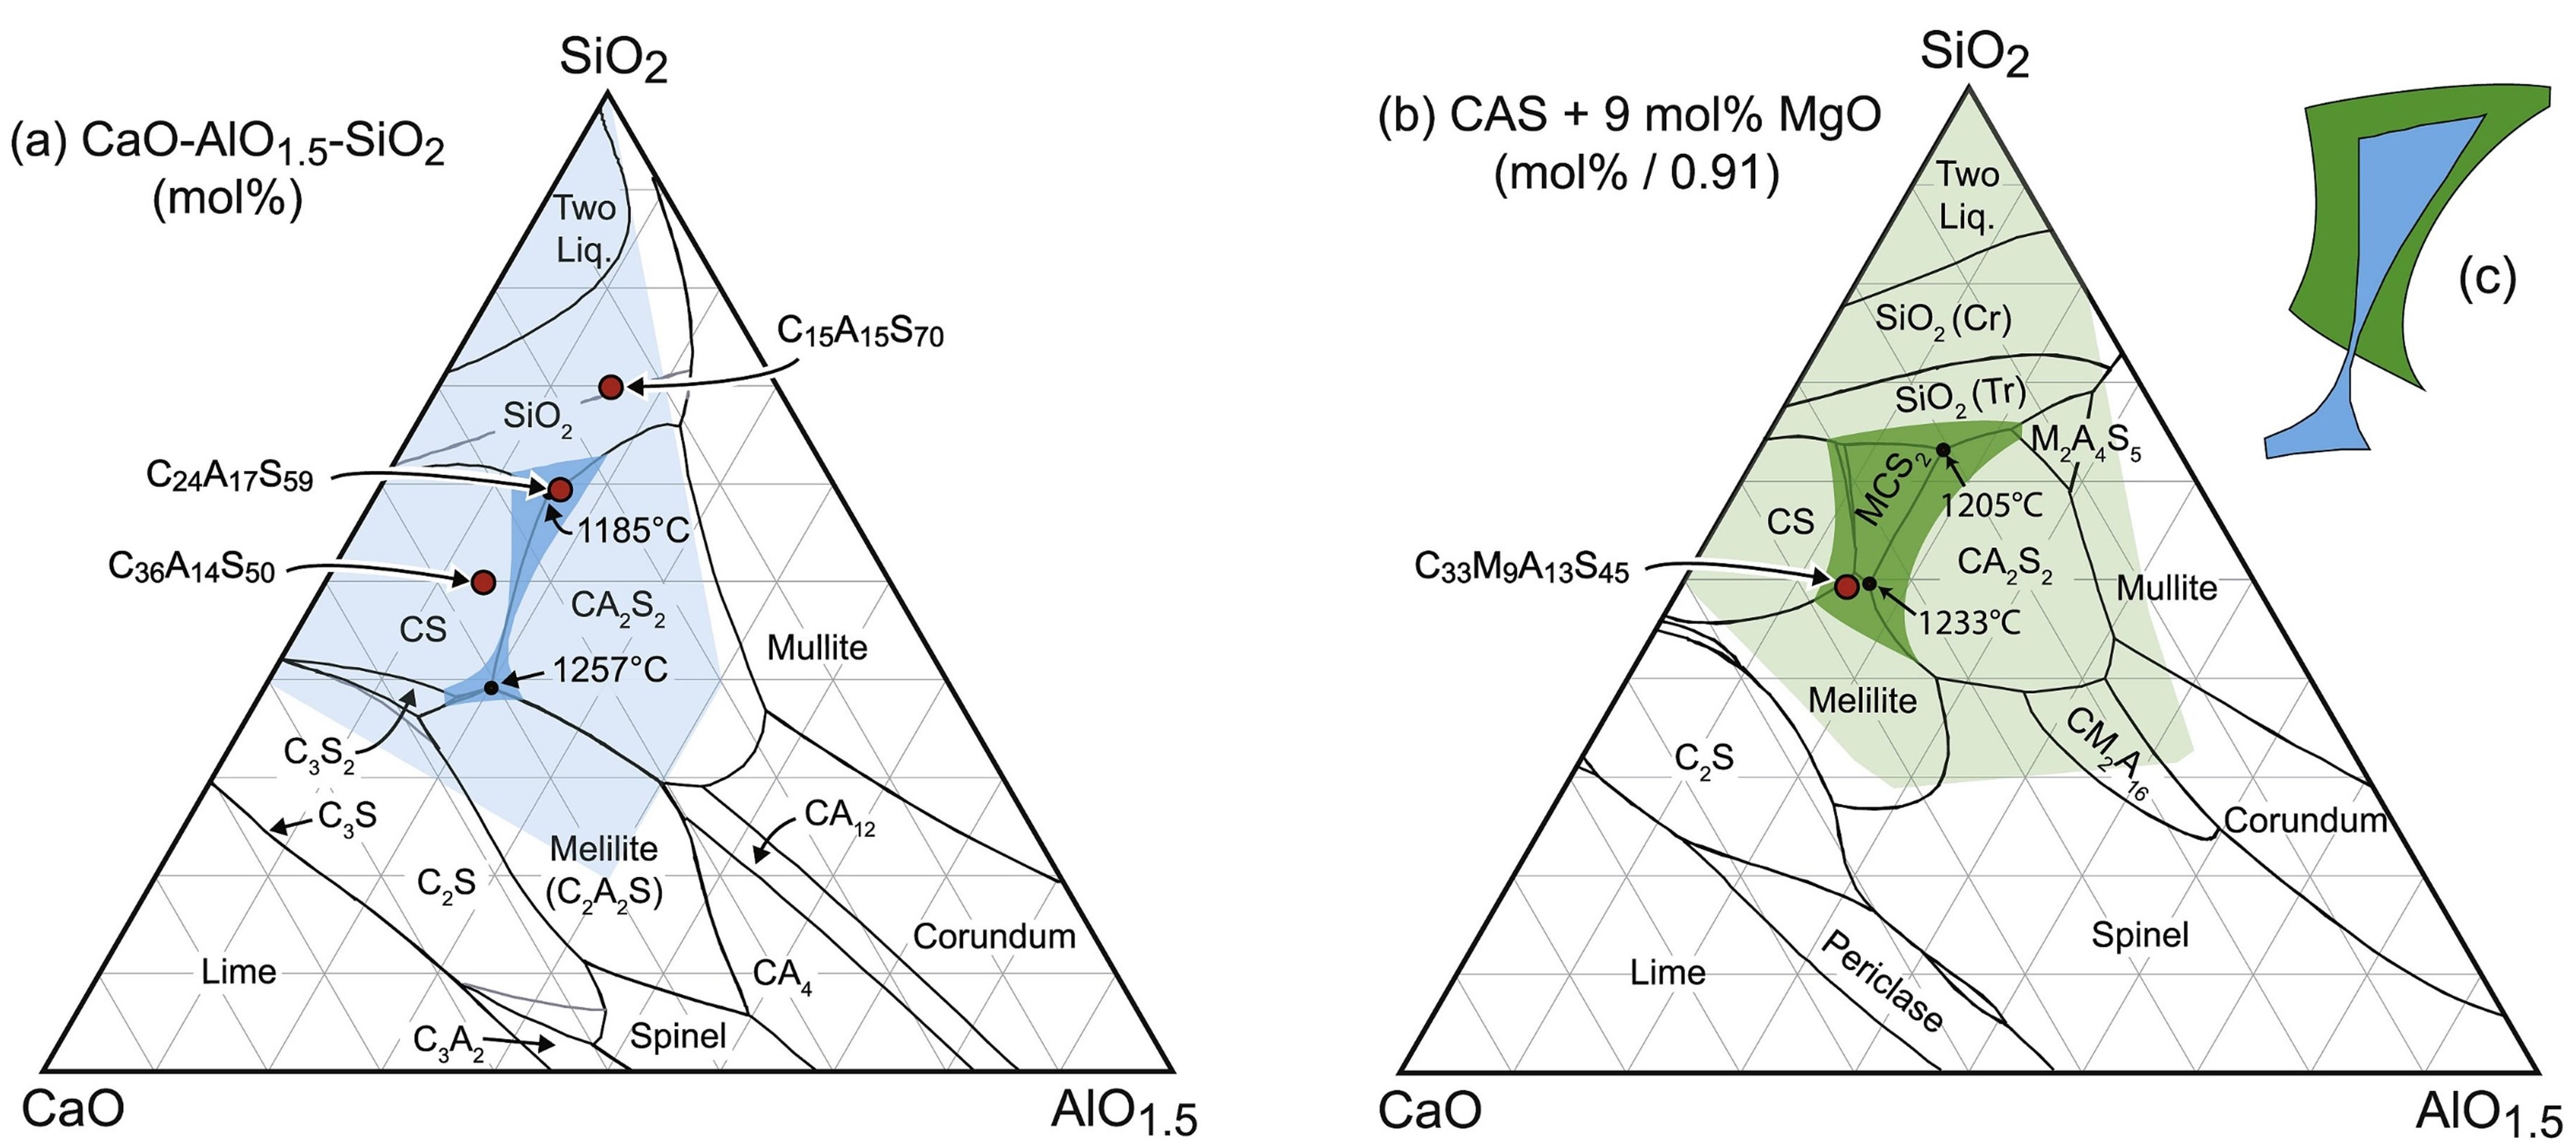
Fig. 9
(a) Phase diagram of the CaO-MgO-AlO
1.5
ternary system at 1300 ℃; (b) Phase diagram of the CaO-MgO-AlO
1.5
ternary system with the addition of 9 mol% MgO; (c) The effect of MgO addition on the shape and extent of the liquid field. Reproduced with permission from Ref. [
36
], © Elsevier 2016.
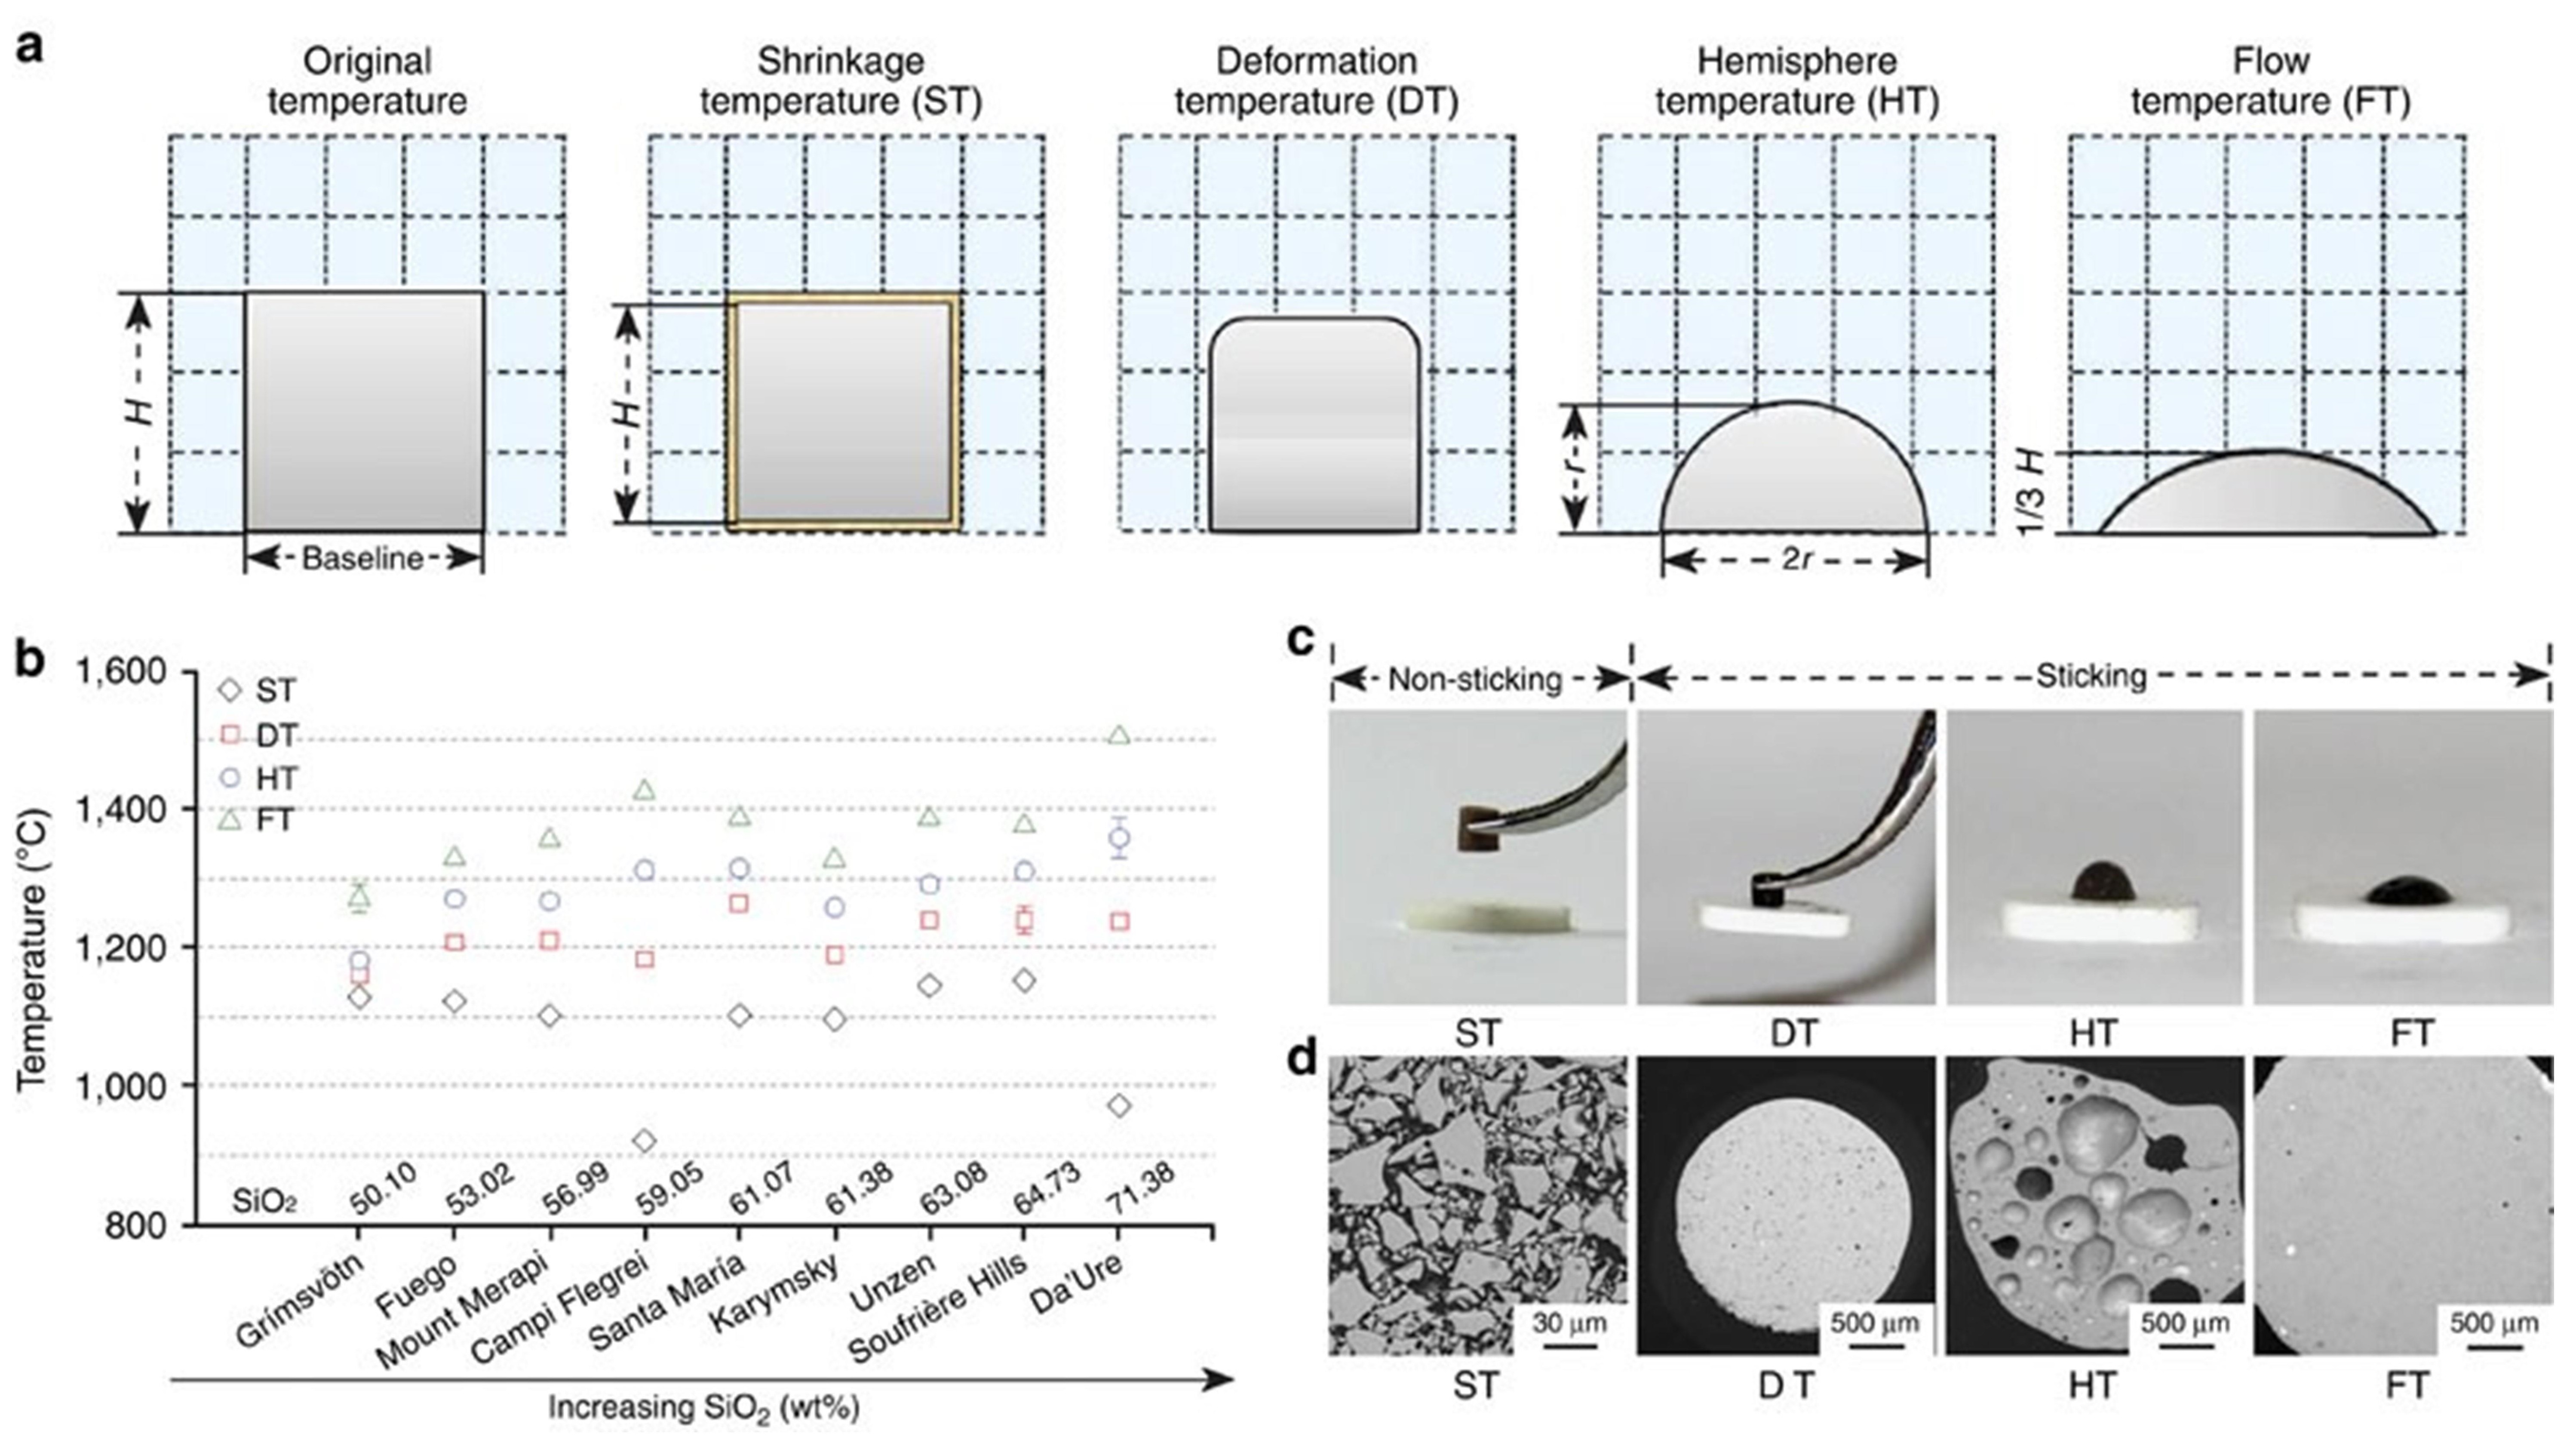
Fig. 10
(a) Schematic diagram of the volcanic ash melting process; (b) Transition temperatures of volcanic ash with different compositions at various stages; (c) Photographs of volcanic ash at different melting stages; (d) Backscattered electron images of volcanic ash at various melting stages. Reproduced with permission from Ref. [
37
], ©The Author(s) 2016.
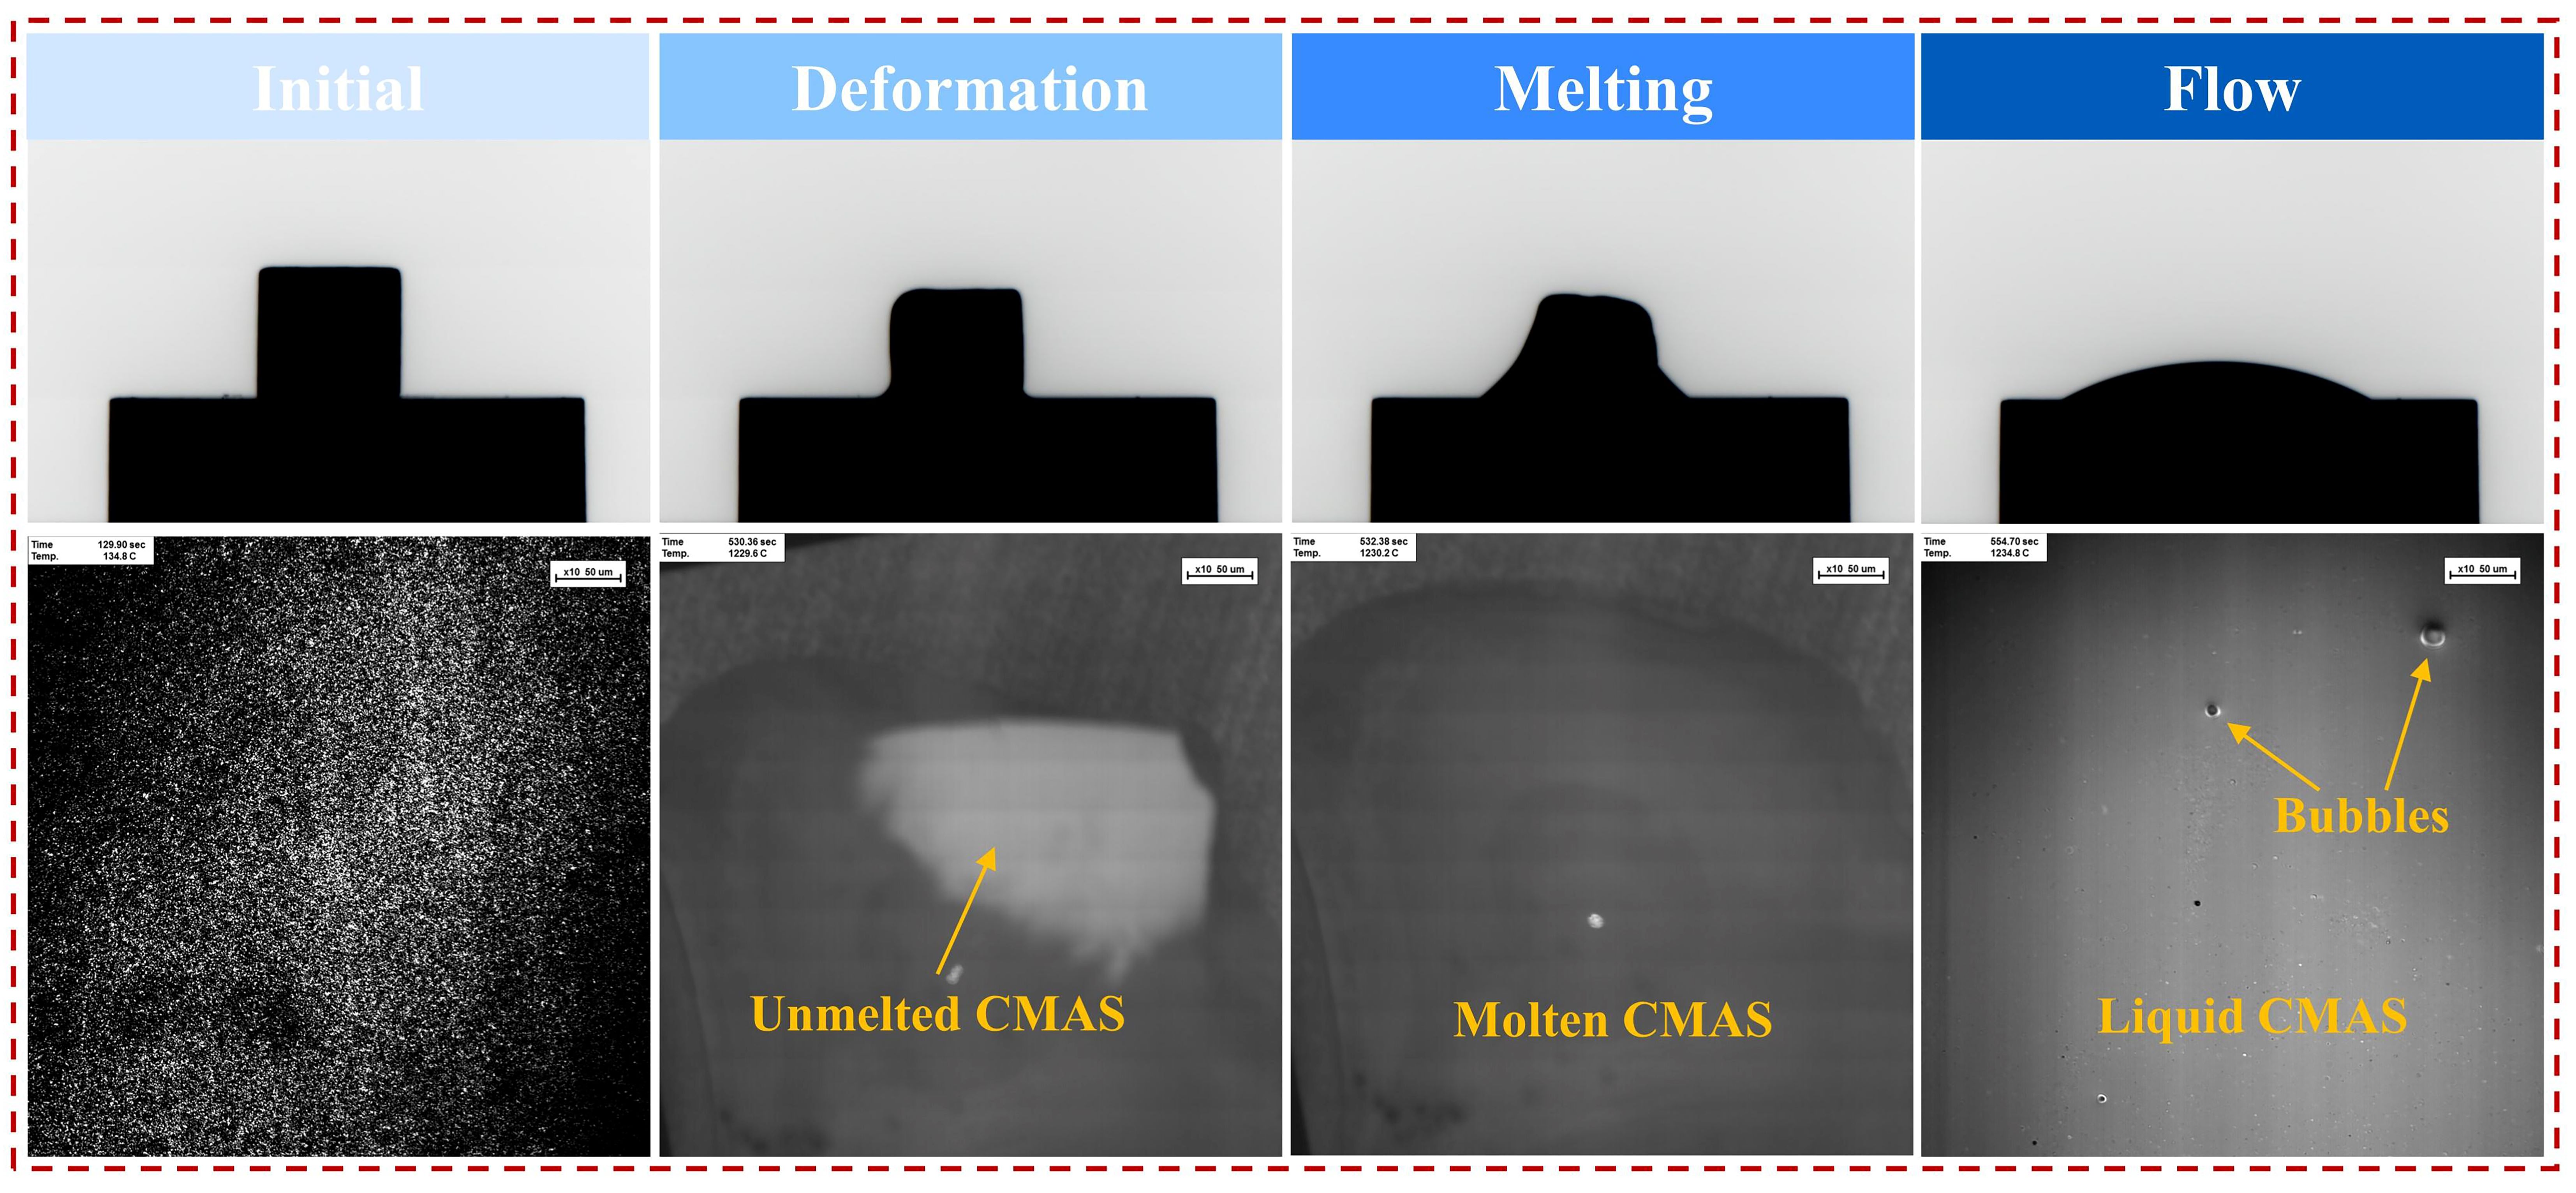
Fig. 11
In-situ observation of the melting process of CMAS.
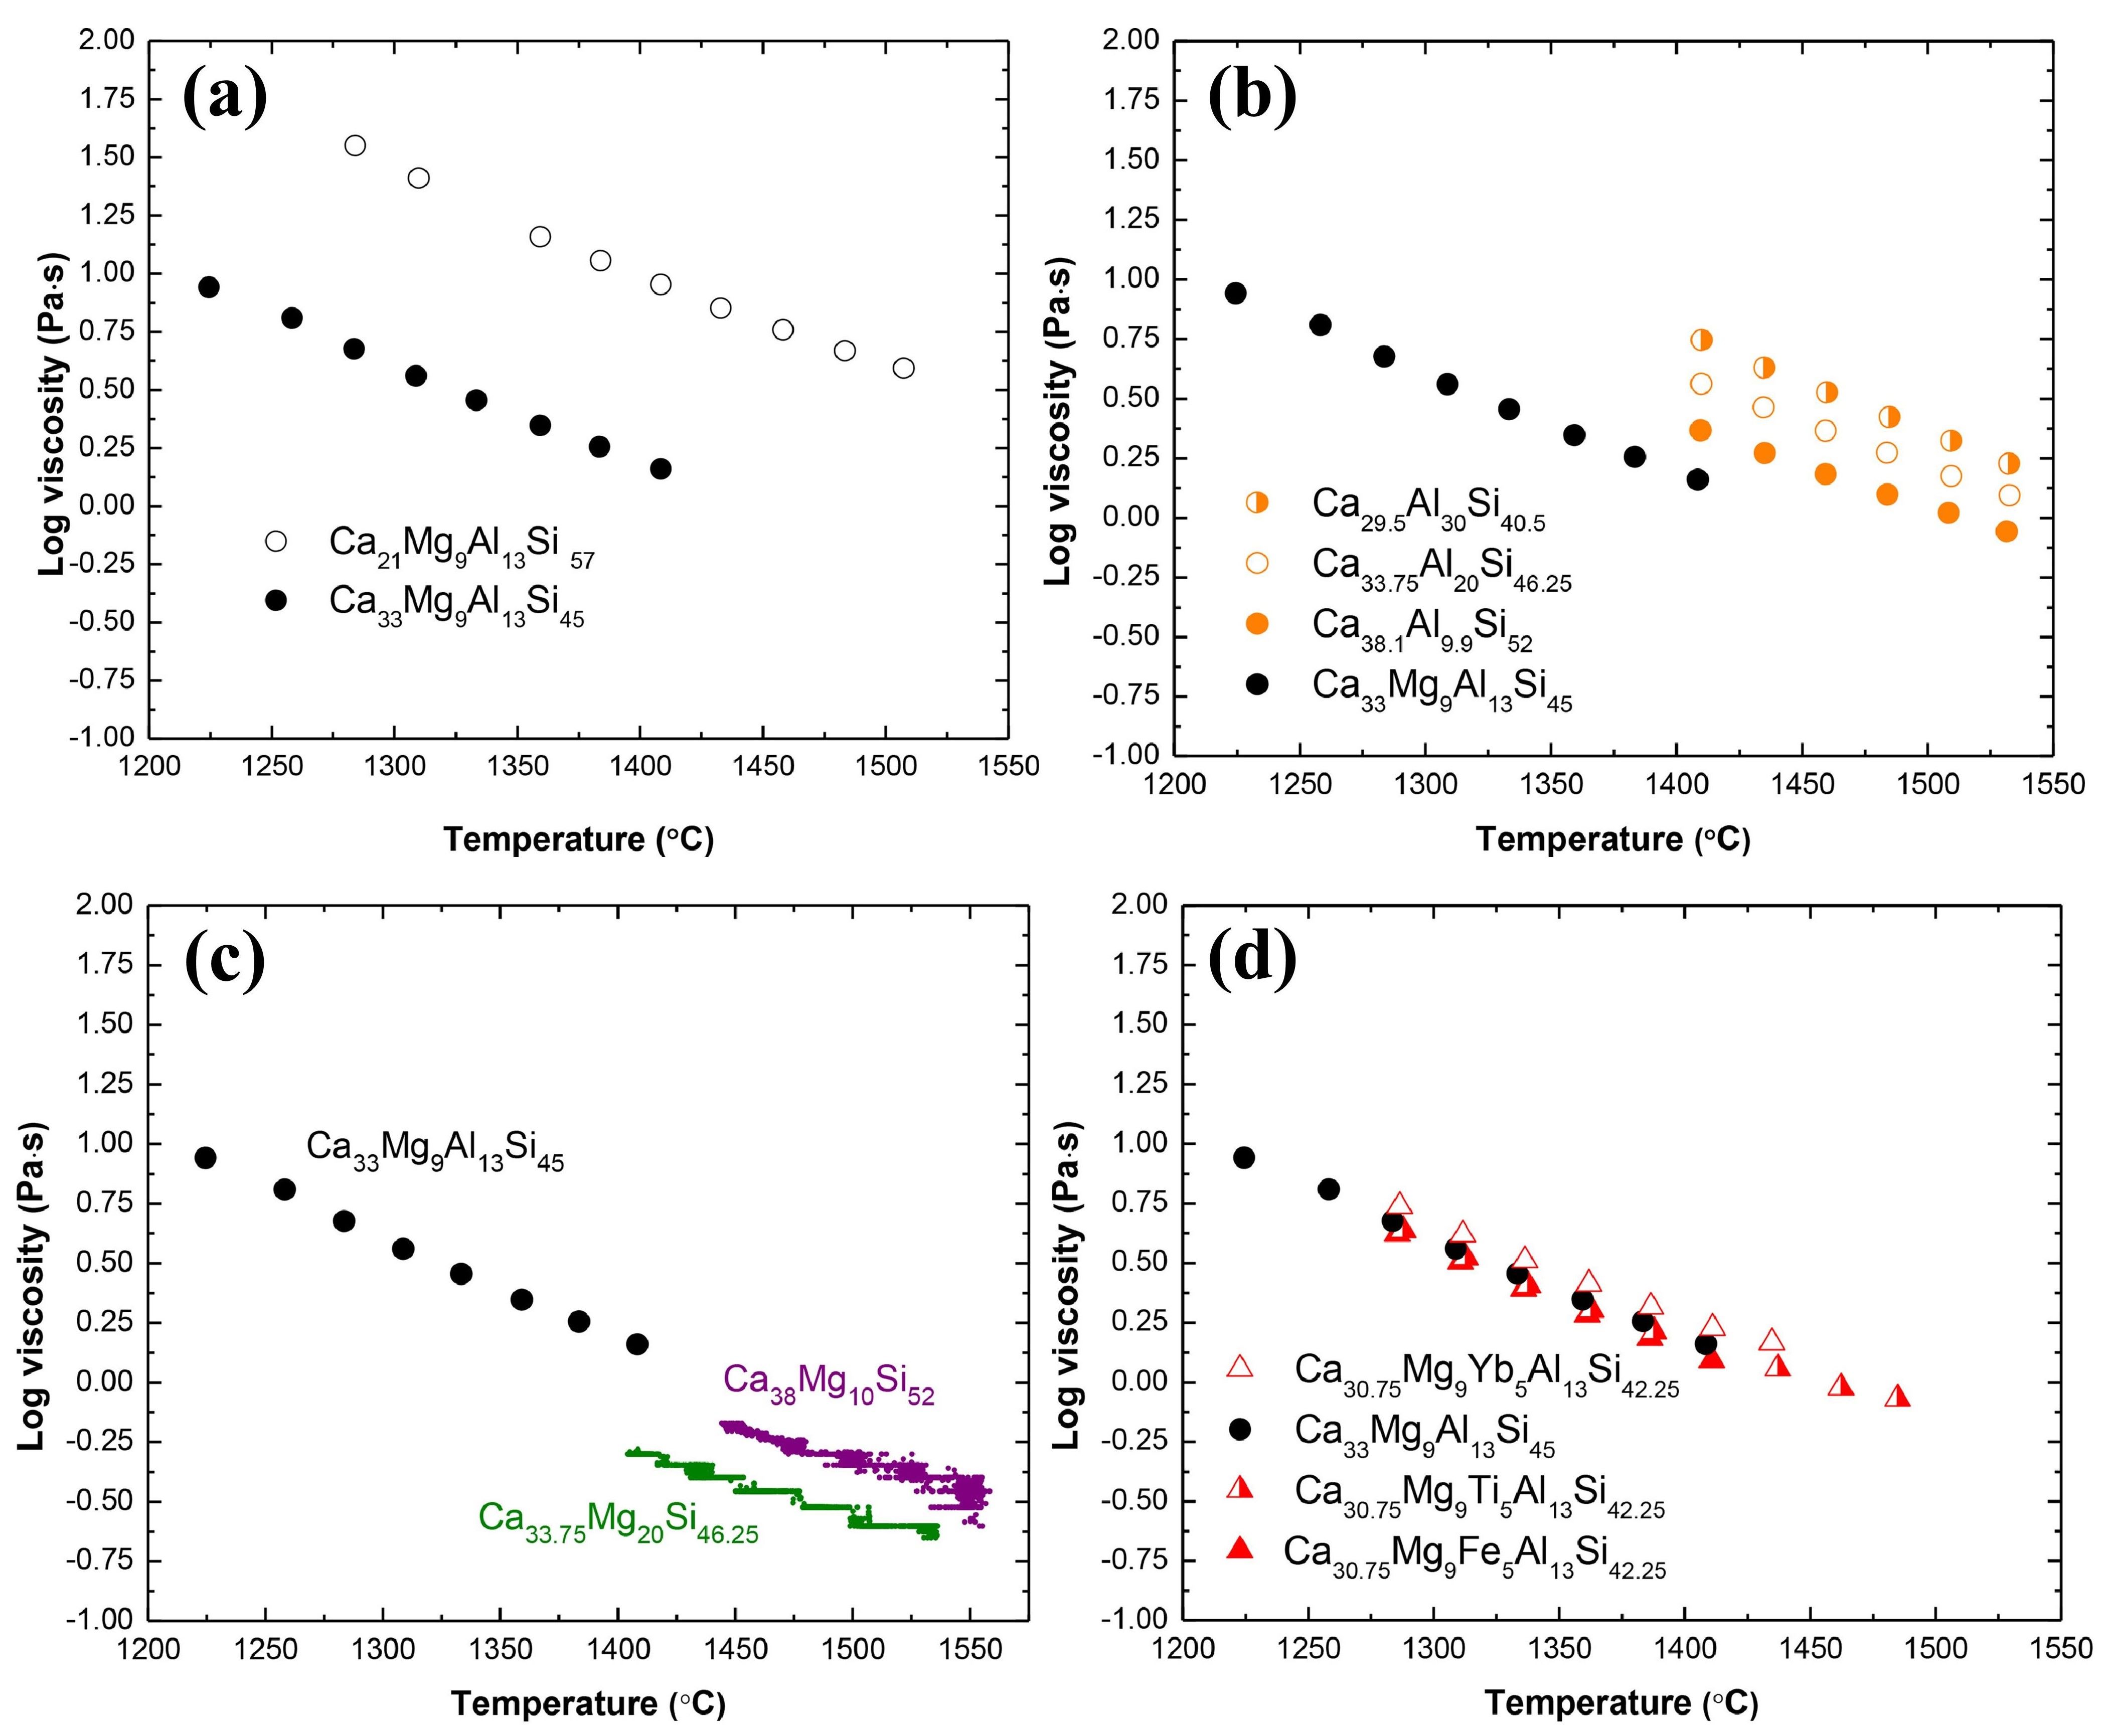
Fig. 12
The relationship between viscosity and temperature for CMAS with different compositions. (a) Different CaO/SiO
2
ratios; (b) Different AlO
1.5
contents; (c) Different MgO contents; (d) Addition of other oxides. Reproduced with permission from Ref. [
38
], © Elsevier 2022.
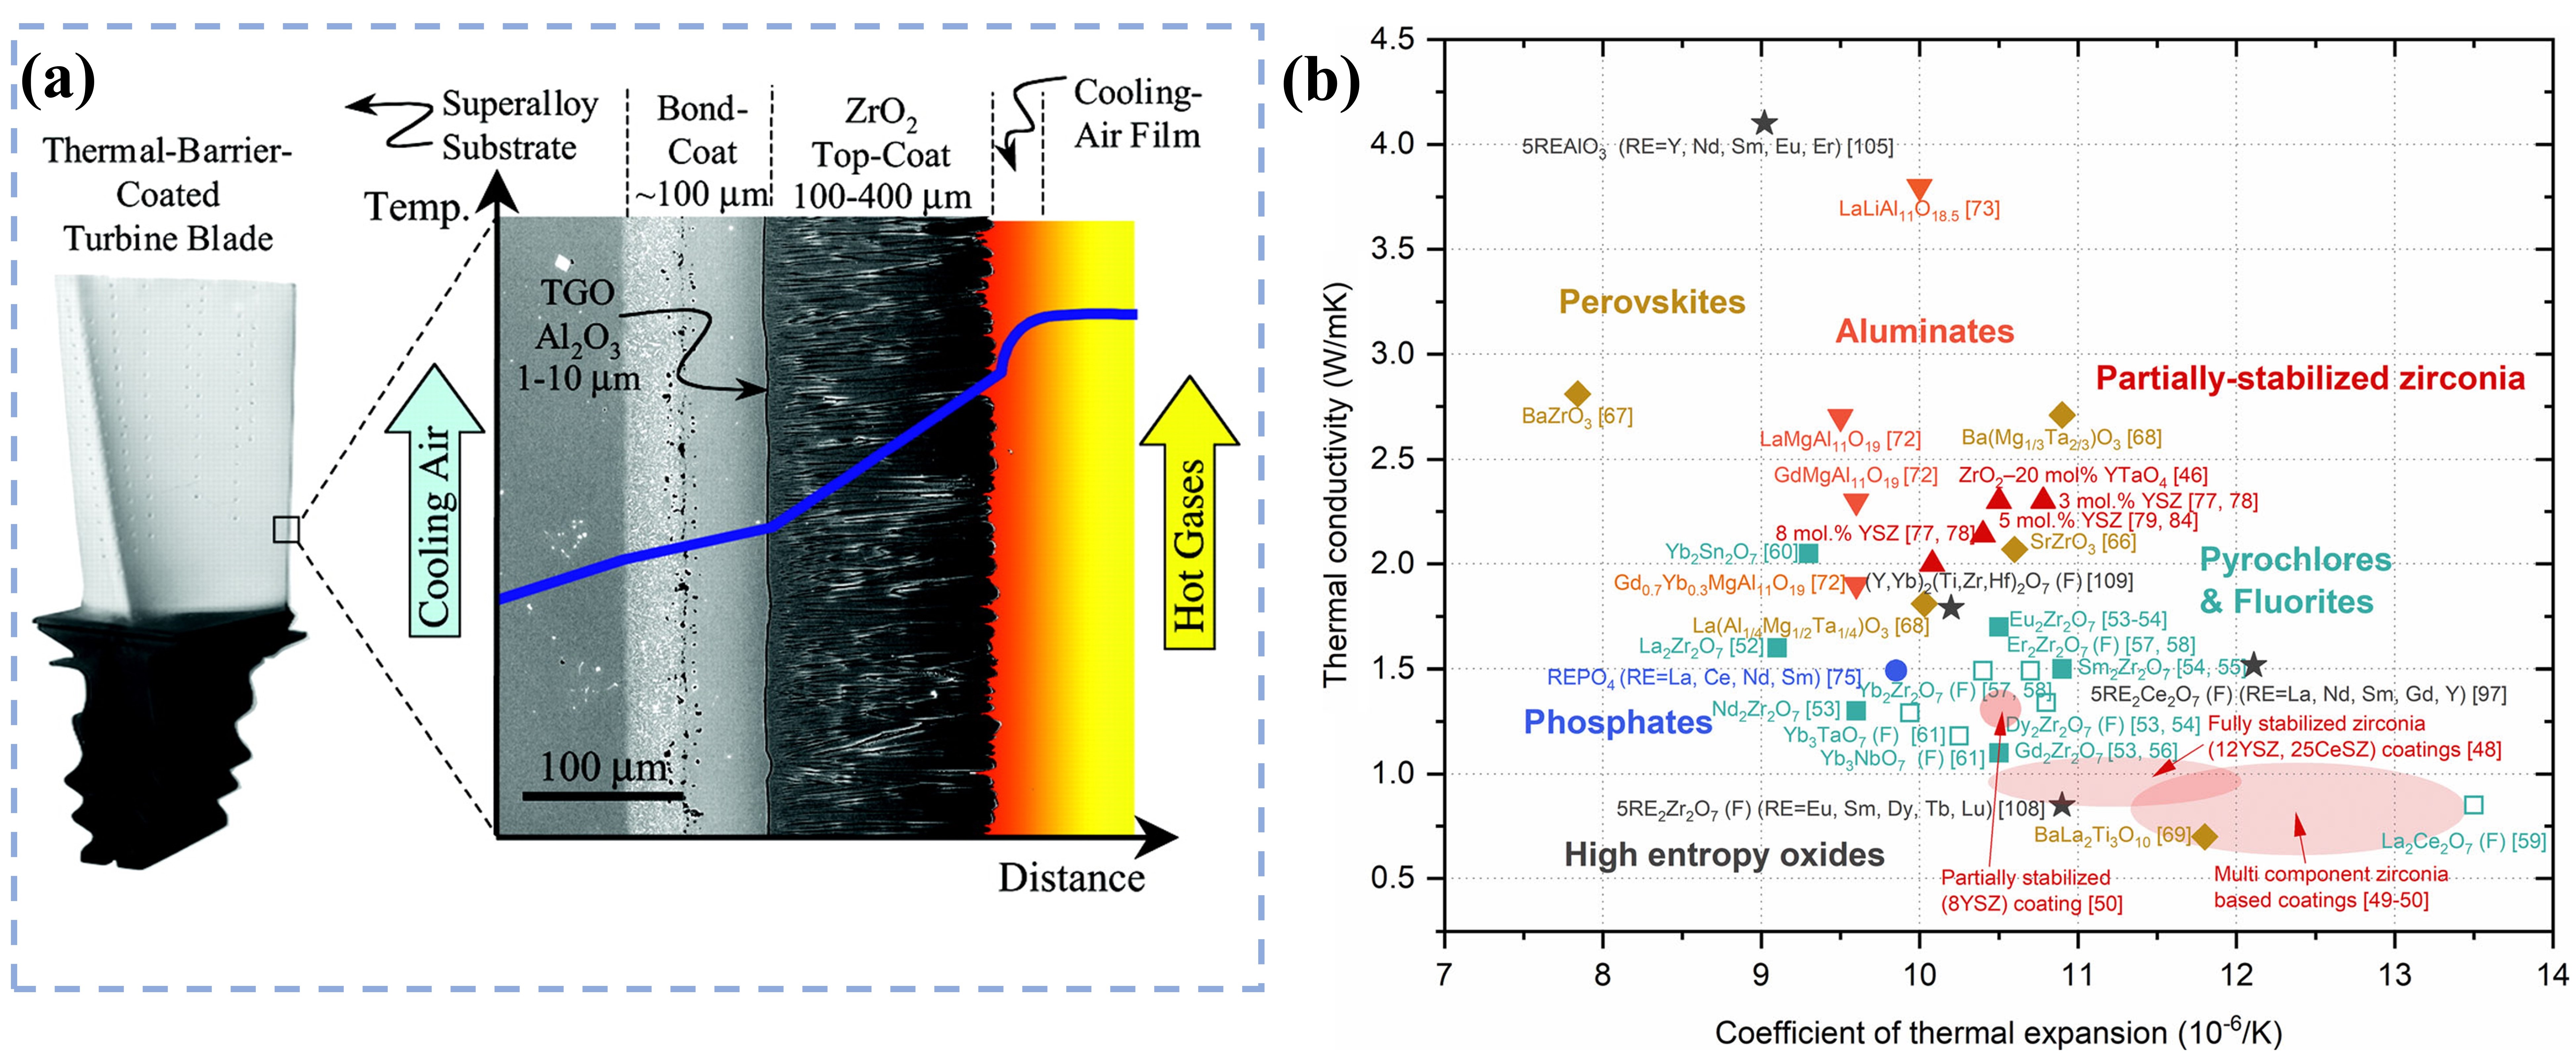
Fig. 13.
(a) Schematic diagram of the structure of TBC and (b) the thermal conductivity and thermal expansion coefficient of different TBC materials. Reproduced with permission from Ref. [
10
] for (a), © AAAS 2002; Ref. [
47
] for (b), © Author(s) 2022.
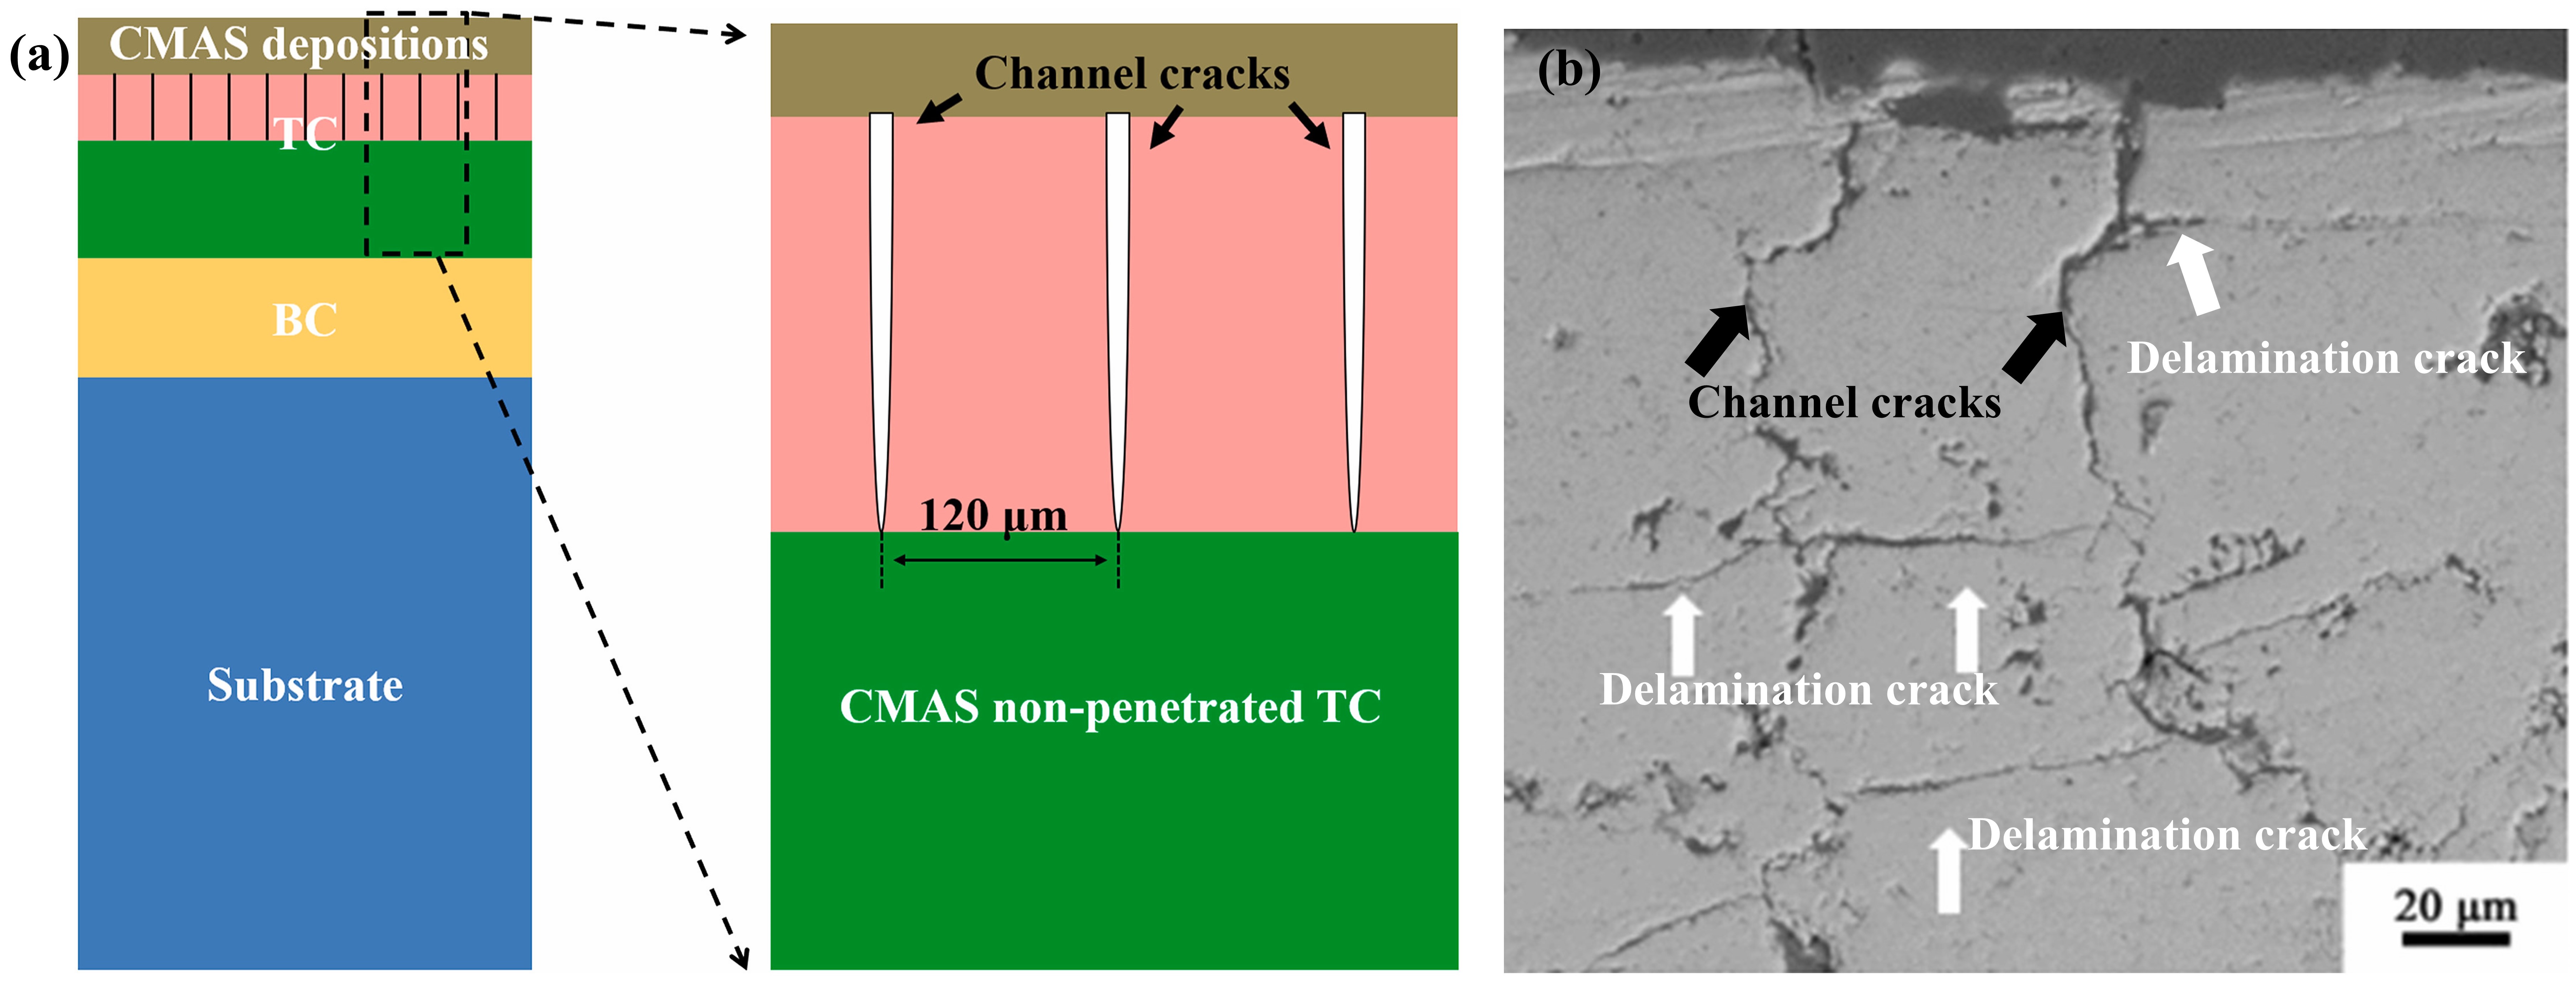
Fig. 14.
(a) Schematic diagram of CMAS-penetrated TBC model with channel cracks and (b) channel and delamination cracks of YSZ on cross-section. Reproduced with permission from Ref. [
56
], © Elsvier 2023.
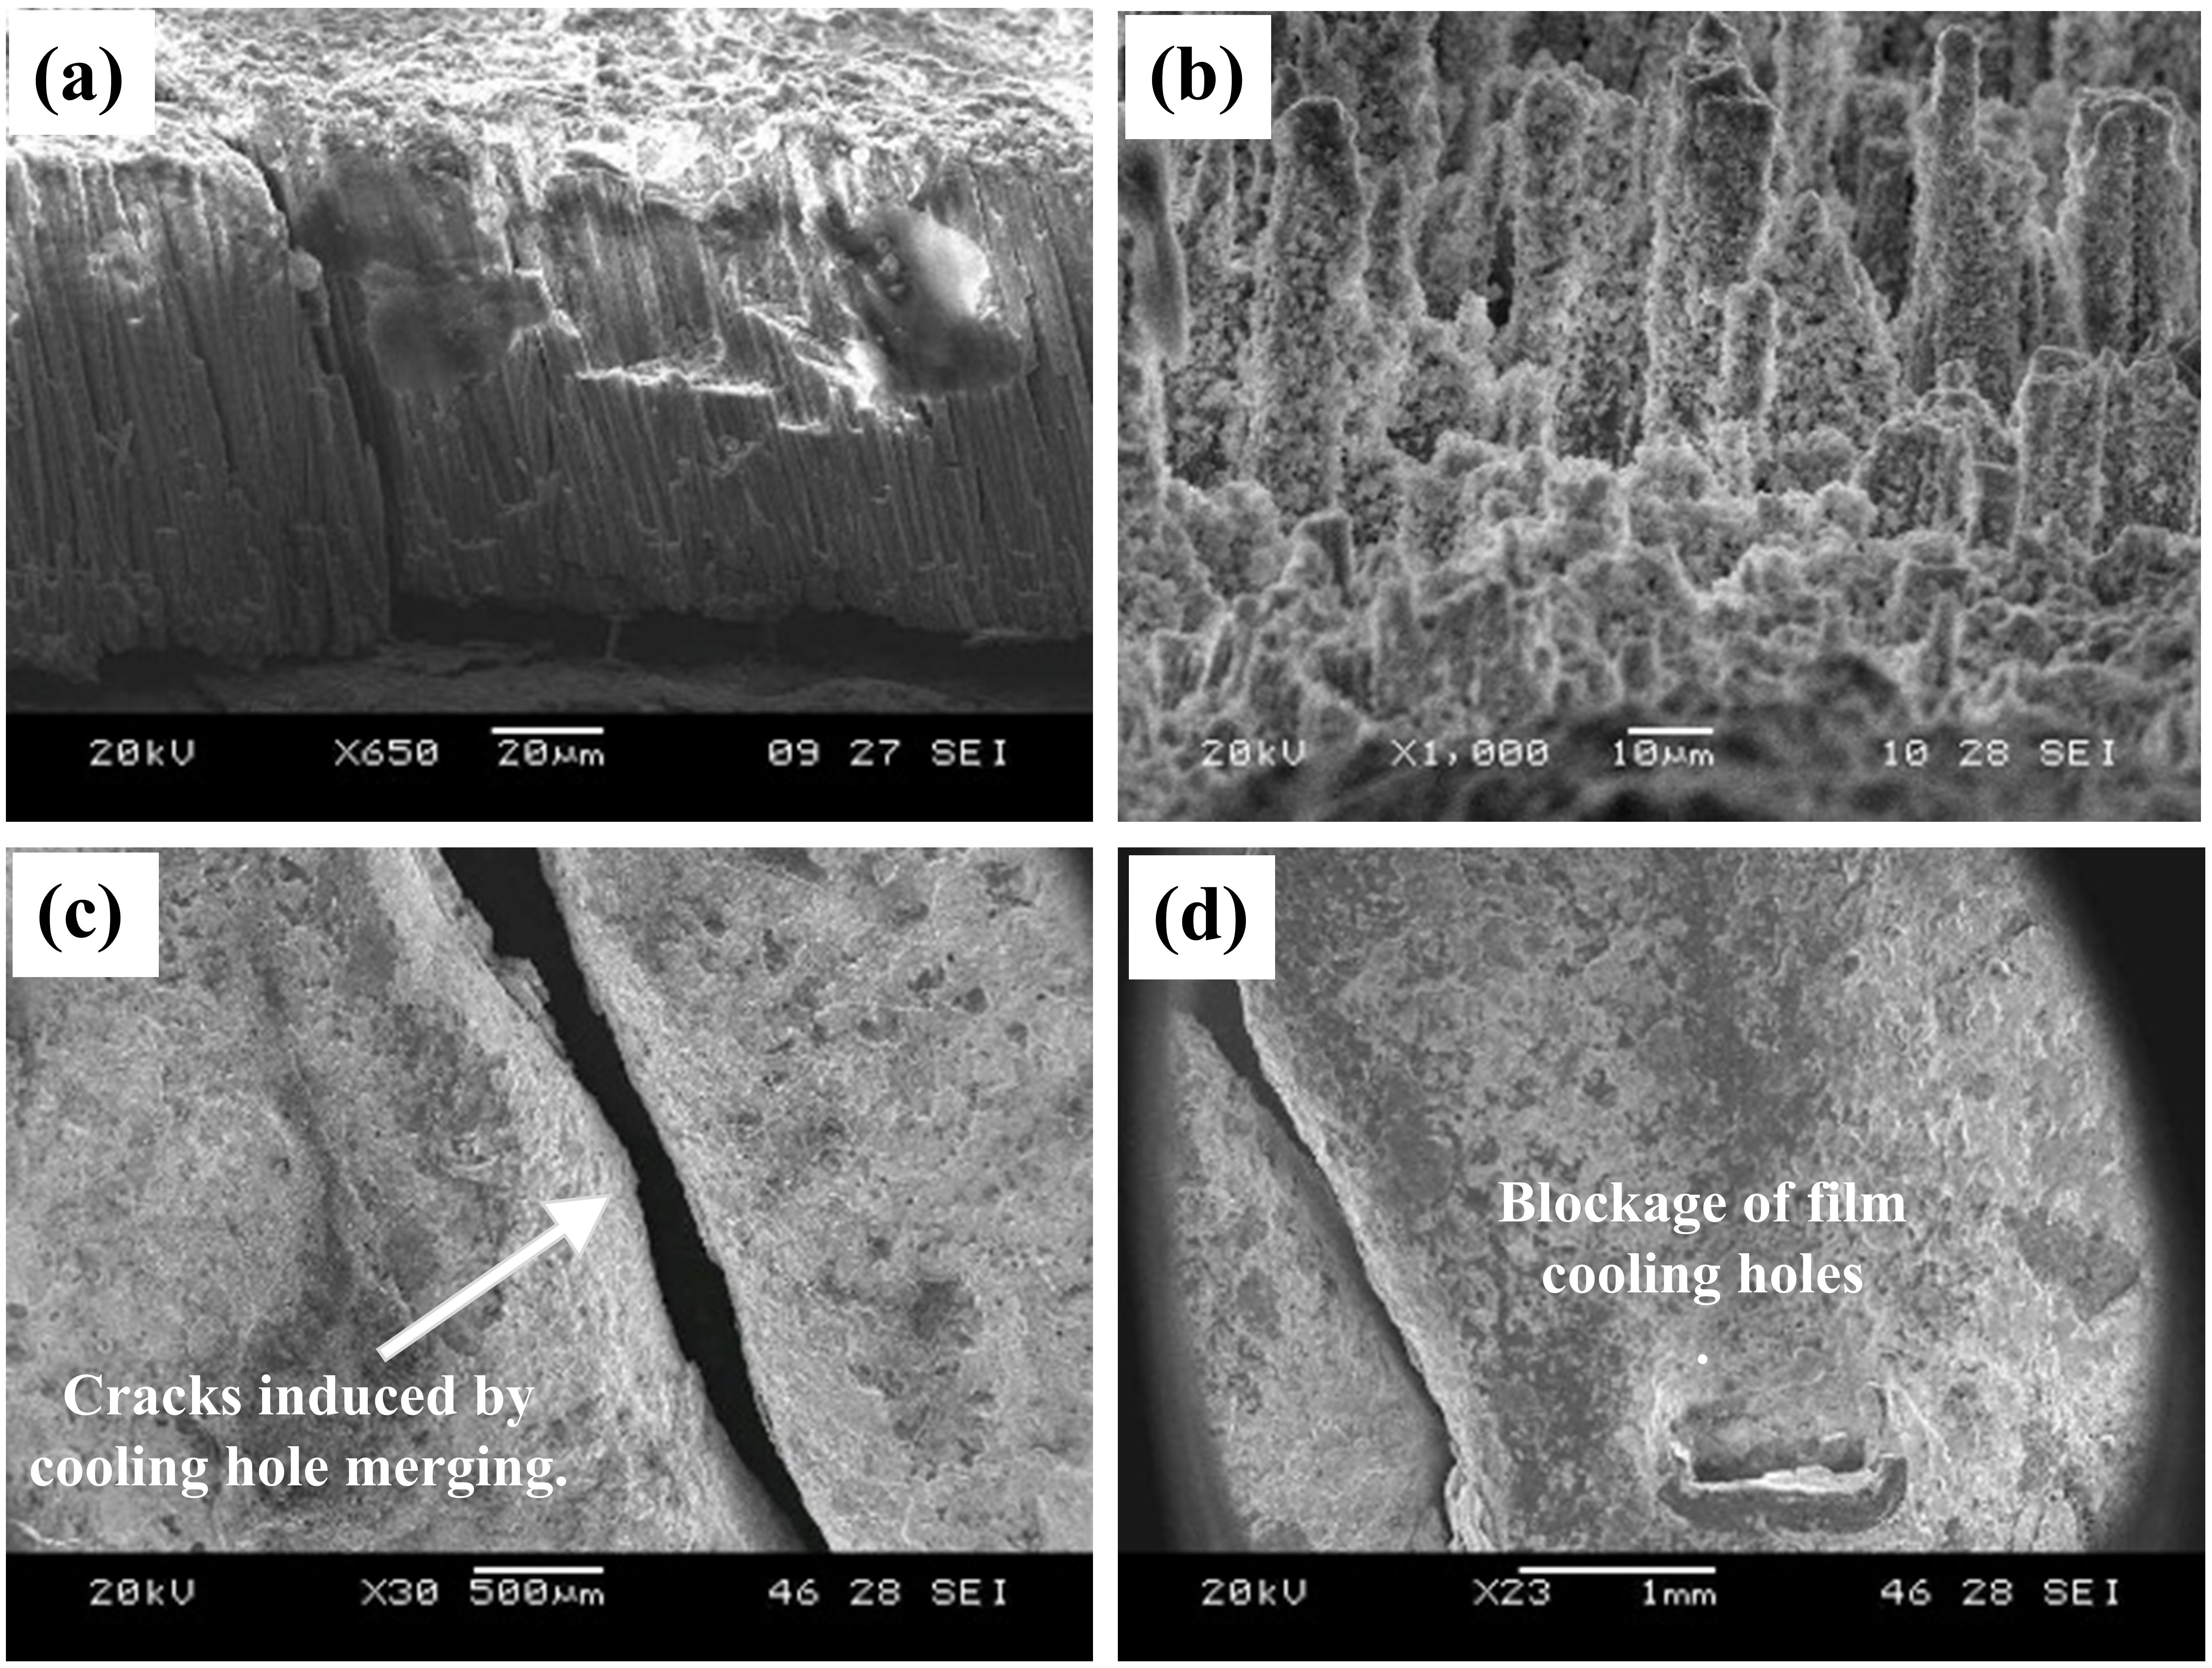
Fig. 15.
(a) The columnar morphology and cracks of TBC in the nozzle guiding vane, (b) infiltration of CMAS in TBC, (c) crack formed due to merging of cooling holes and (d) choking of cooling hole. Reproduced with permission from Ref. [
59
], © Autuor(s) 2018.
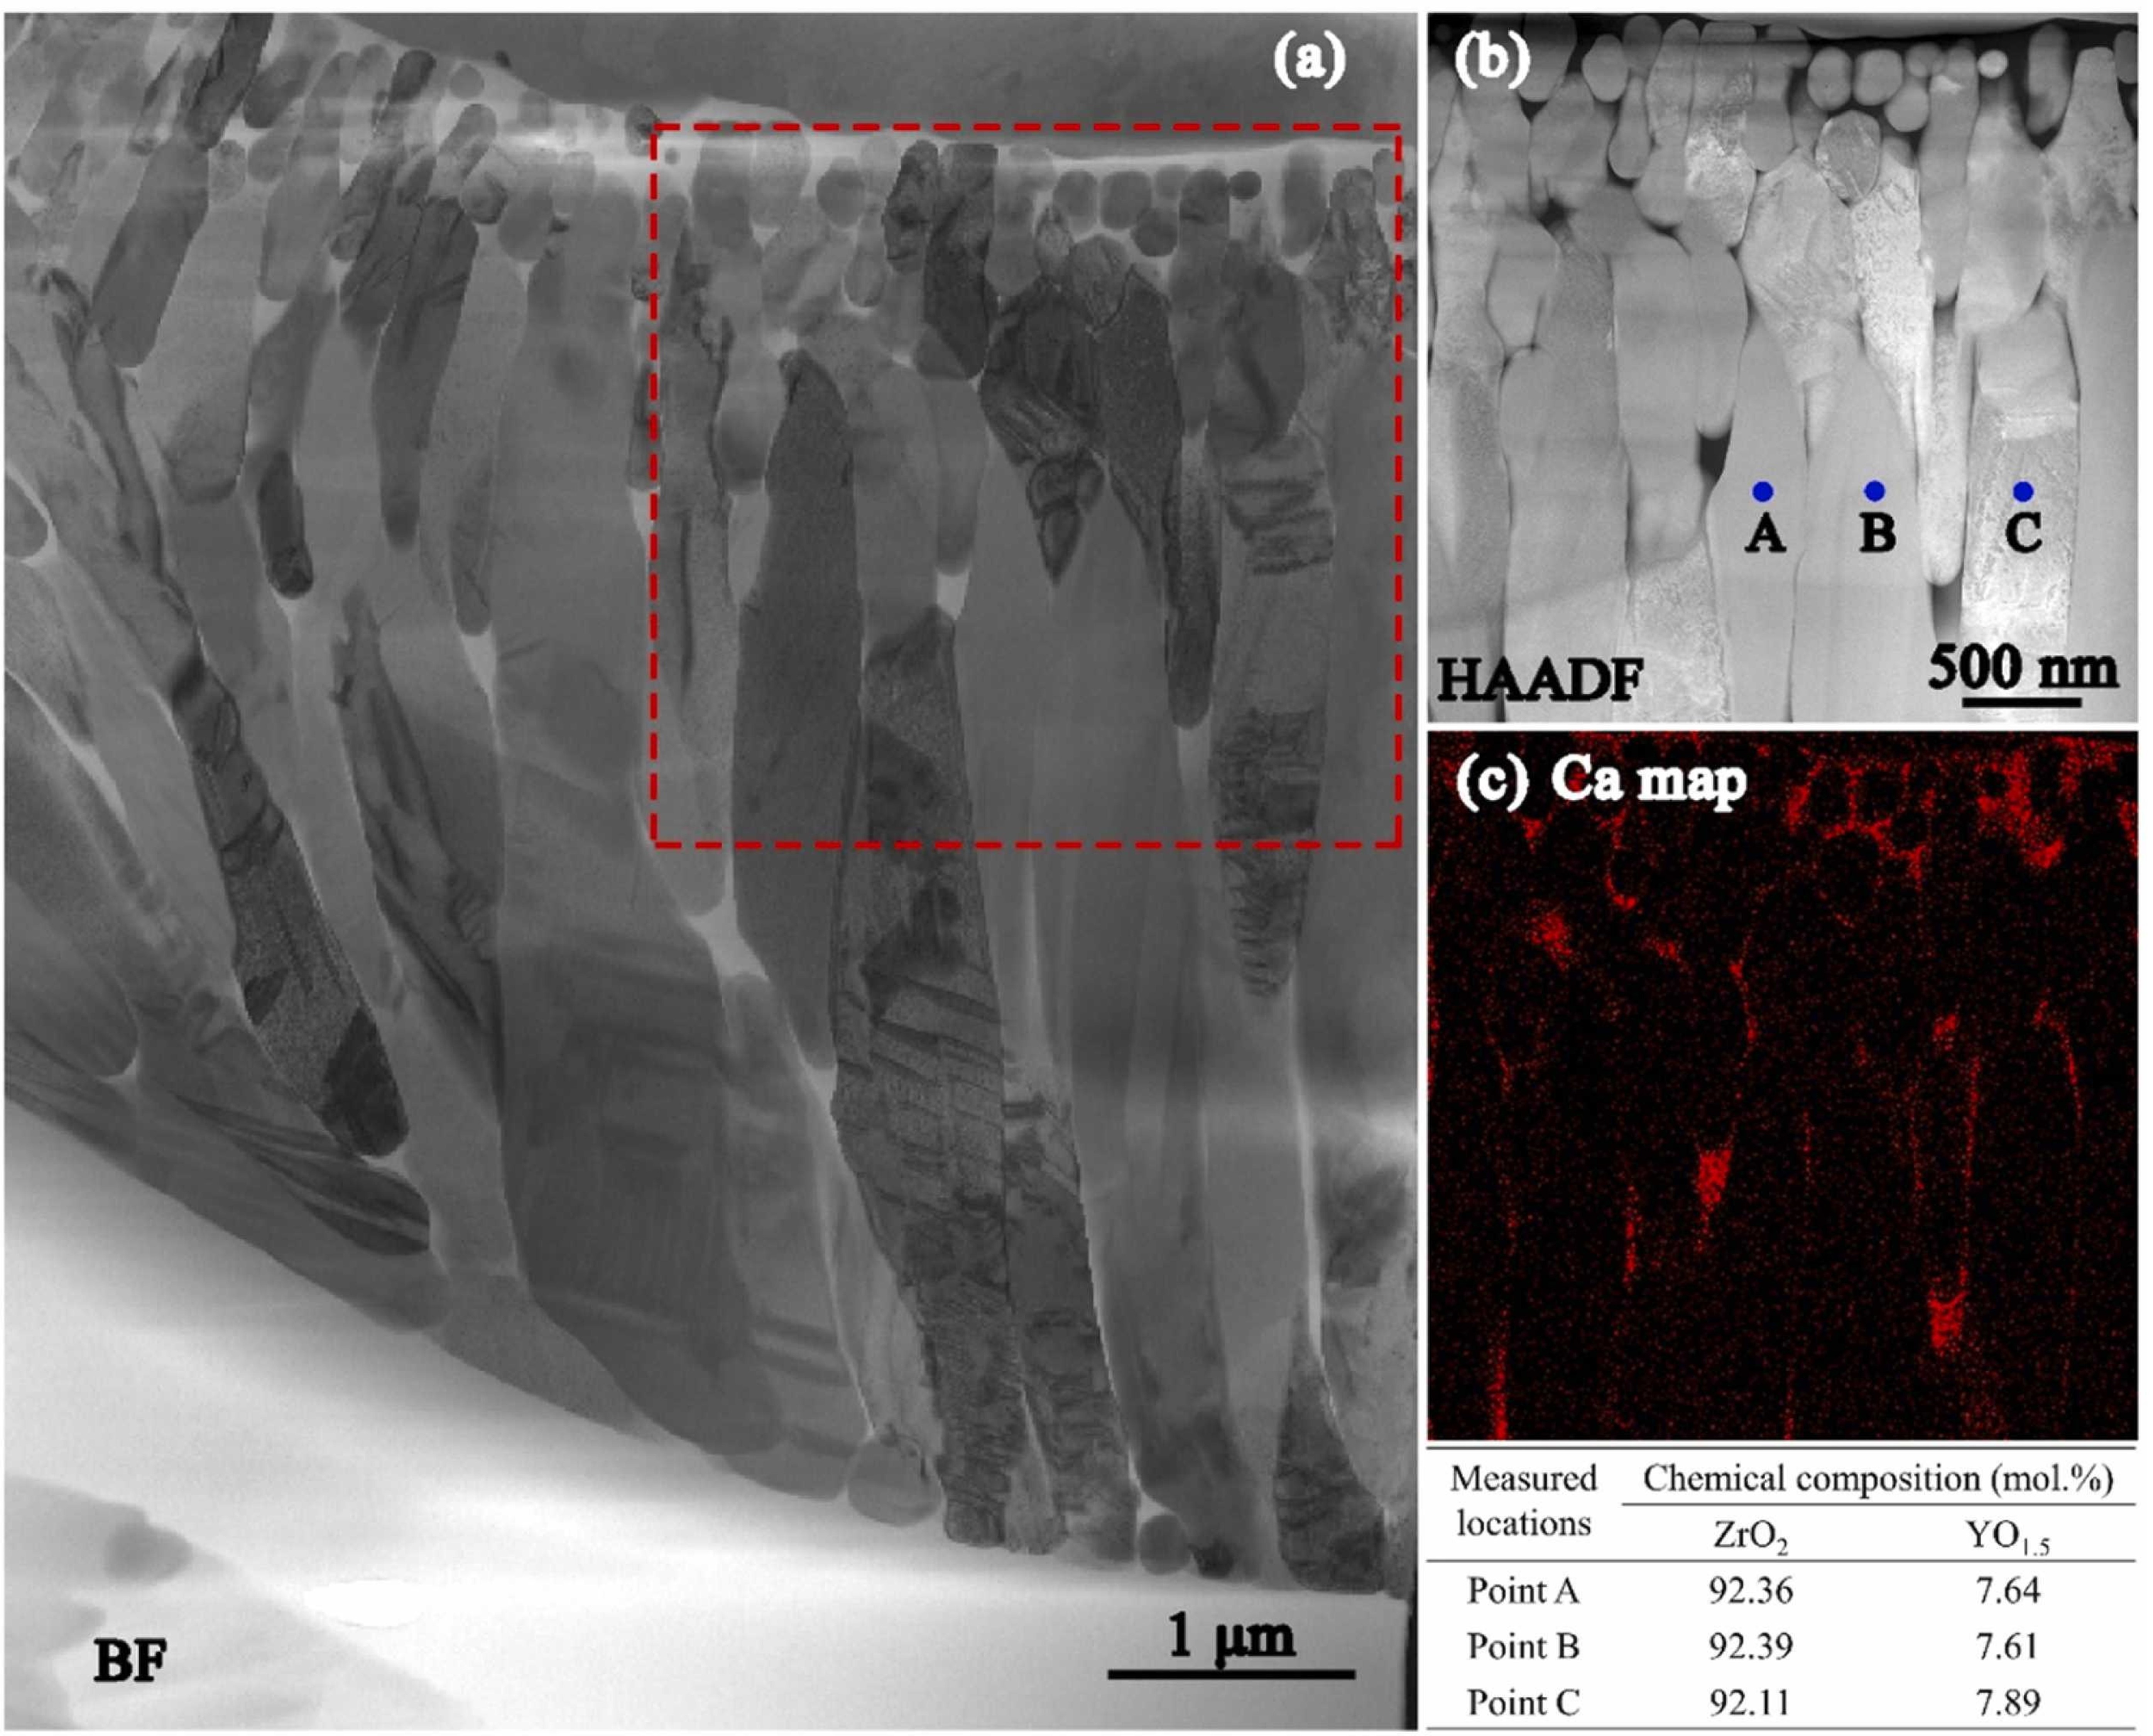
Fig 16.
(a) Bright-field TEM image of CMAS infiltration front at 1250 ℃ for 2 h in 8YSZ TBC, (b-c) HAADF image, and the corresponding Ca mapping of the dashed rectangle area in (a). The table at the bottom right lists the chemical compositions of points A, B, and C in (b). Reproduced with permission from Ref. [
60
], © Elsvier 2022.
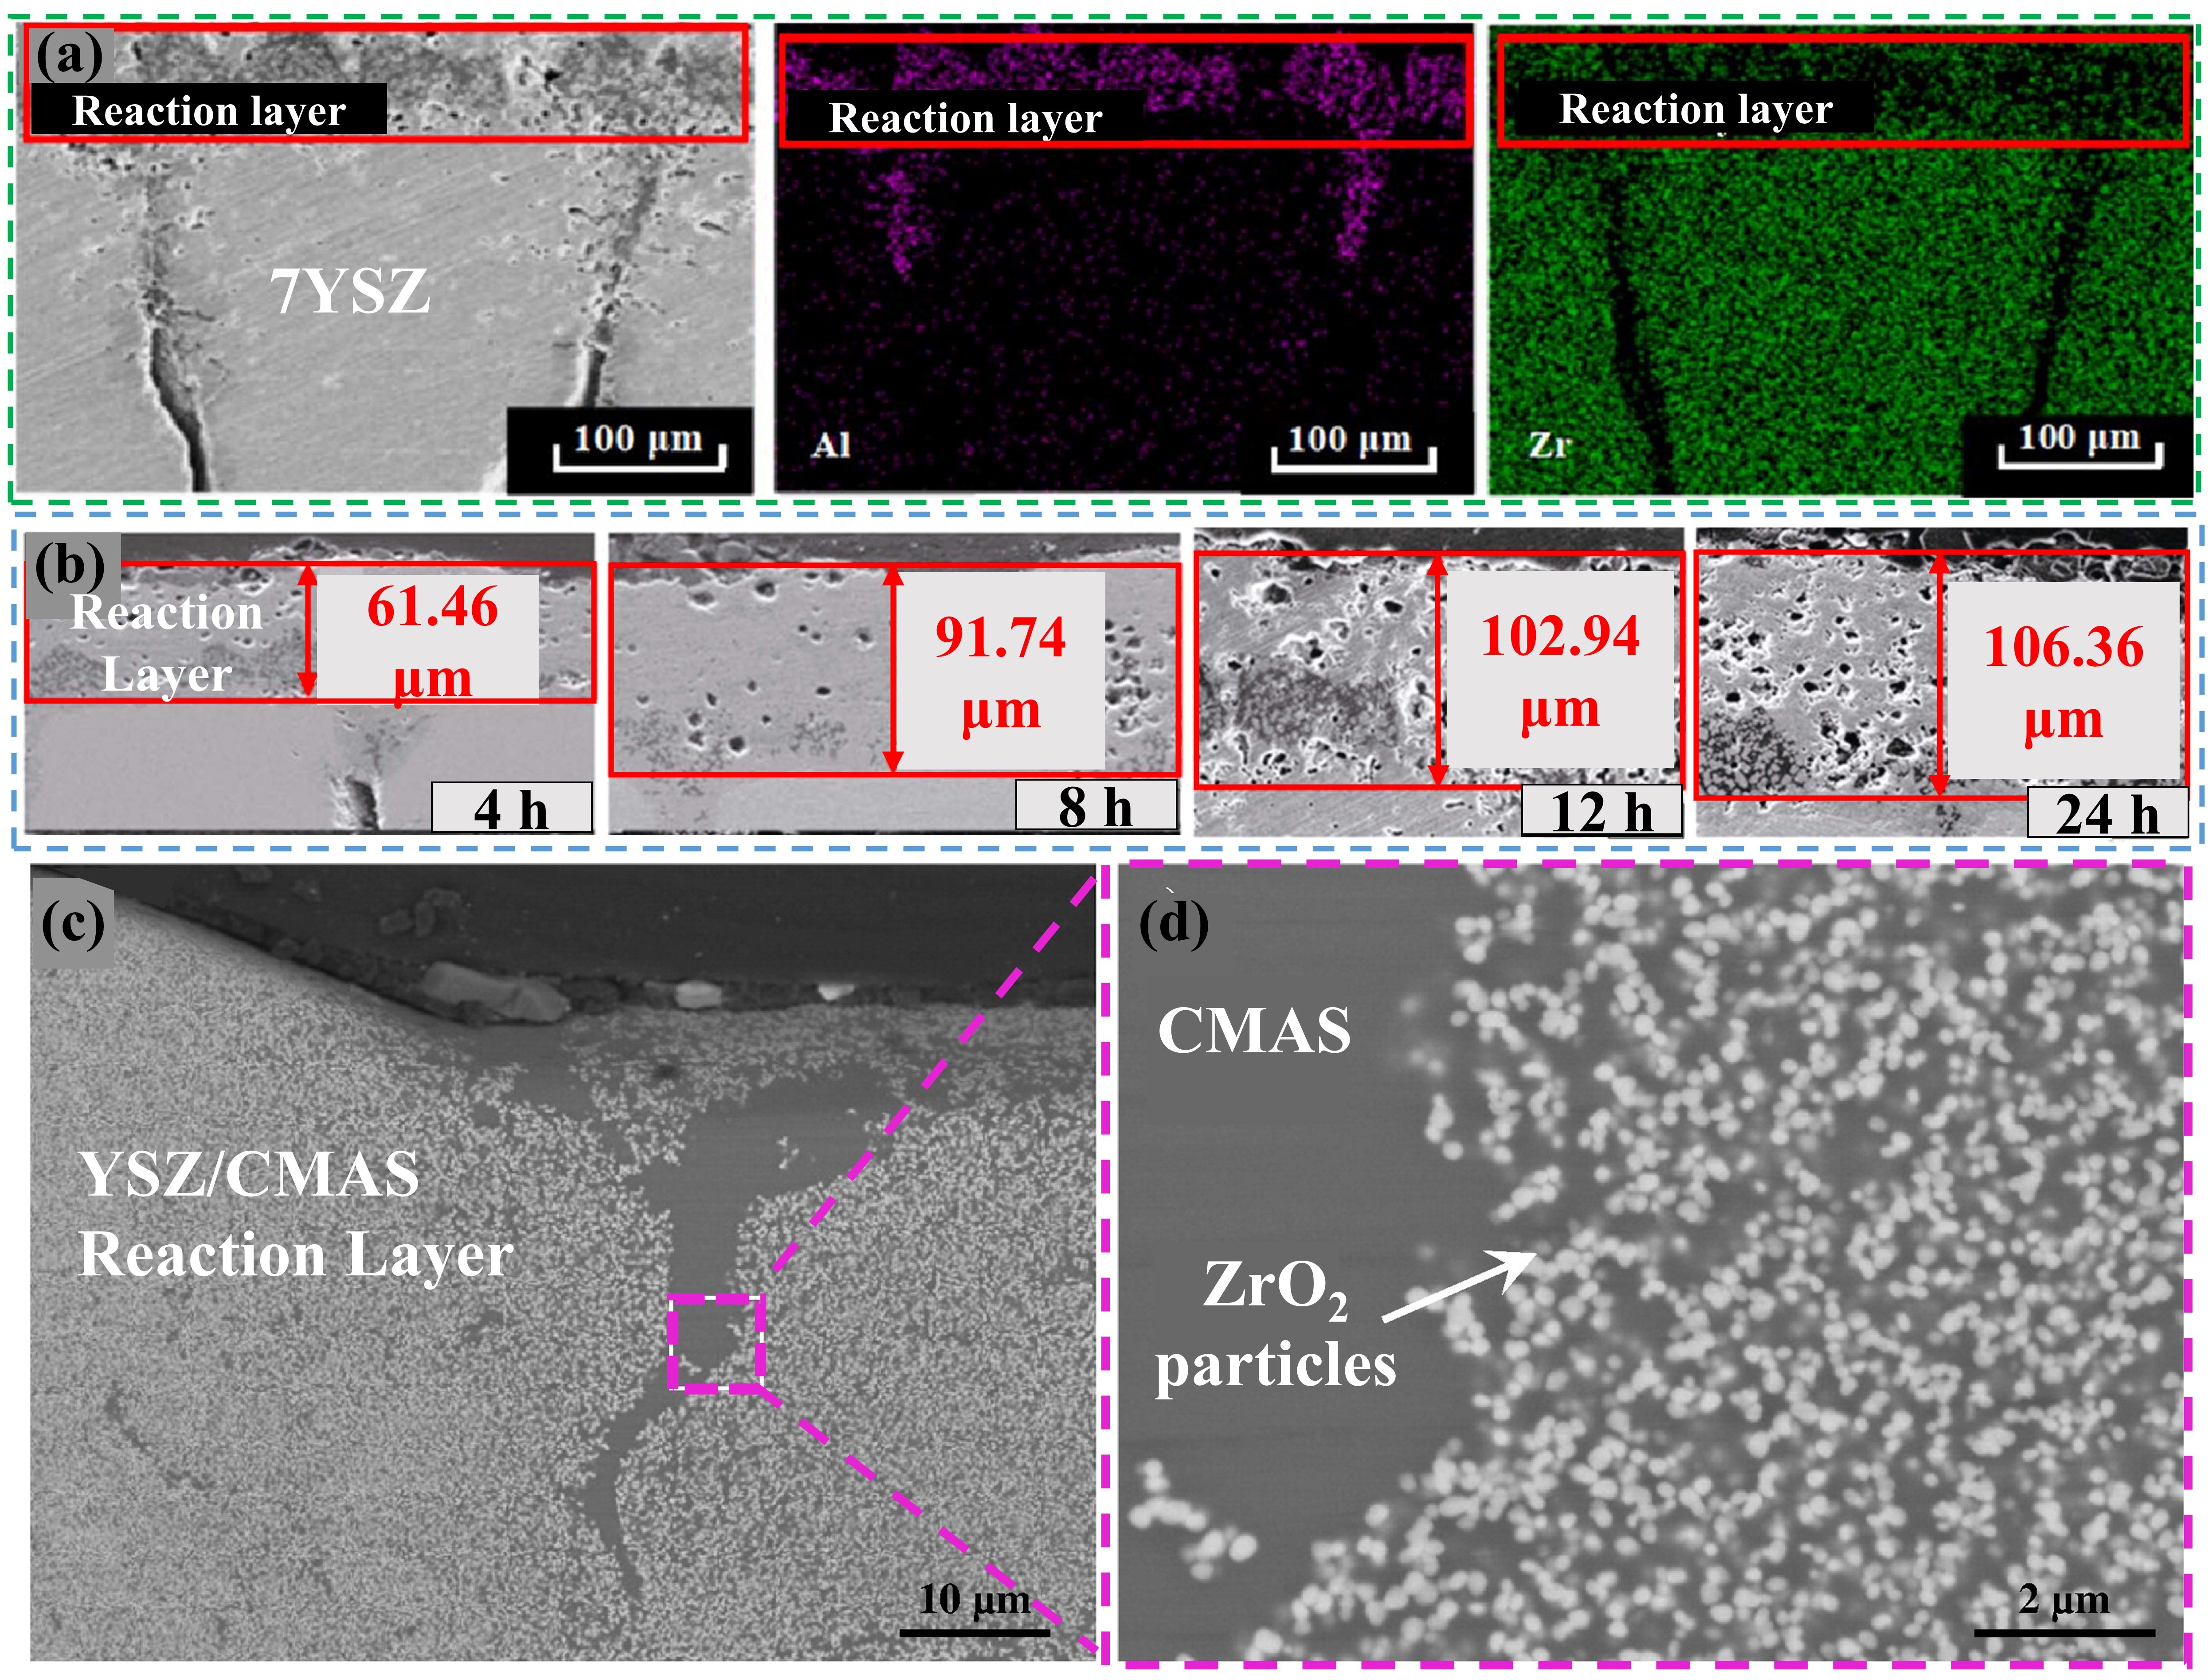
Fig. 17.
(a) SEM and EDS images of the interaction layer on cross-section, (b) the thickness of the reaction layer at different holding times, and (c-d) cross-section of the CMAS/YSZ interaction zone in the dissolution/reprecipitation process. Reproduced with permission from Ref. [
61
] for (a, b), © Author(s) 2021. Ref. [
64
] for (c, d), © Elsvier 2013.
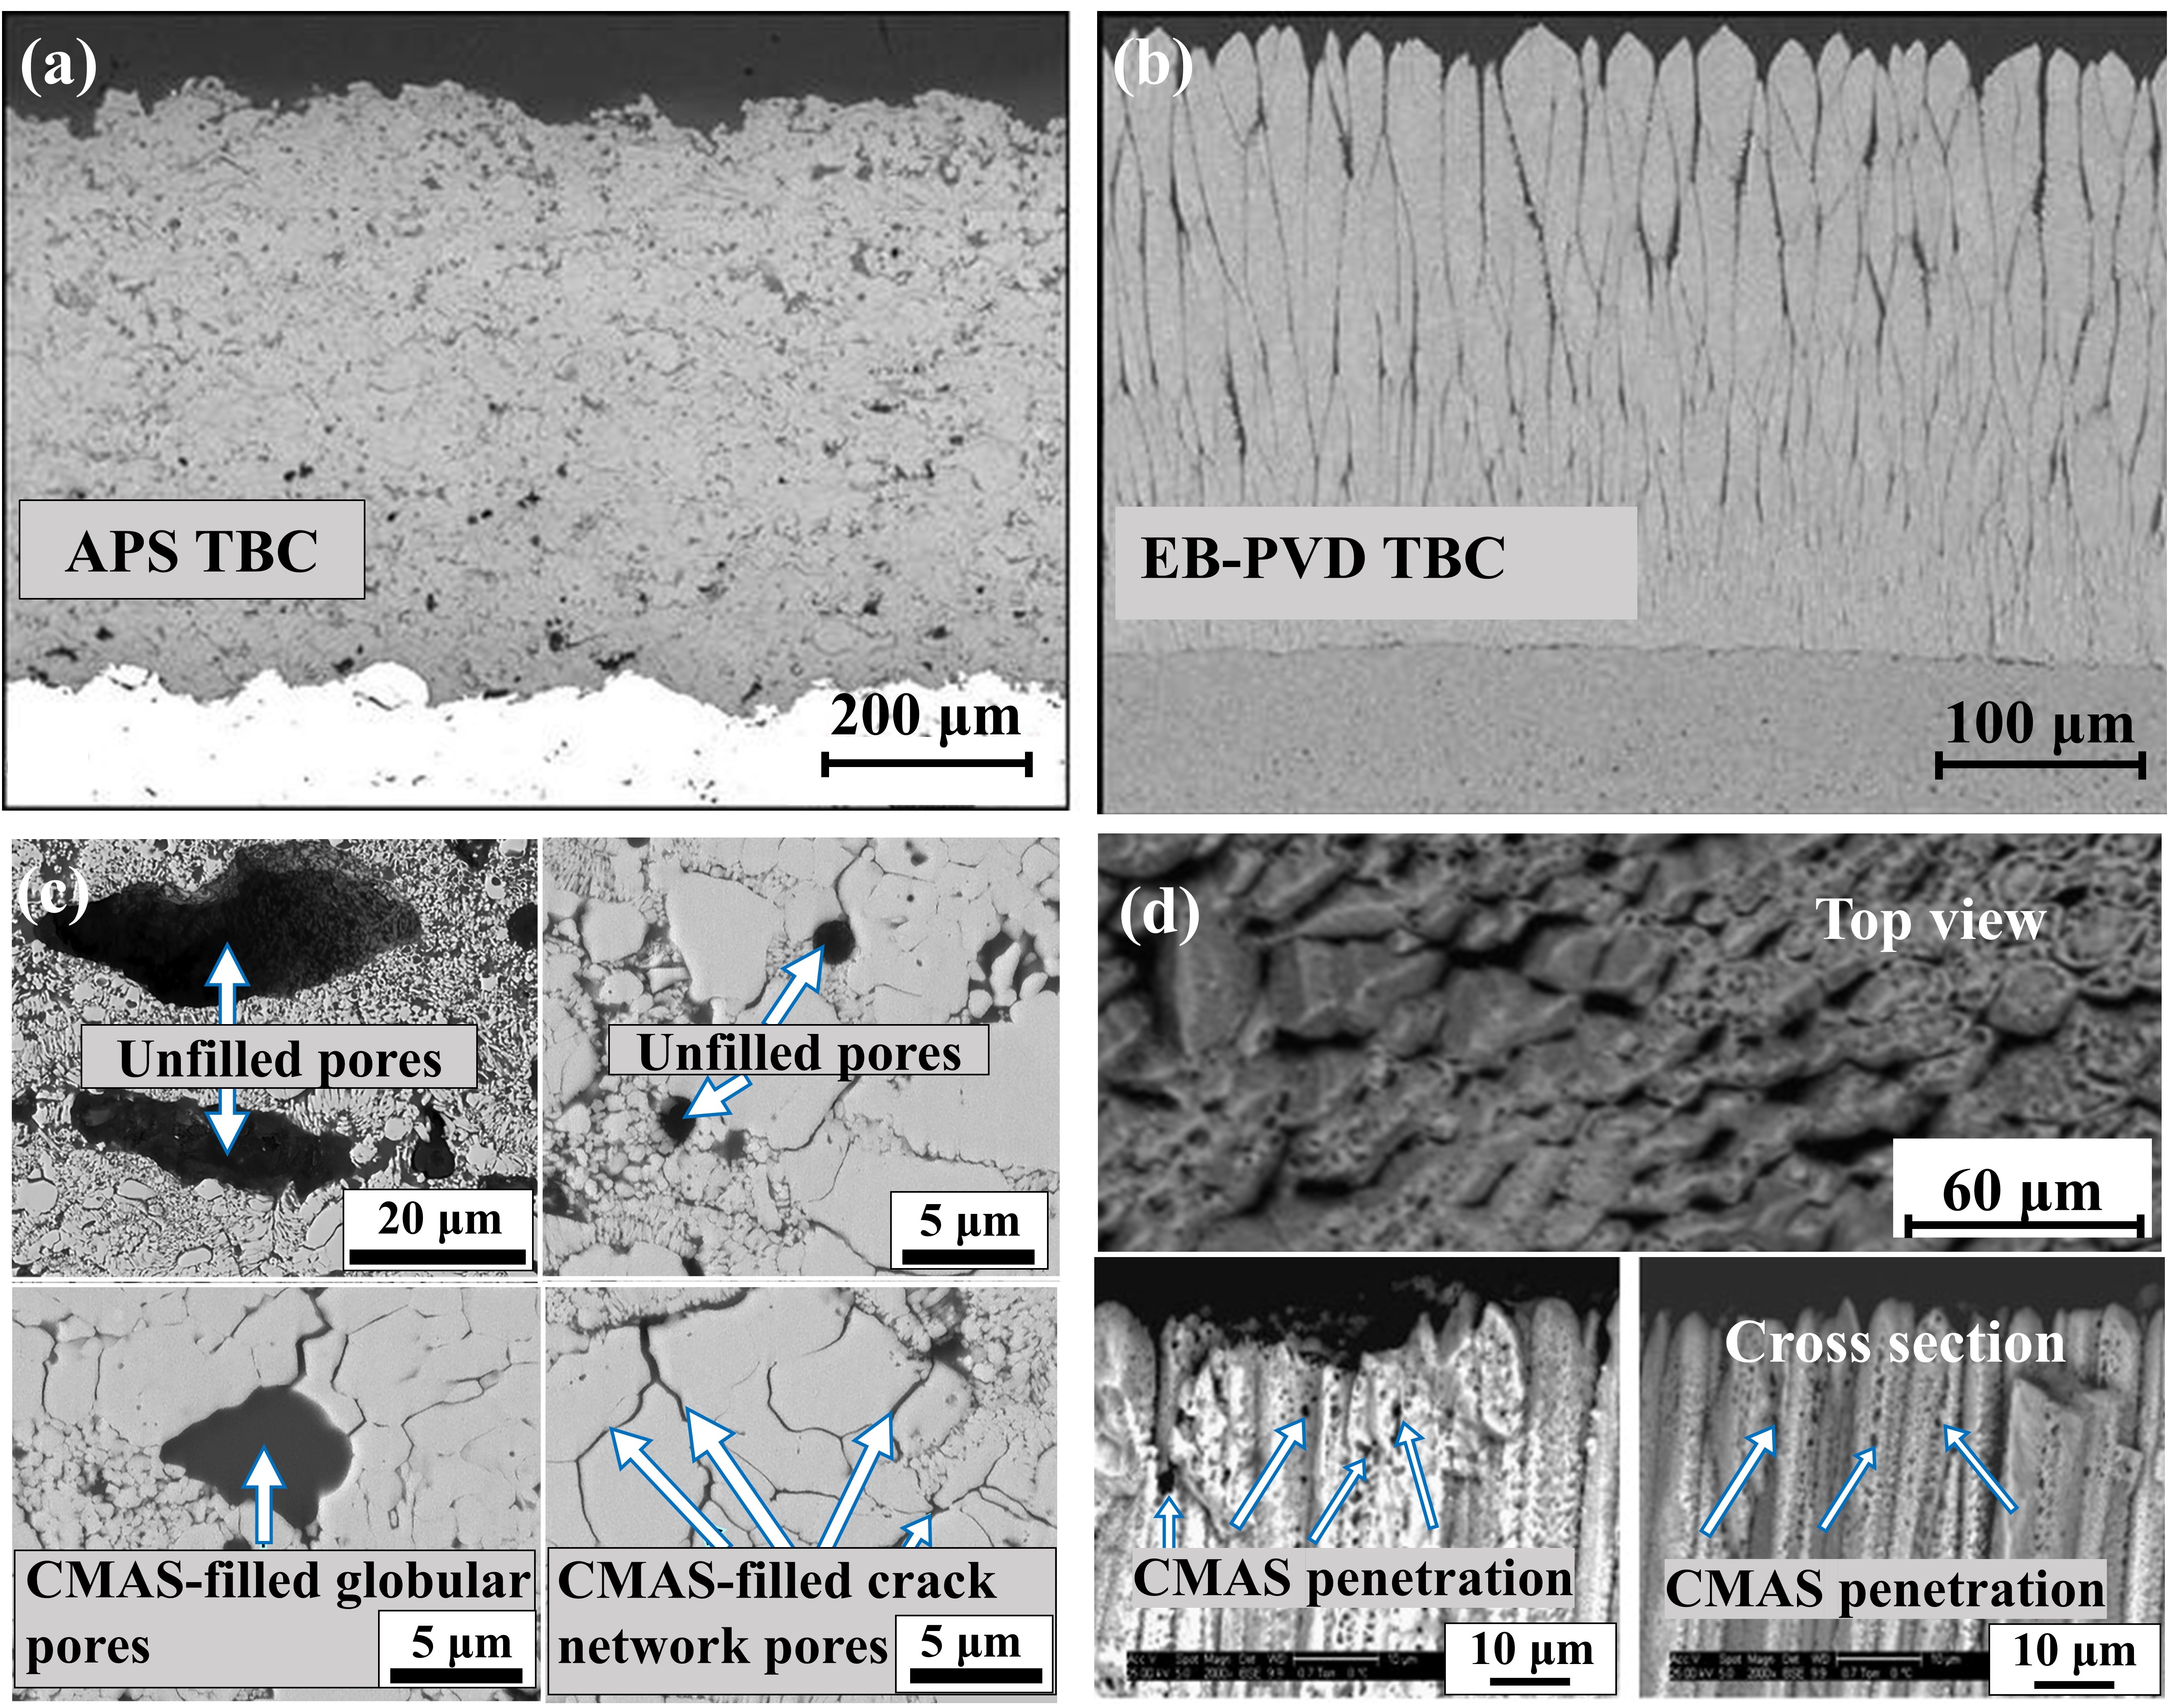
Fig. 18.
Typical microstructure and the microstructure after CMAS of TBC prepared by APS and EB-PVD: (a) 7YSZ TBC prepared by APS and (b) EB-PVD, (c) microstructures of 8YSZ APS TBC after CMAS corrosion at 1250 ℃ for 3 h and (d) microstructures of 7YSZ EB-PVD TBC after CMAS corrosion at 1300 ℃ for 4 h. Reproduced with permission from Ref. [
65
] for (a, b), © Springer Nature 2008. Ref. [
66
] for (c), © Elsvier 2020. Ref. [
67
] for (d), © Elsvier 2010.
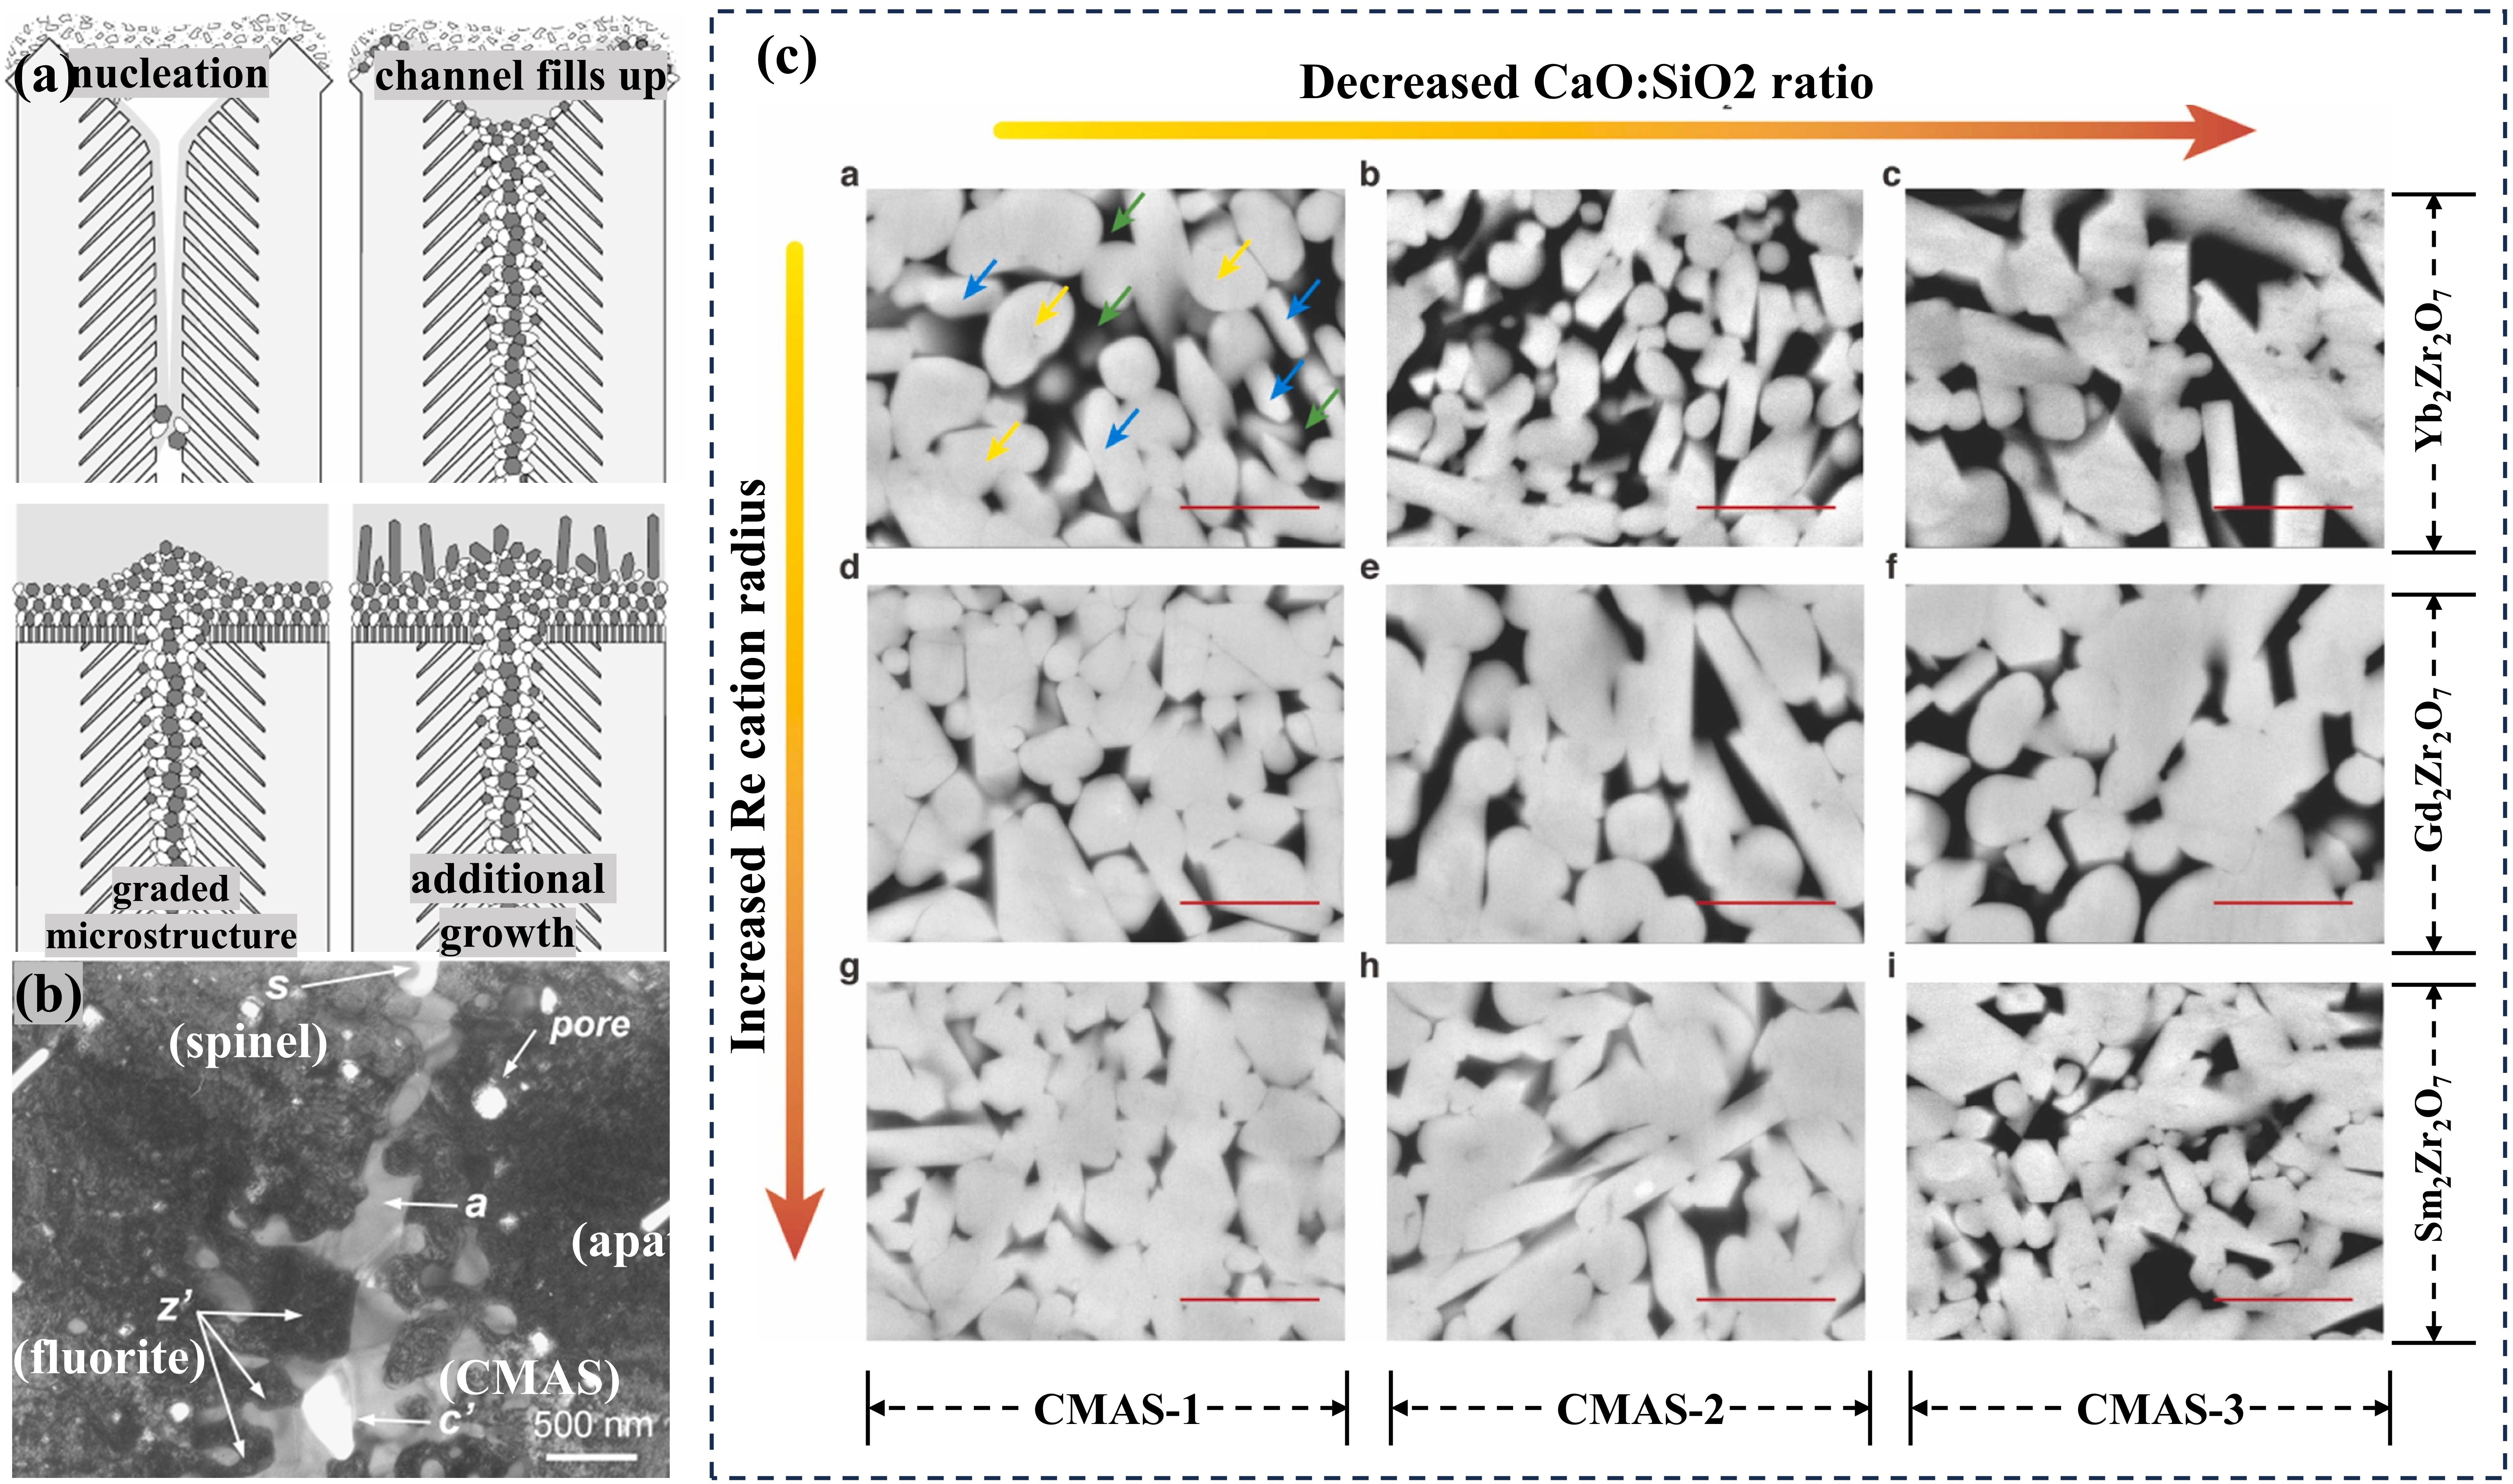
Fig. 19.
(a) Schematic representation of the envisaged mechanism leading to the microstructure of the RE
2
Zr
2
O
7
reaction layer, (b) bright field TEM micrograph of the corrosion reaction zone of the RE
2
Zr
2
O
7
. Phases: z’: fluorite, a: apatite, s: spinel, p: pore, c’: CMAS, (c) Back-scattering SEM images demonstrating the crystallization products in different RE
2
Zr
2
O
7
-CMAS systems from high-temperature reaction experiments conducted at 1300 ℃/30 min. Reproduced with permission from Ref. [
70
] for (a, b), © John Wiley & Sons - Books 2008. Ref. [
72
] for (c), © Elsvier 2023.
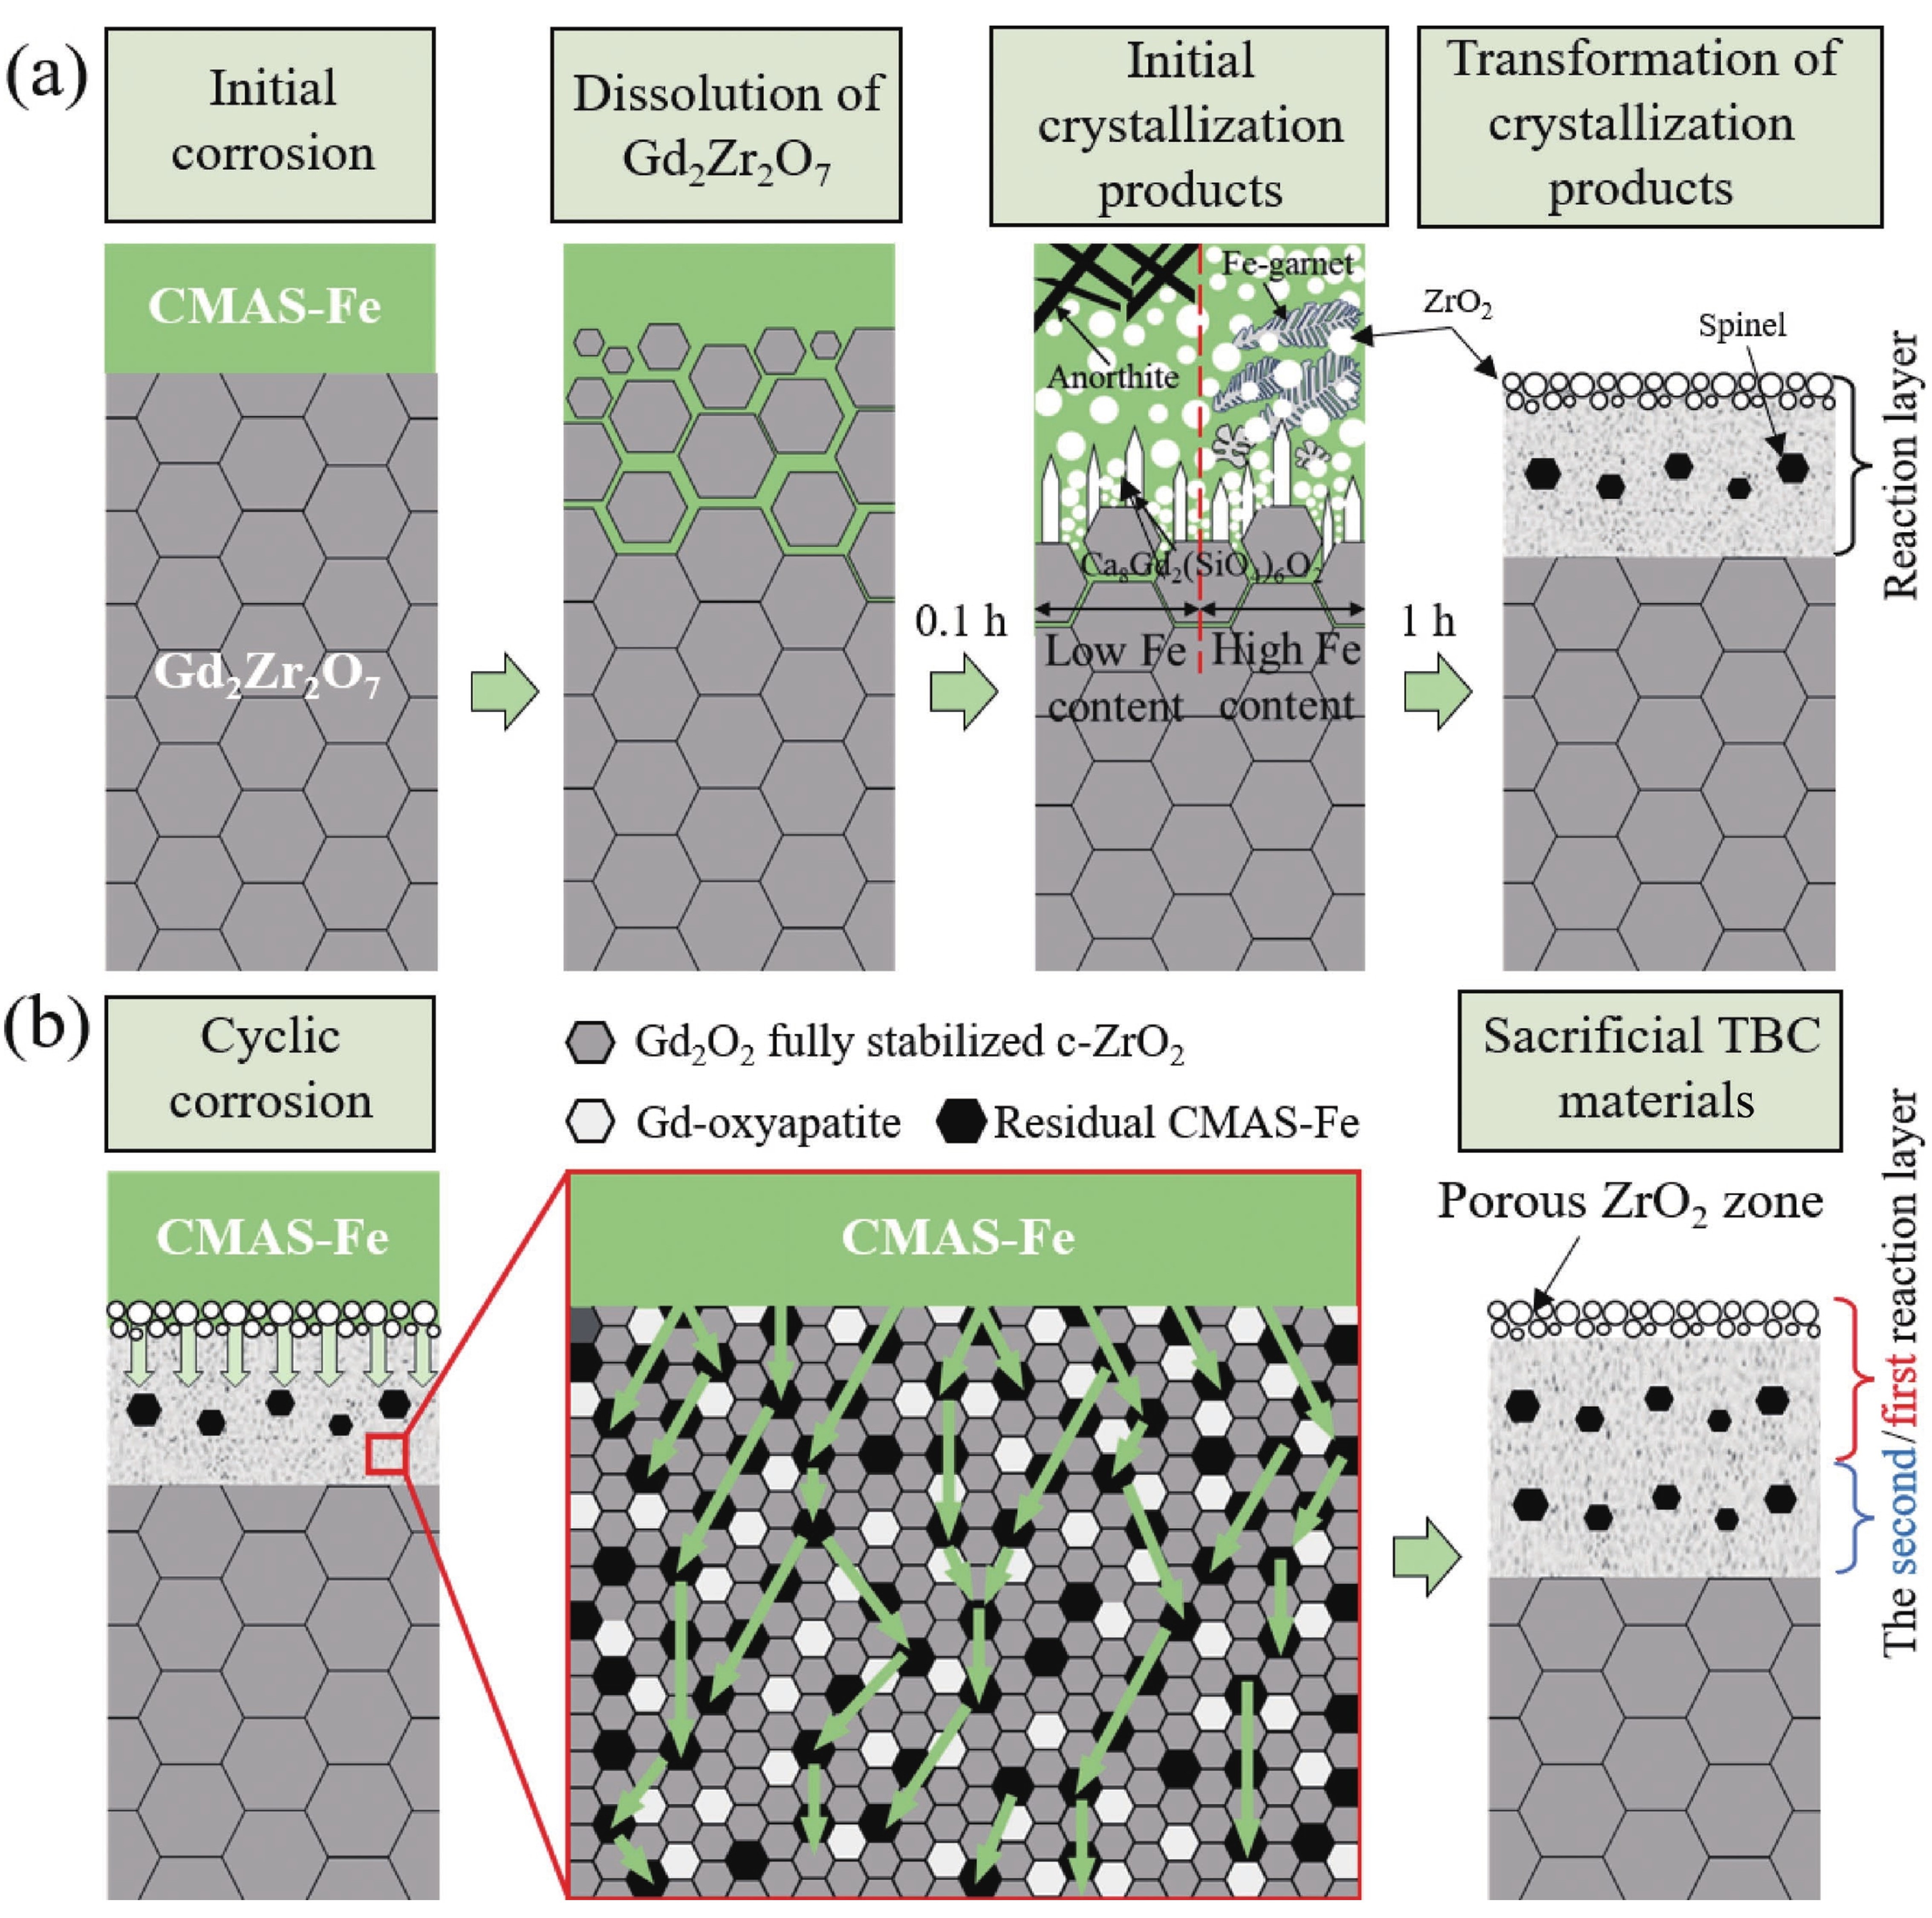
Fig. 20.
Schematic diagram of formation and growth of reaction layer of Gd
2
Zr
2
O
7
coating under CMAS-Fe corrosion. Reproduced with permission from Ref. [
73
], © Author(s) 2024.
Table 1
Thermal conductivity and thermal expansion coefficient of RE
2
Zr
2
O
7
[
68
]
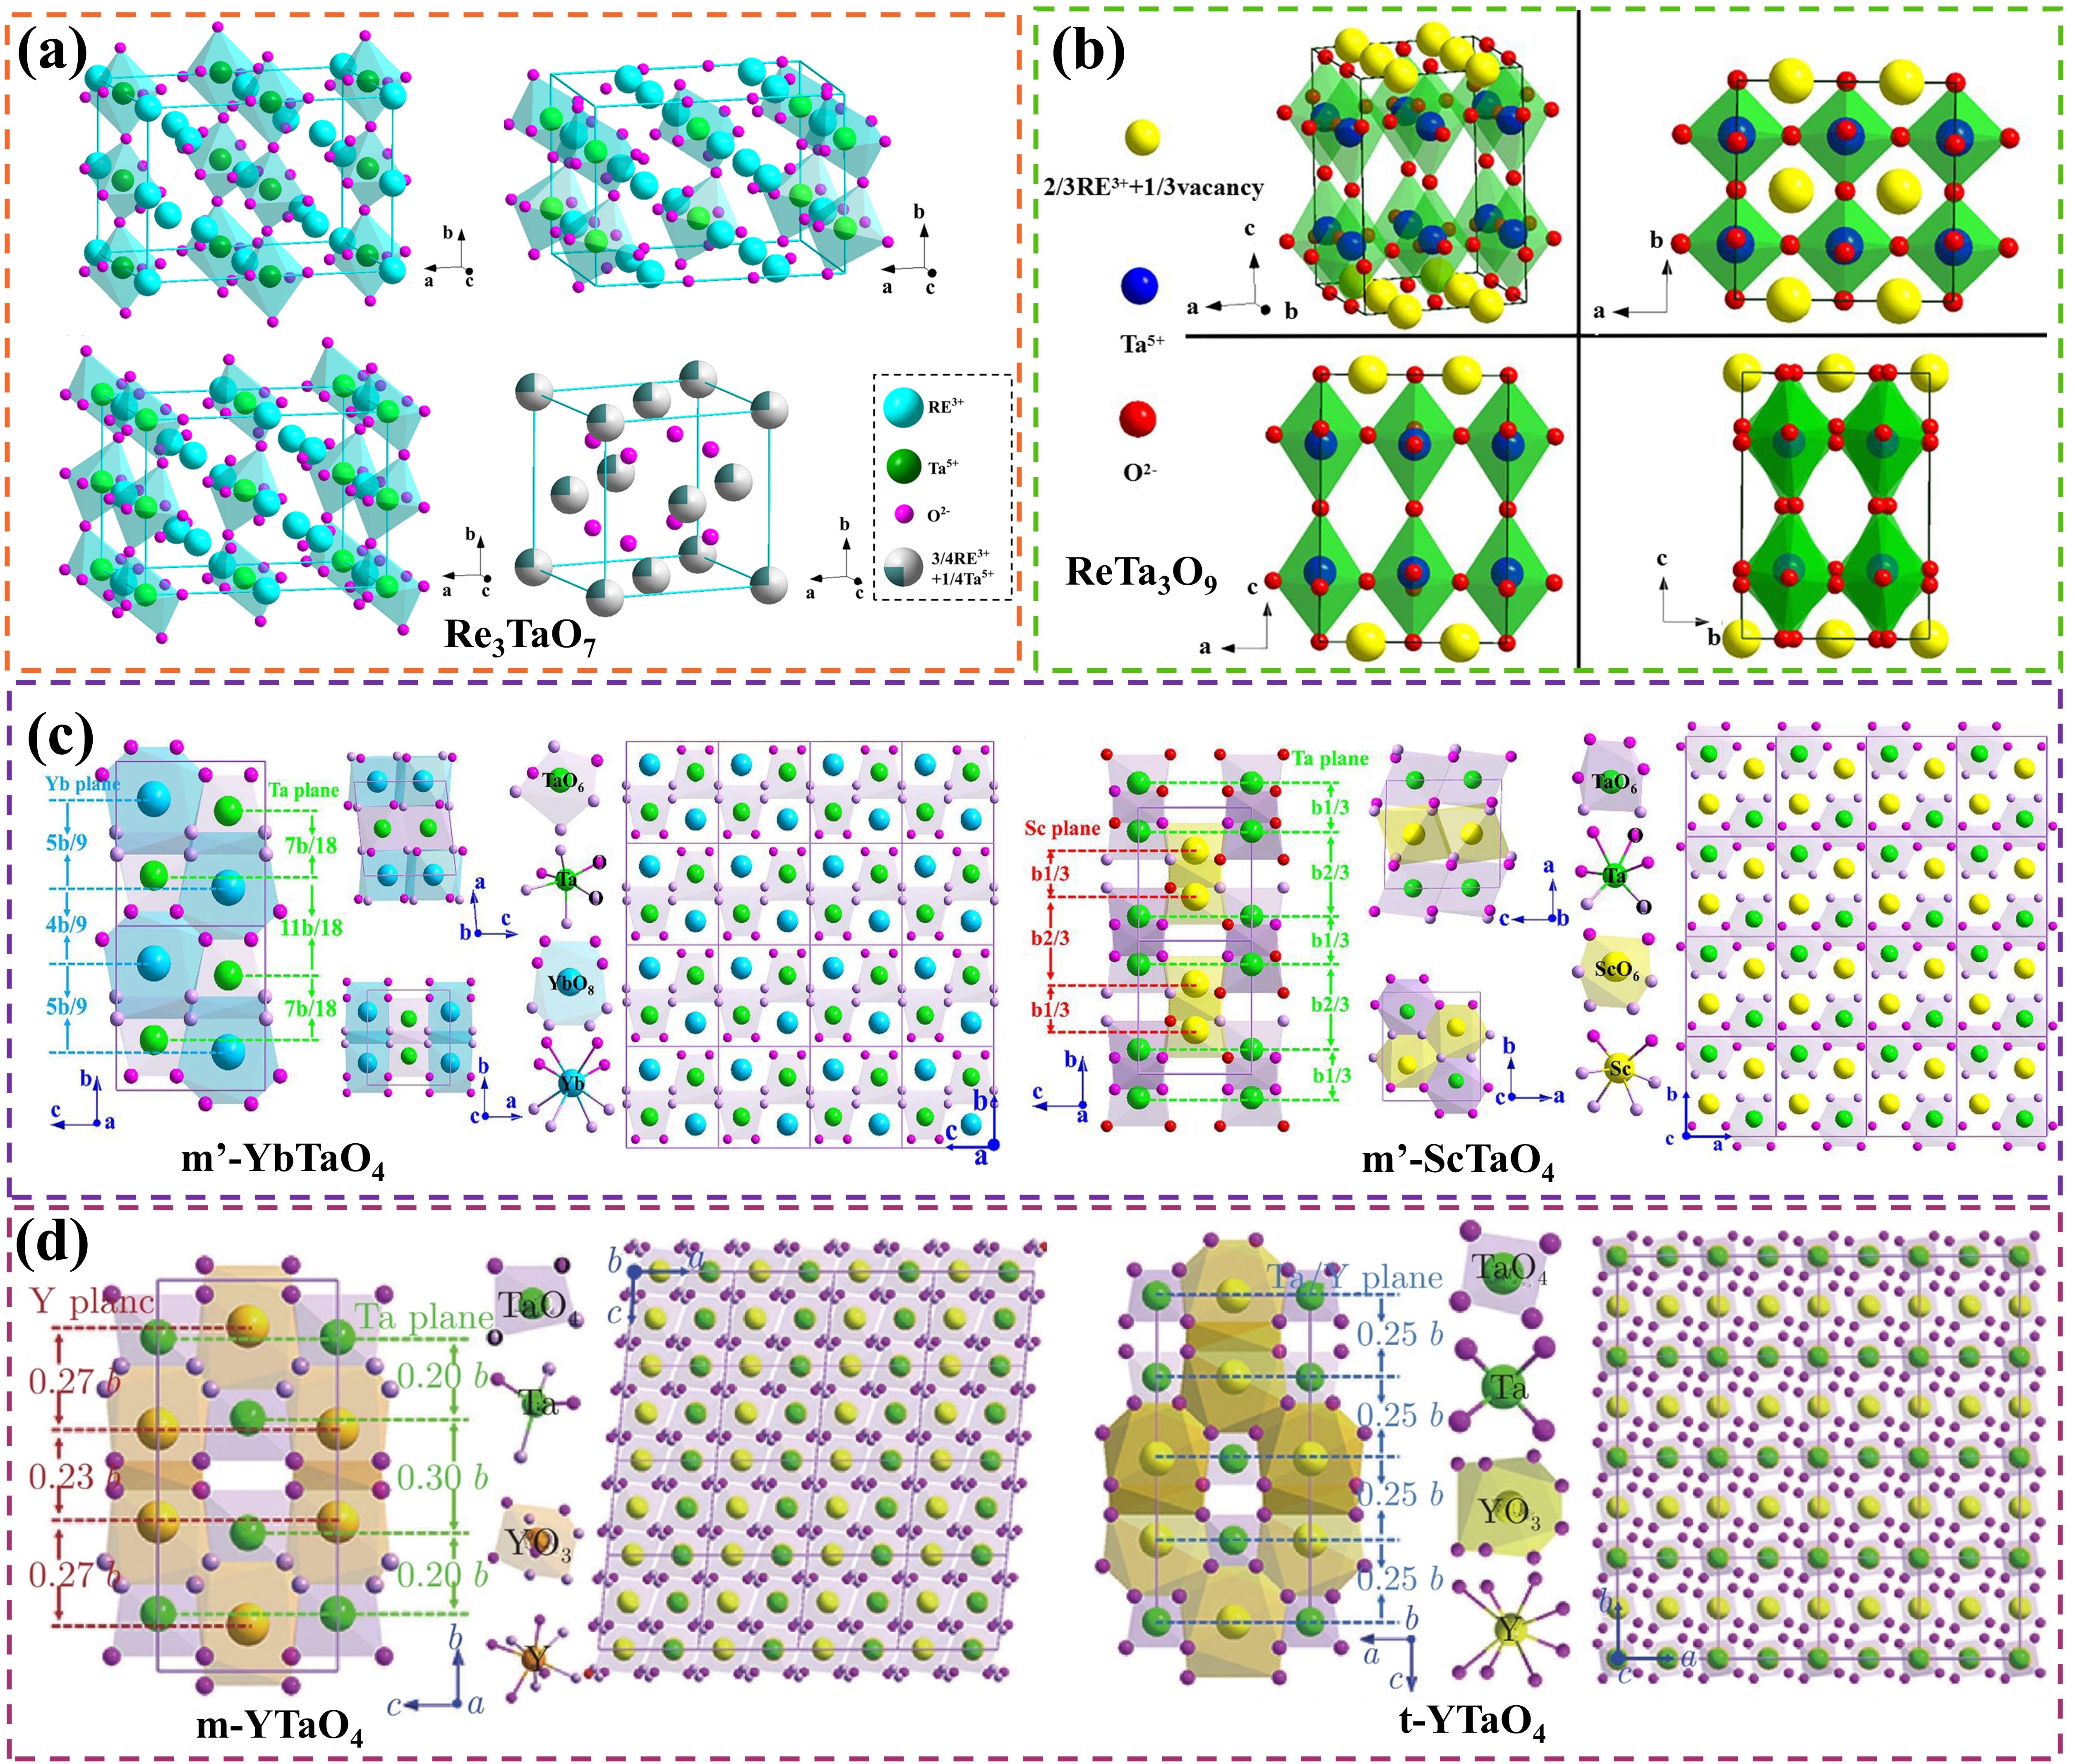
Fig. 21.
Crystal structure of rare earth tantalates (a) RE
3
TaO
7
, (b) RETa
3
O
9
, (c) and (d) RETaO
4
ceramics. Reproduced with permission from Ref. [
77
] for (a), © John Wiley & Sons 2018. Ref. [
78
] for (b), © John Wiley & Sons 2017. Ref. [
79
] for (c), © Elsevier 2020. Ref. [
80
] for (d), © syltlx 2022.
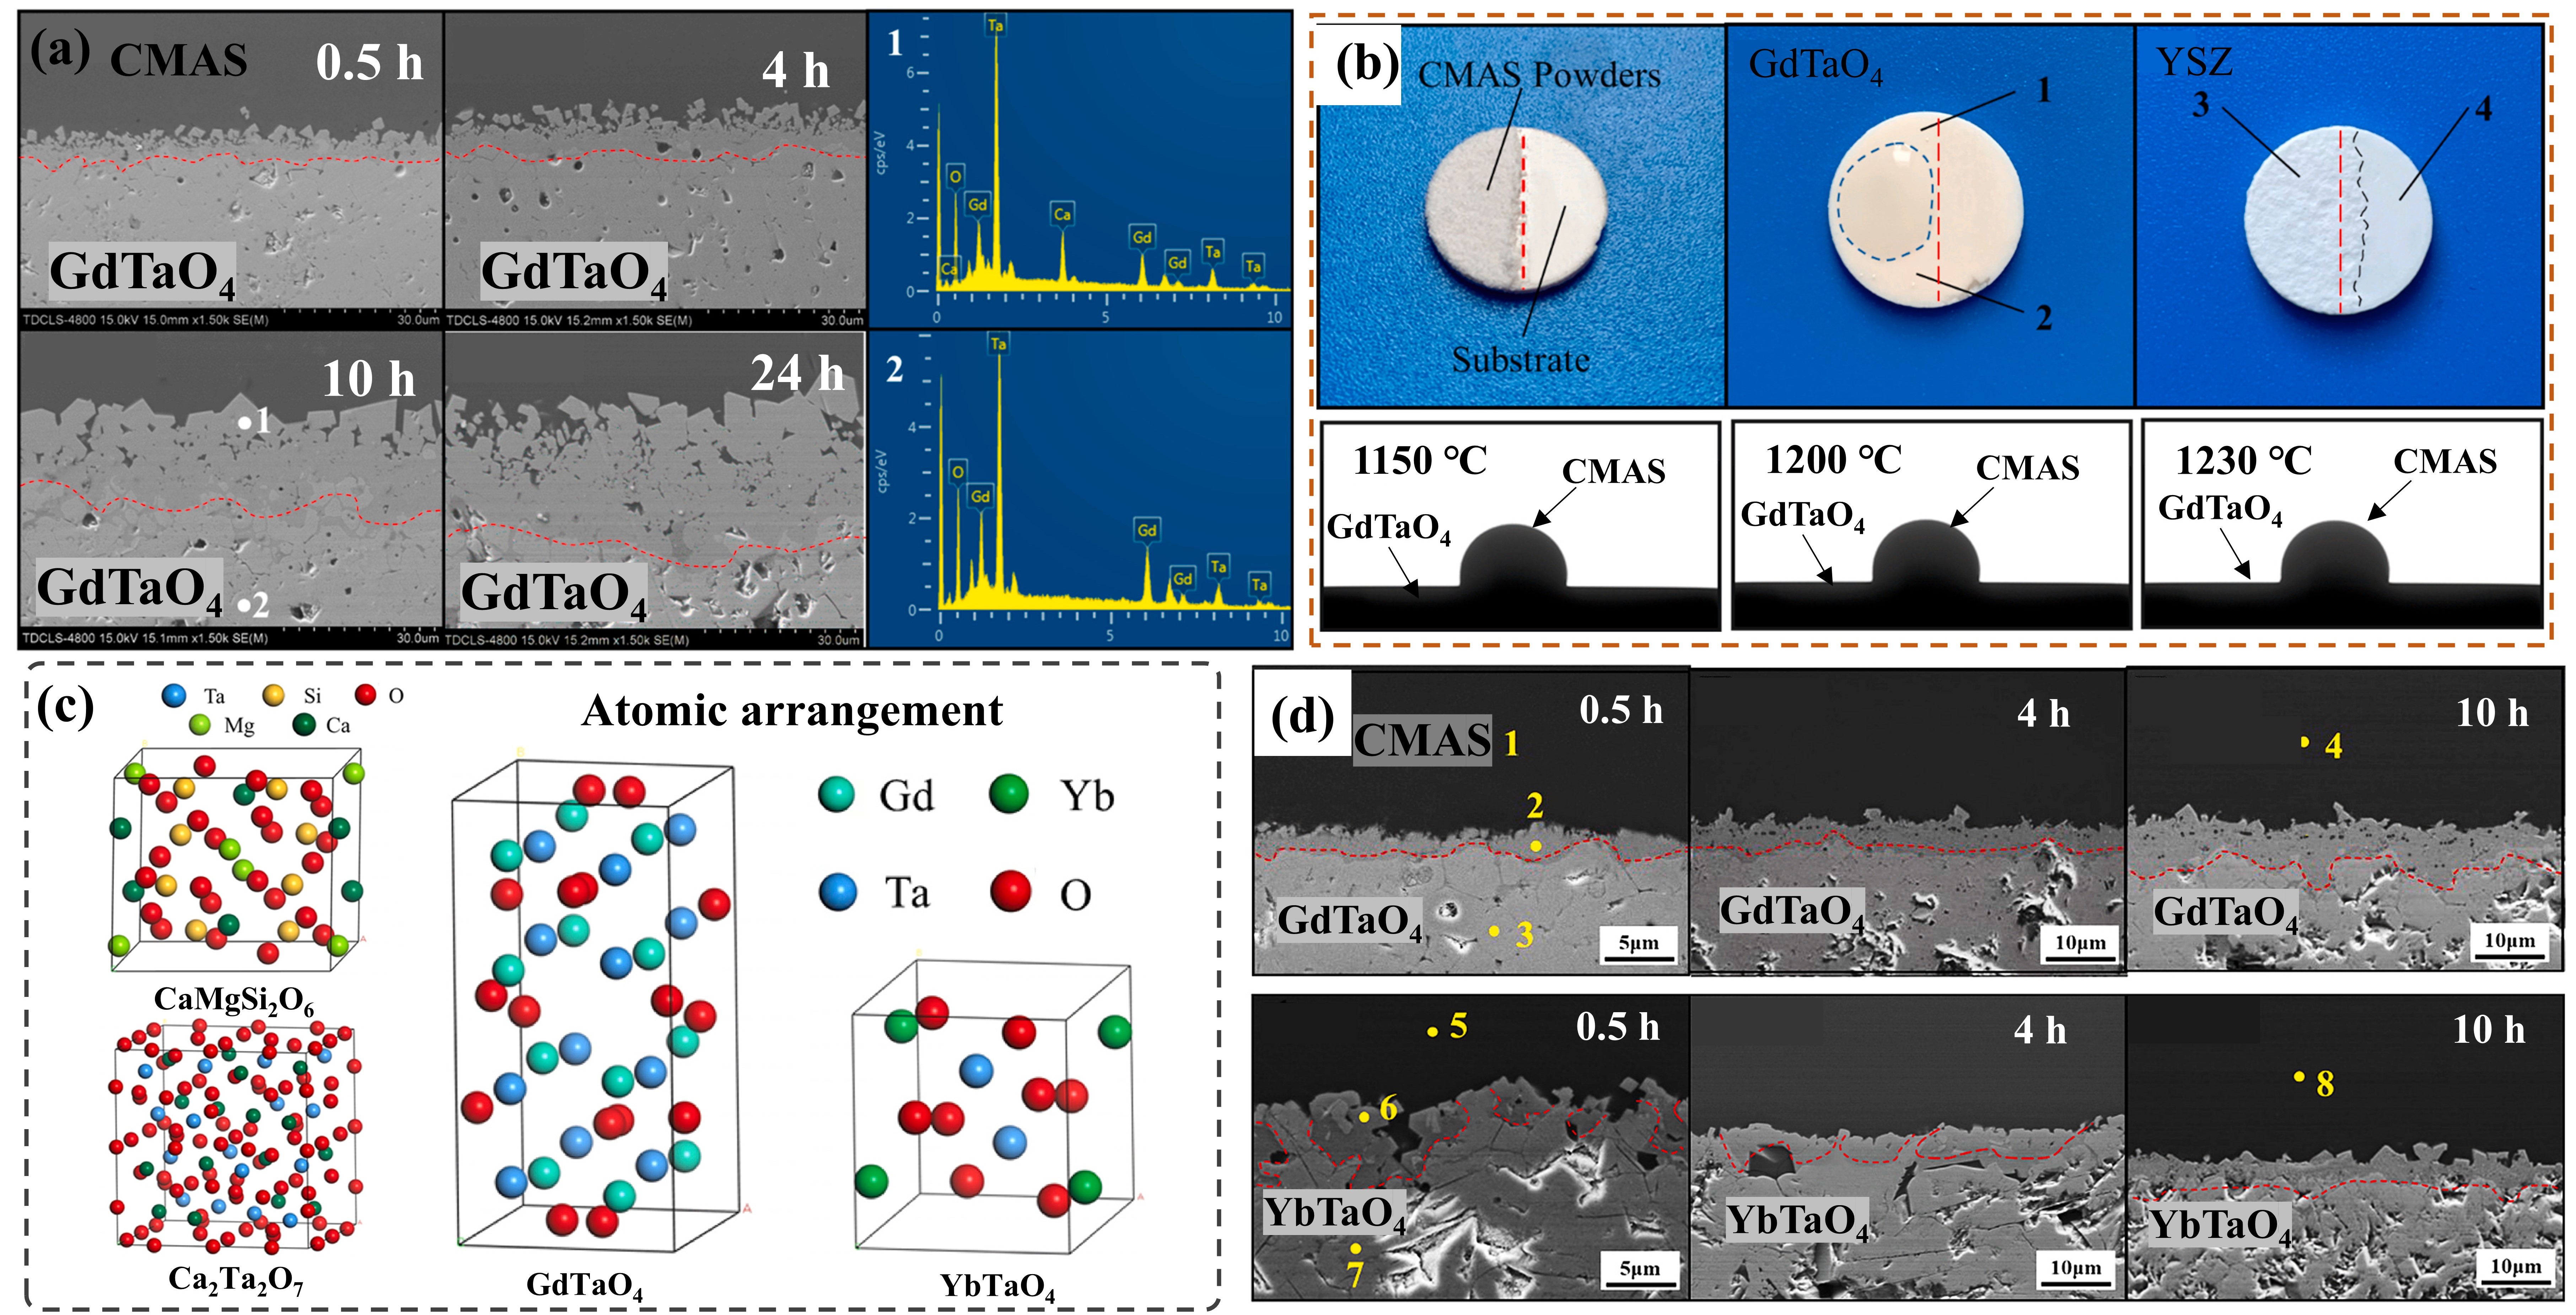
Fig. 22.
The interface microstructure, wetting process on-line photographs and atomic arrangement of GdTaO
4
and YbTaO
4
: (a) the interface microstructure of GdTaO
4
and CMAS (33Ca-9Mg-13Al-45Si) at 1350 ℃ for different time, (b) the surface state of GdTaO
4
and YSZ before and after high-temperature reaction, (c) the atomic arrangement of CaMgSi
2
O
6
, Ca
2
Ta
2
O
7
, GdTaO
4
and YbTaO
4
and (d) images of the reaction interface between residual CMAS and substrate. Reproduced with permission from Ref. [
81
] for (a, b), © Elsevier 2021. Ref. [
82
] for (c, d), © Elsevier 2022.
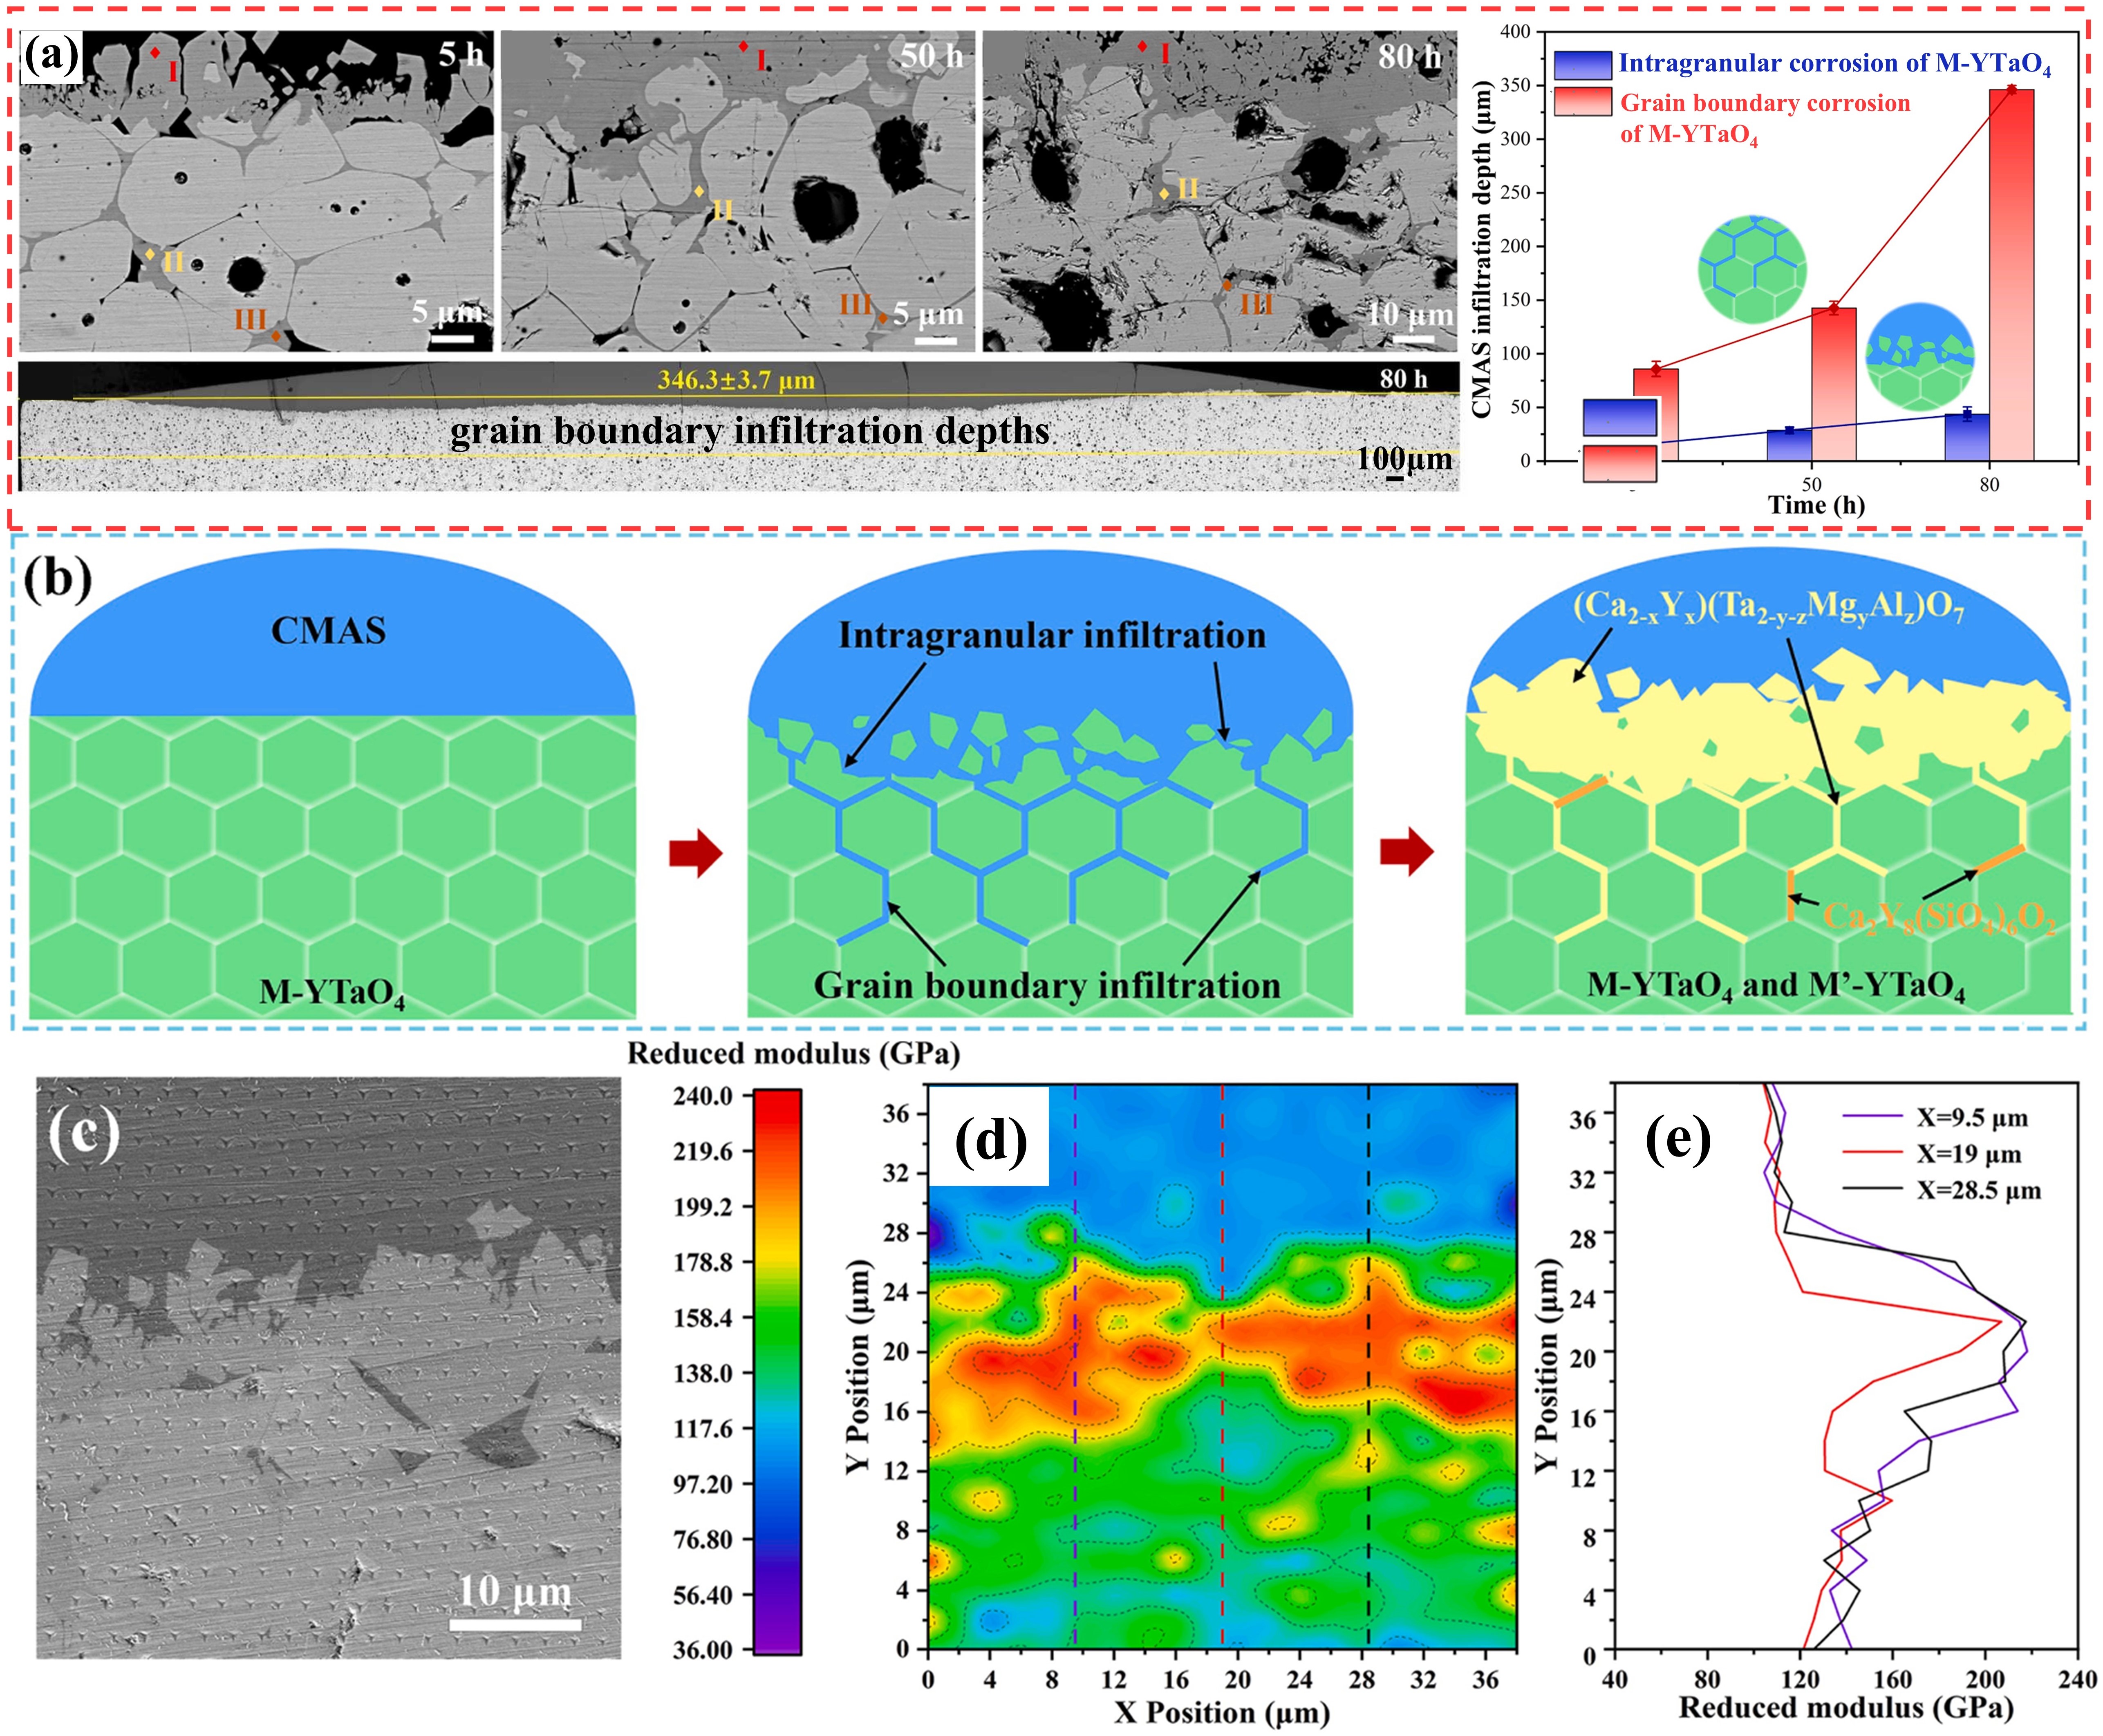
Fig. 23.
Corrosion mechanism of M-YTaO
4
: (a) images of cross-sections and grain boundary infiltration depths of M-YTaO
4
after CMAS corrosion, (b) schematic diagram of CMAS corrosion of M-YTaO
4
, (c) the interface between residual CMAS melt and M-YTaO
4
substrate after CMAS corrosion at 1300 ℃ for 5 h, (d) Mapping and (e) section lines of reduced moduli corresponding to (c). Reproduced with permission from Ref. [
83
], © Elsevier 2024.
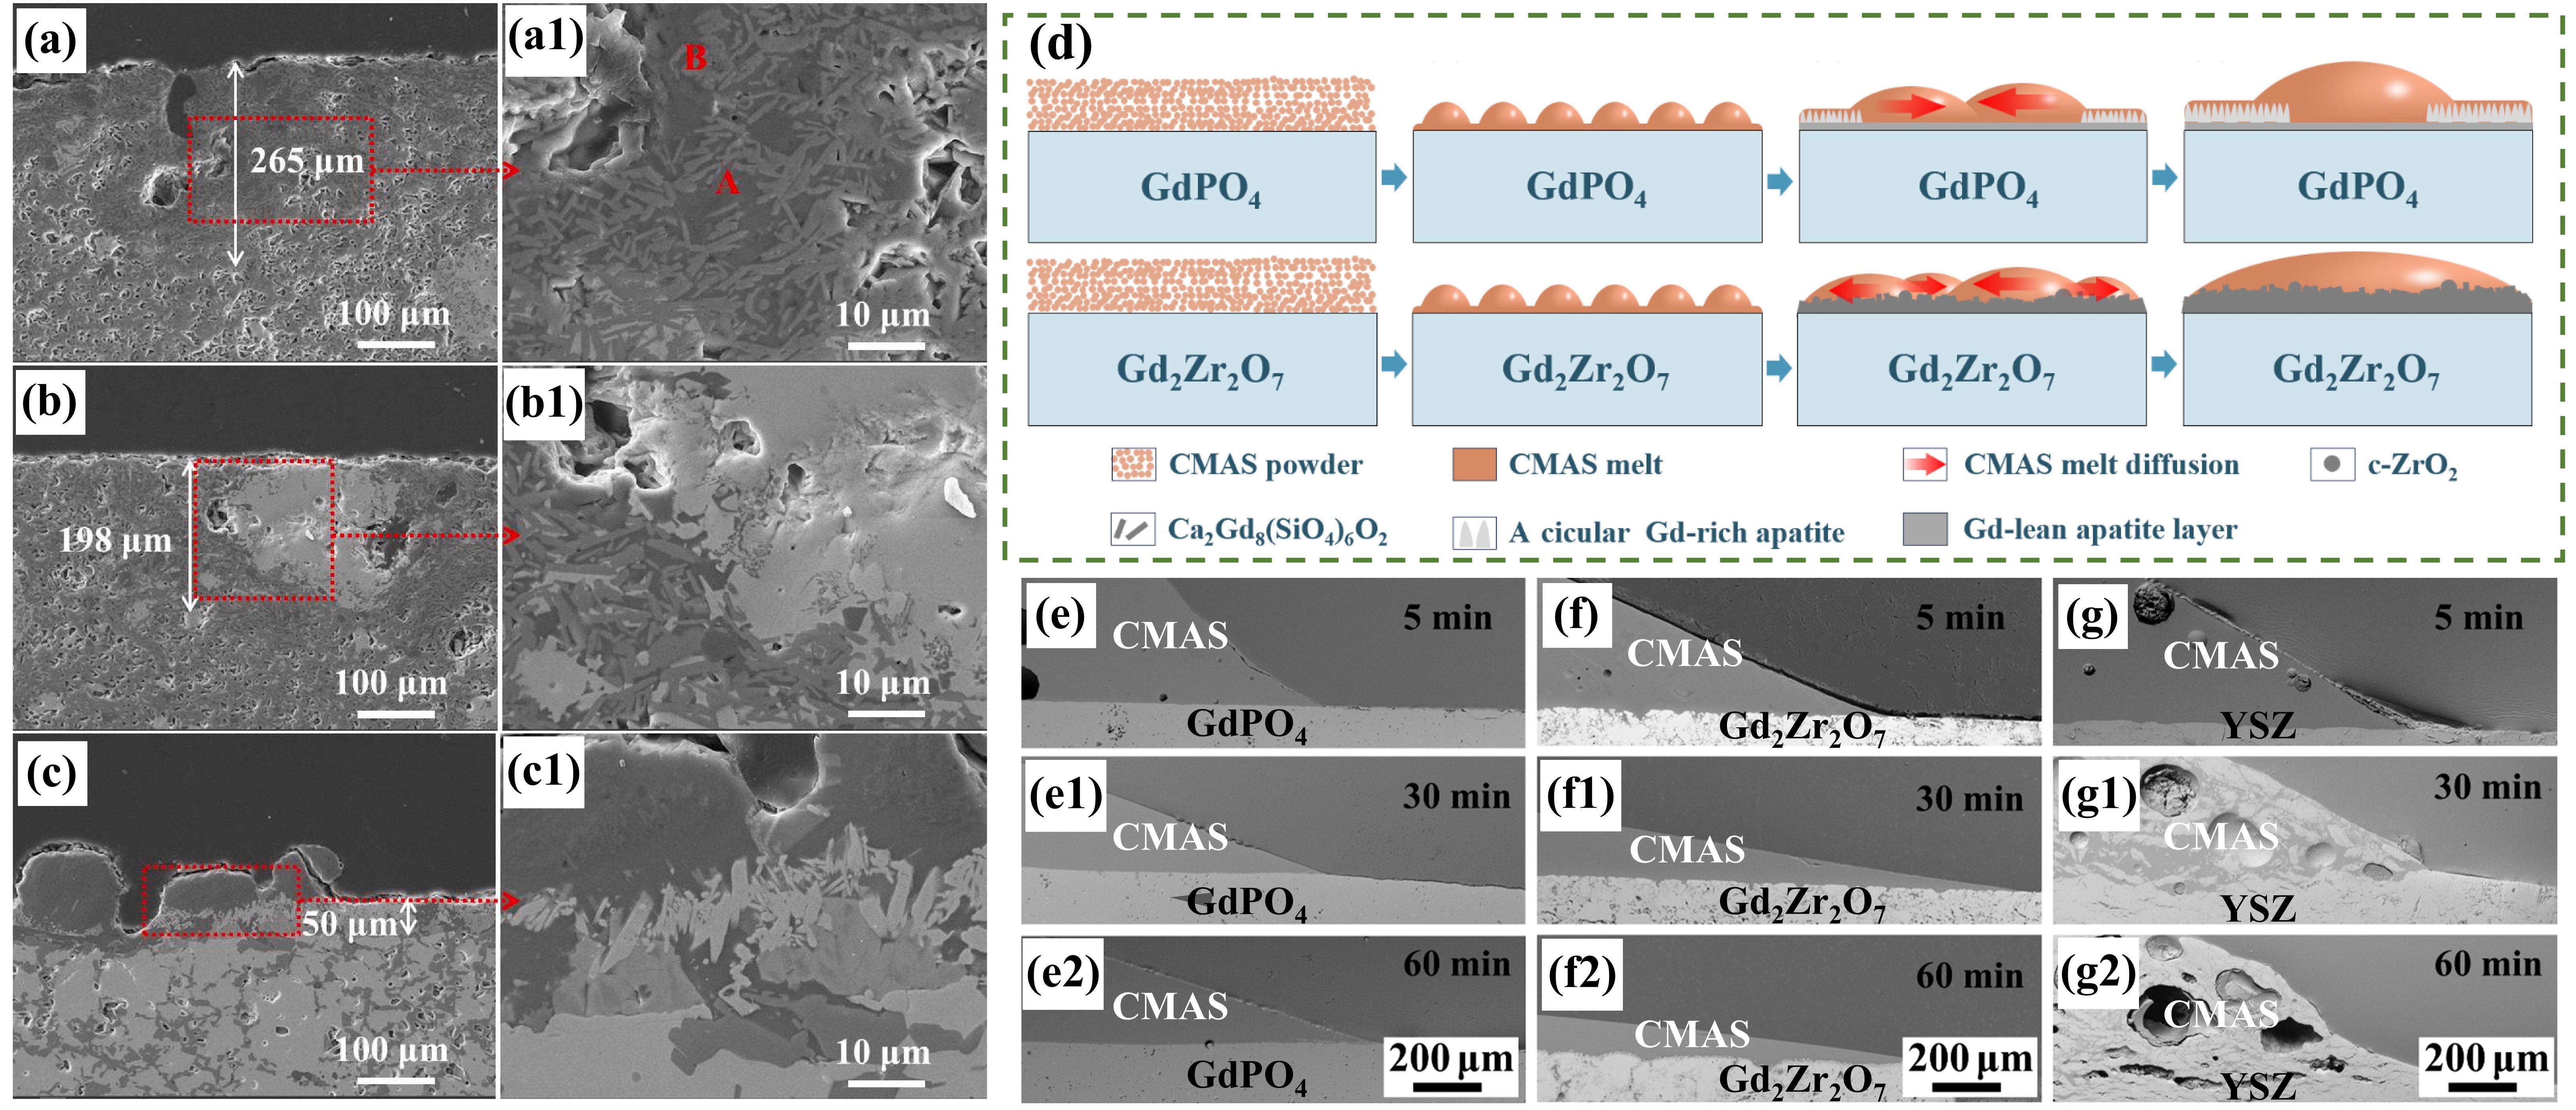
Fig. 24.
(a-c) SEM images of the cross-sectional morphologies of LMA/GdPO
4
after CMAS corrosion, (d) Schematic diagrams of CMAS wetting behavior of GdPO
4
and Gd
2
Zr
2
O
7
, and cross-sectional images of contact angles of CMAS droplets on (e-e2) GdPO
4
, (f-f2) Gd
2
Zr
2
O
7
, and (g-g2) YSZ. Reproduced with permission from Ref. [
85
] for (a-c), © Elsevier 2023. Ref. [
86
] for (d-g), © Author(s) 2024.
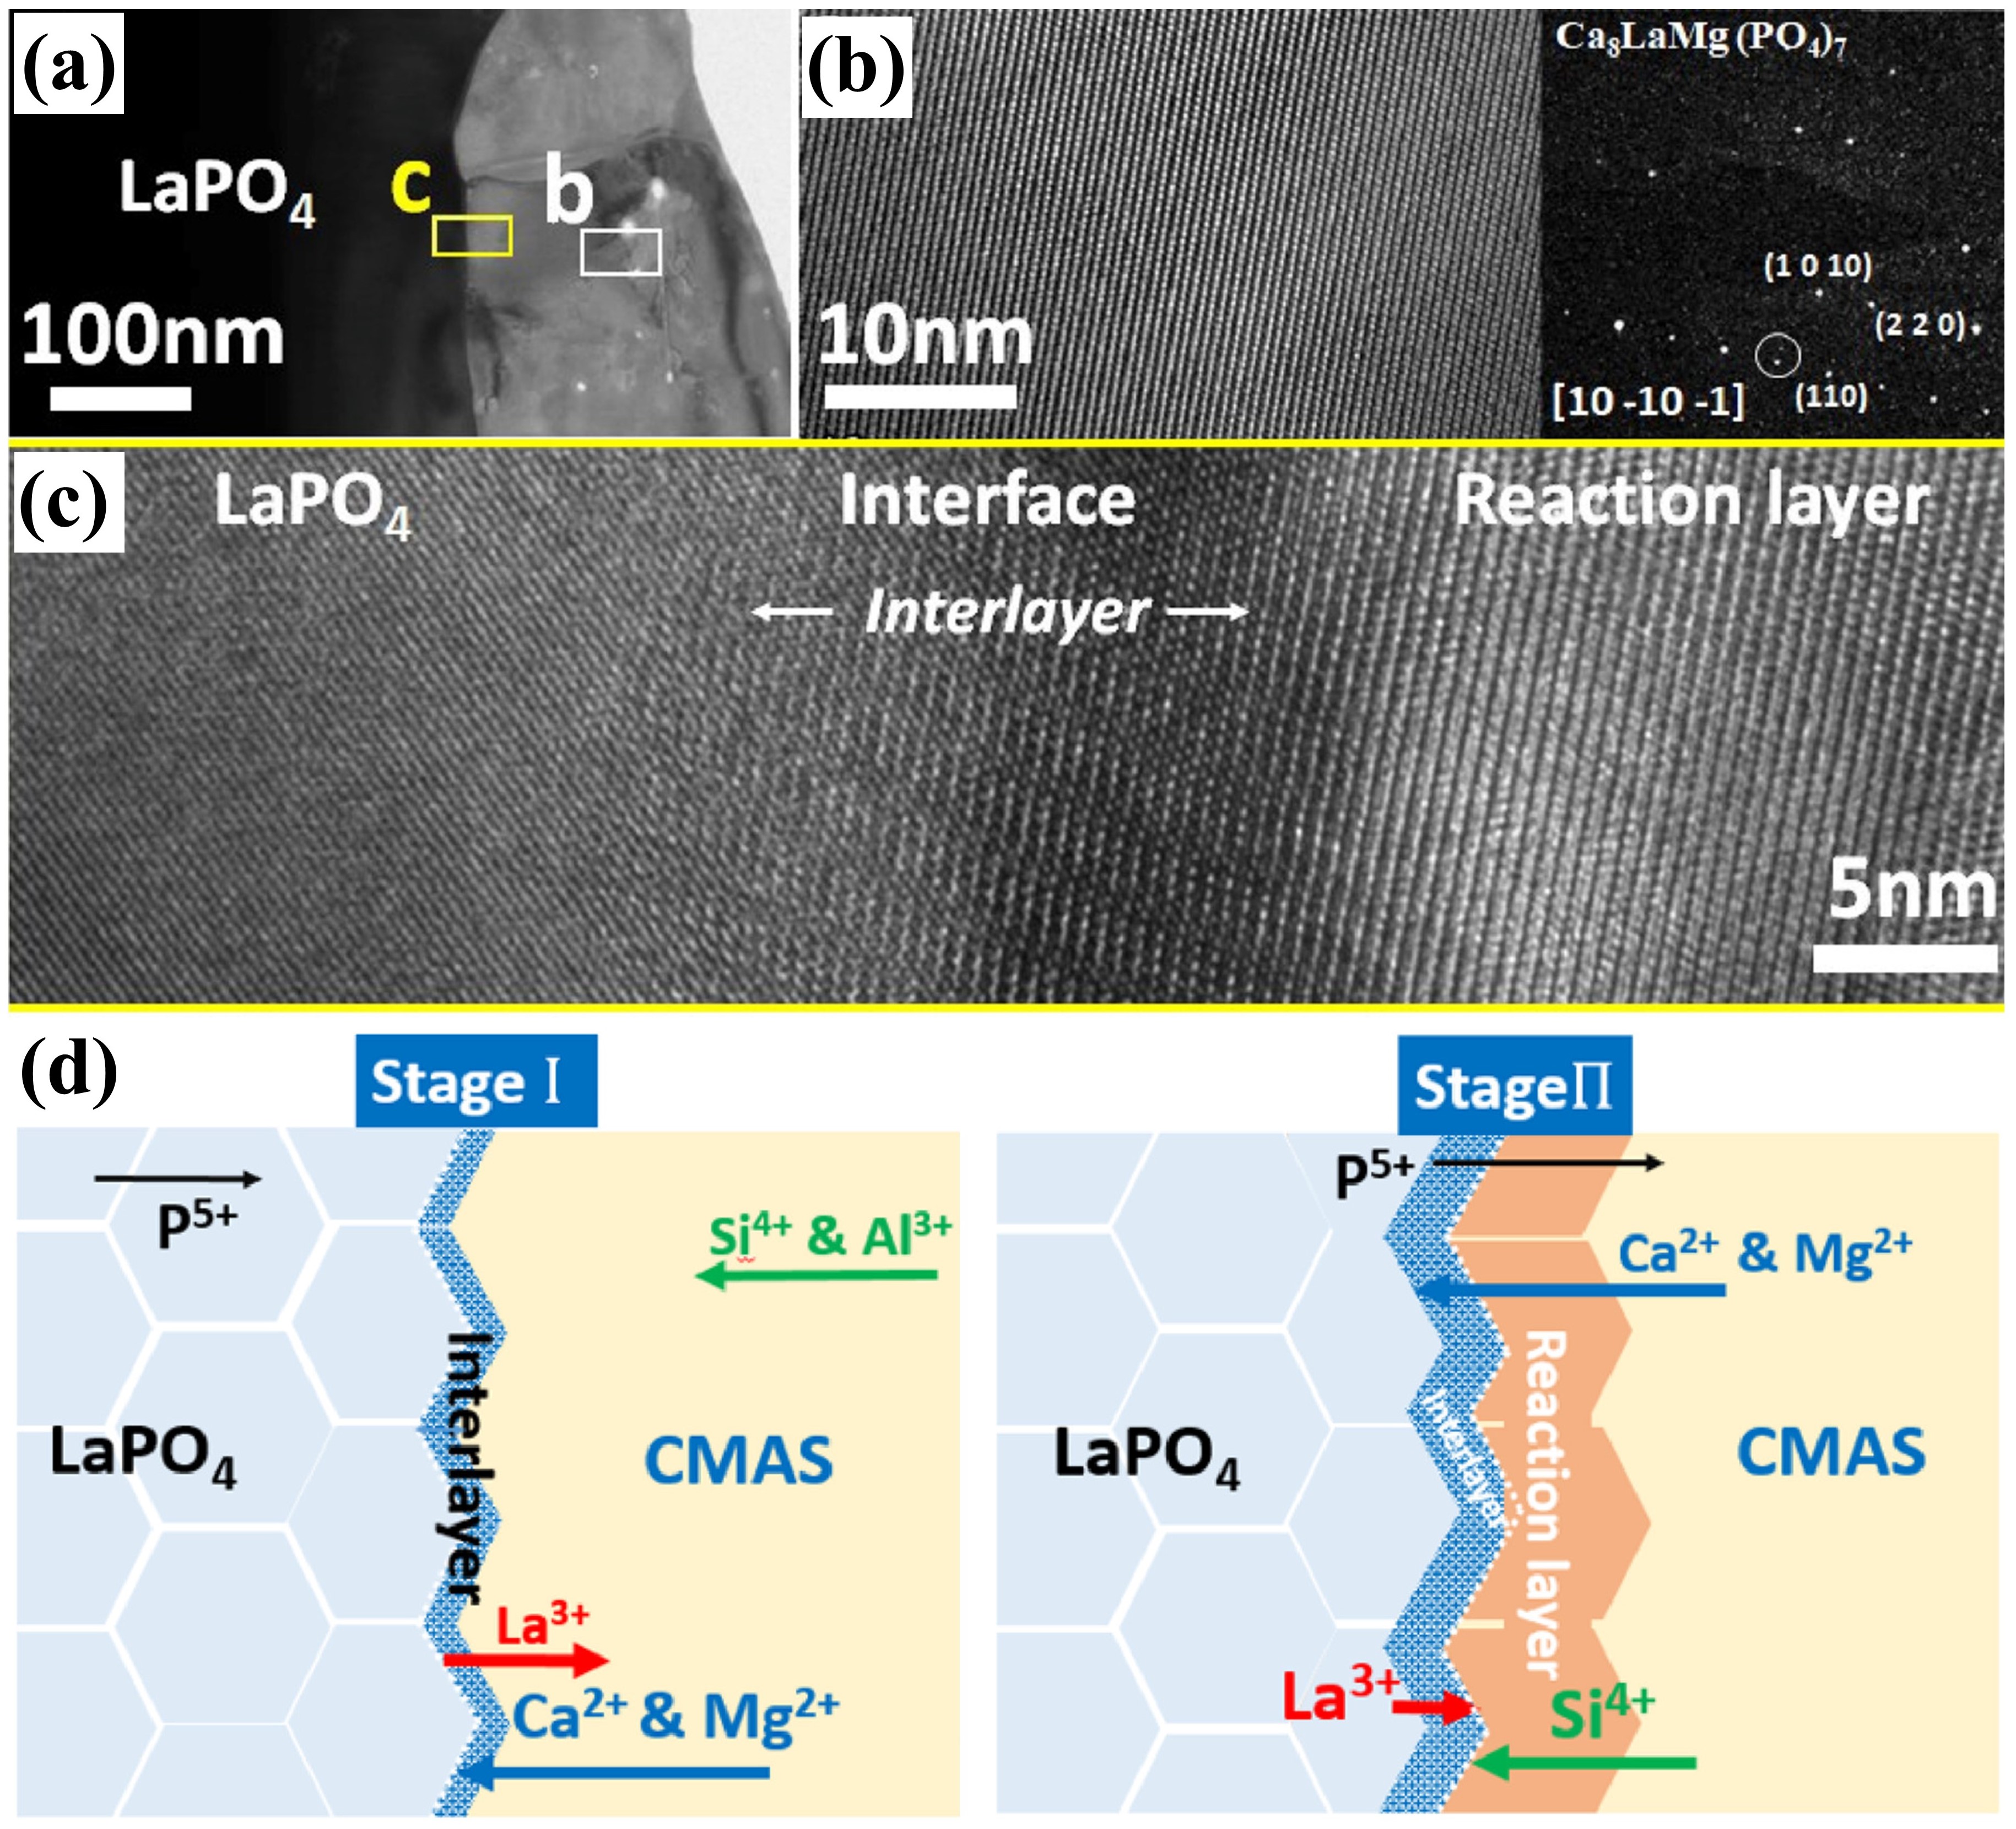
Fig. 25.
(a) Bright-field TEM image of LaPO
4
and its reaction layer with CMAS after CMAS attack at 1250 ℃ for 5min, (b) HRTEM image of the reaction layer in (a), with an inset image of the diffraction pattern of the reaction layer, (c) HRTEM image of interlayer, and (d) schematic of the transport mechanisms associated with the formation of a transient interlayer and reaction layer across the LaPO
4
-CMAS interface when exposed to CMAS attack at 1250 ℃. Reproduced with permission from Ref. [
87
], © Author(s) 2024.
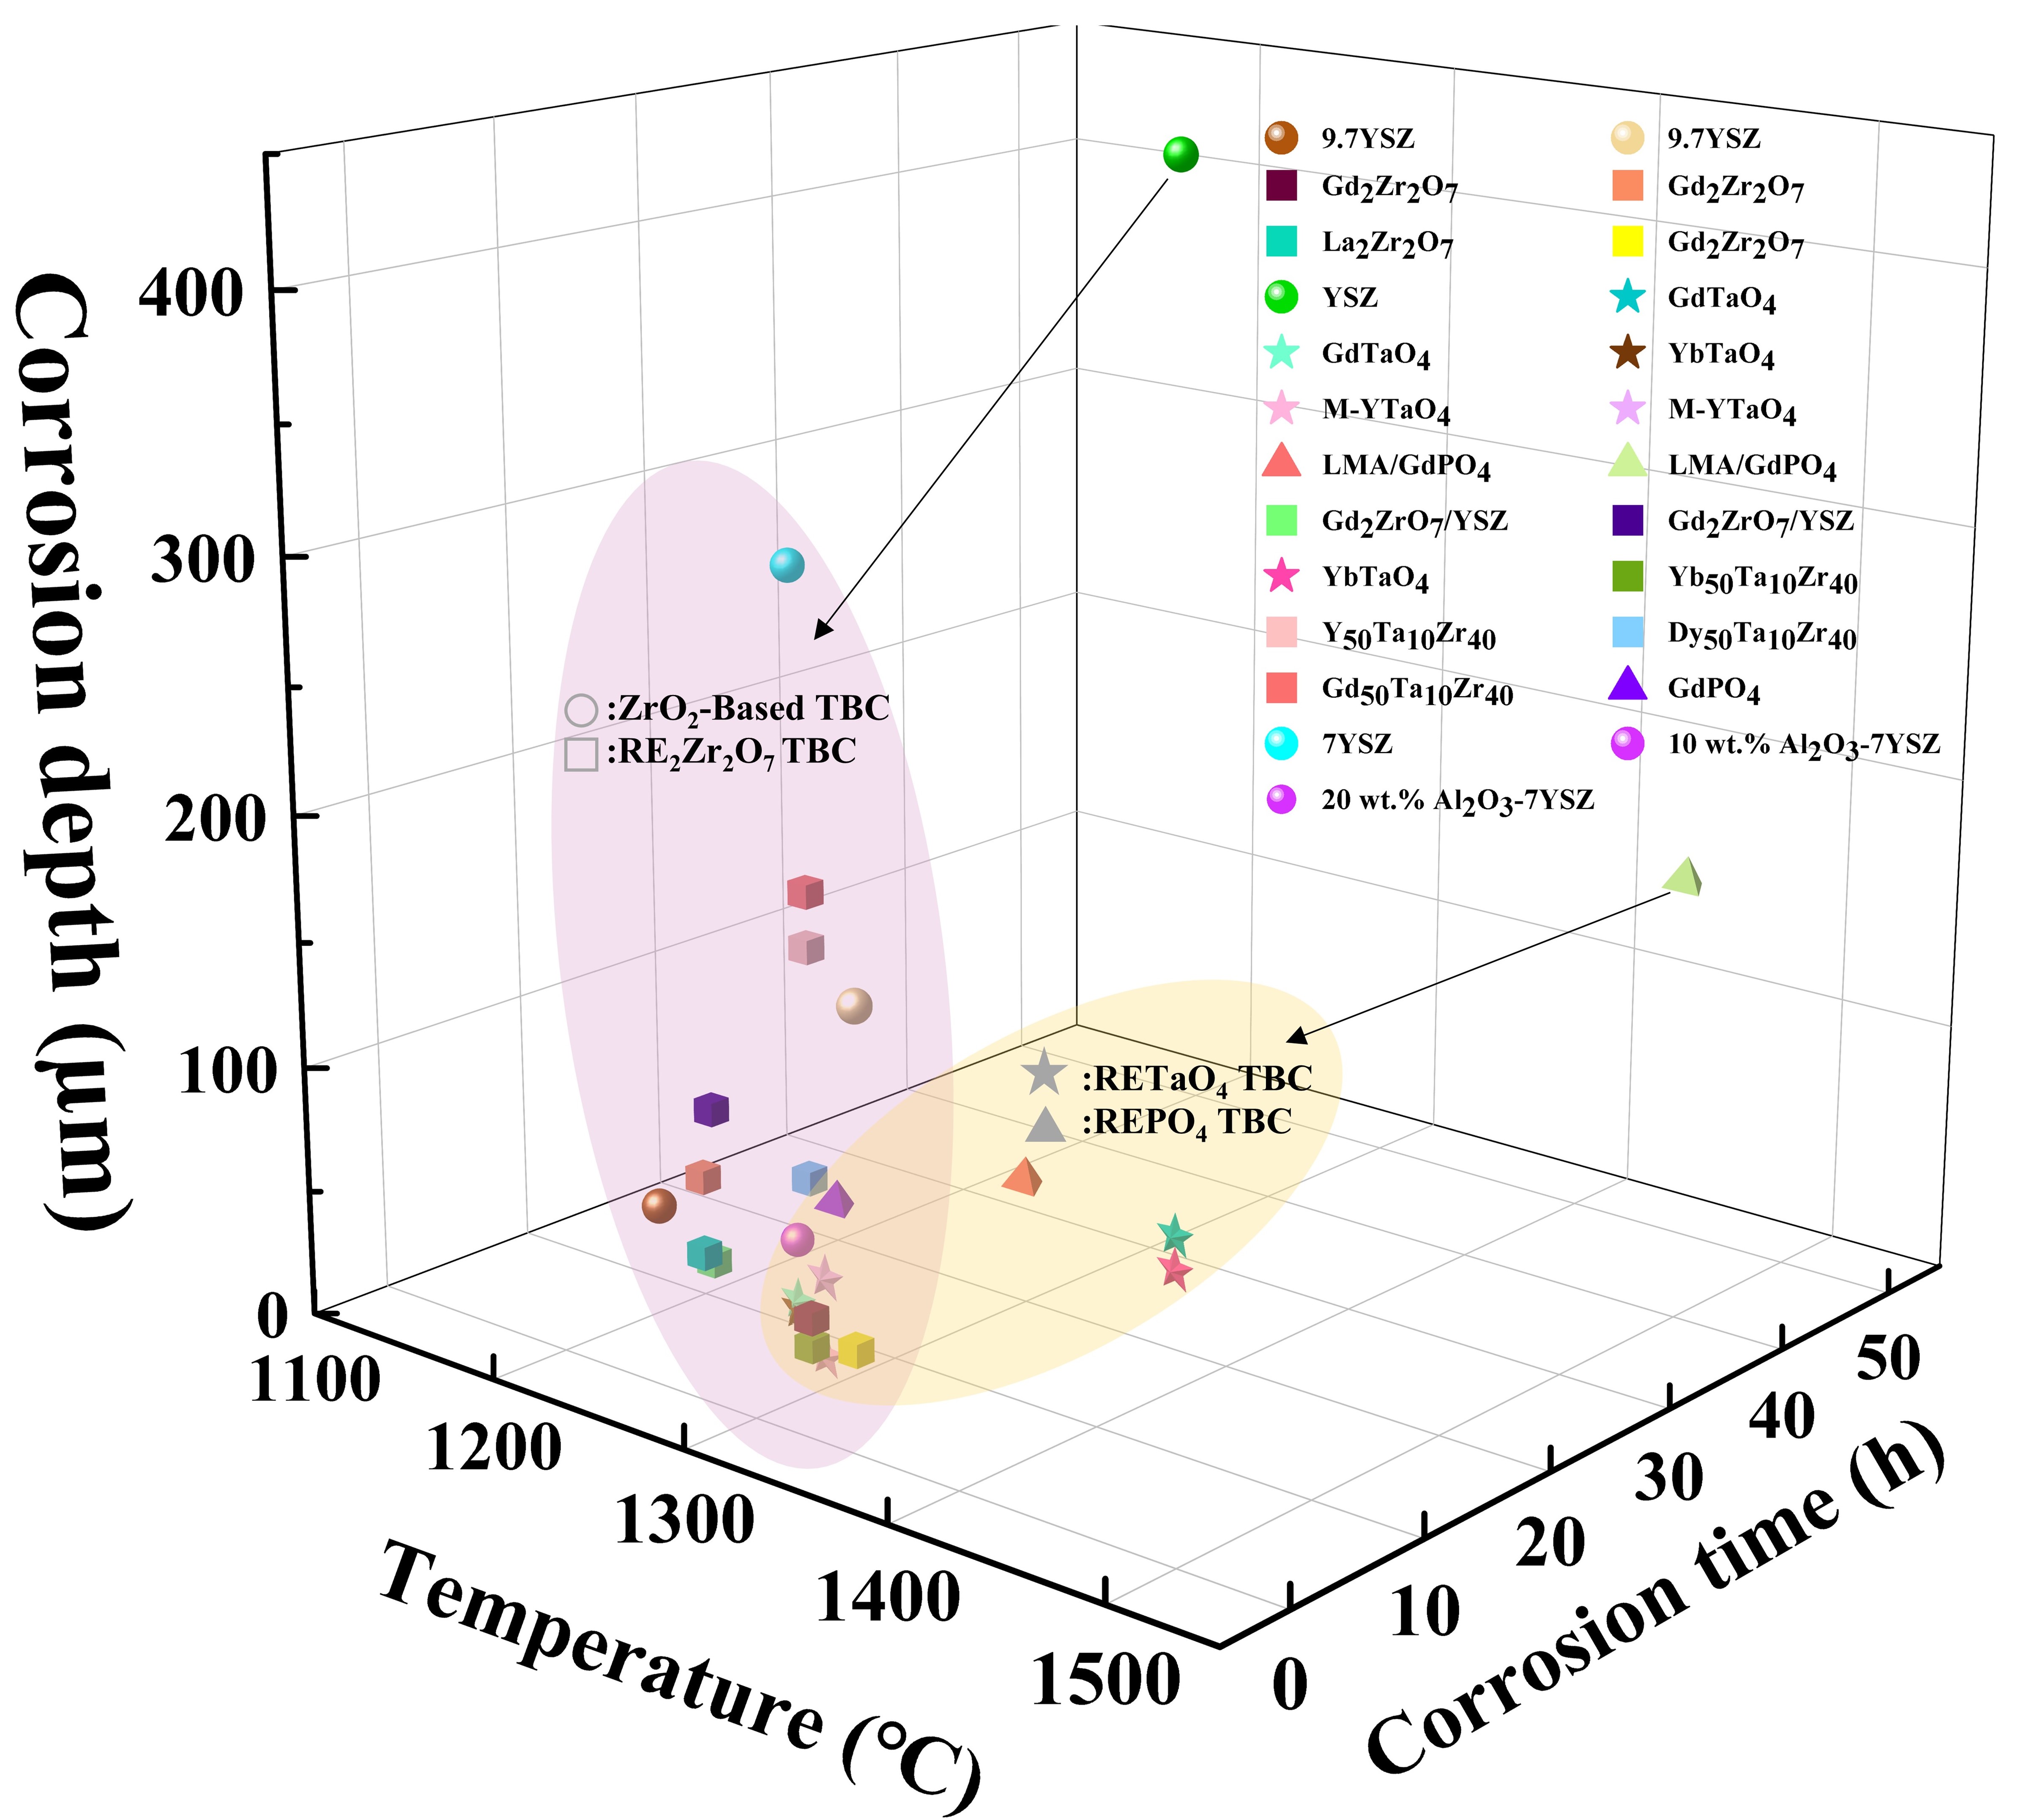
Fig. 26.
Comparison of CMAS corrosion resistance of TBC candidates [
60
,
61
,
64
,
70
,
71
,
73
,
80
⇓
-
82
,
84
,
87
⇓
⇓
⇓
-
91
].
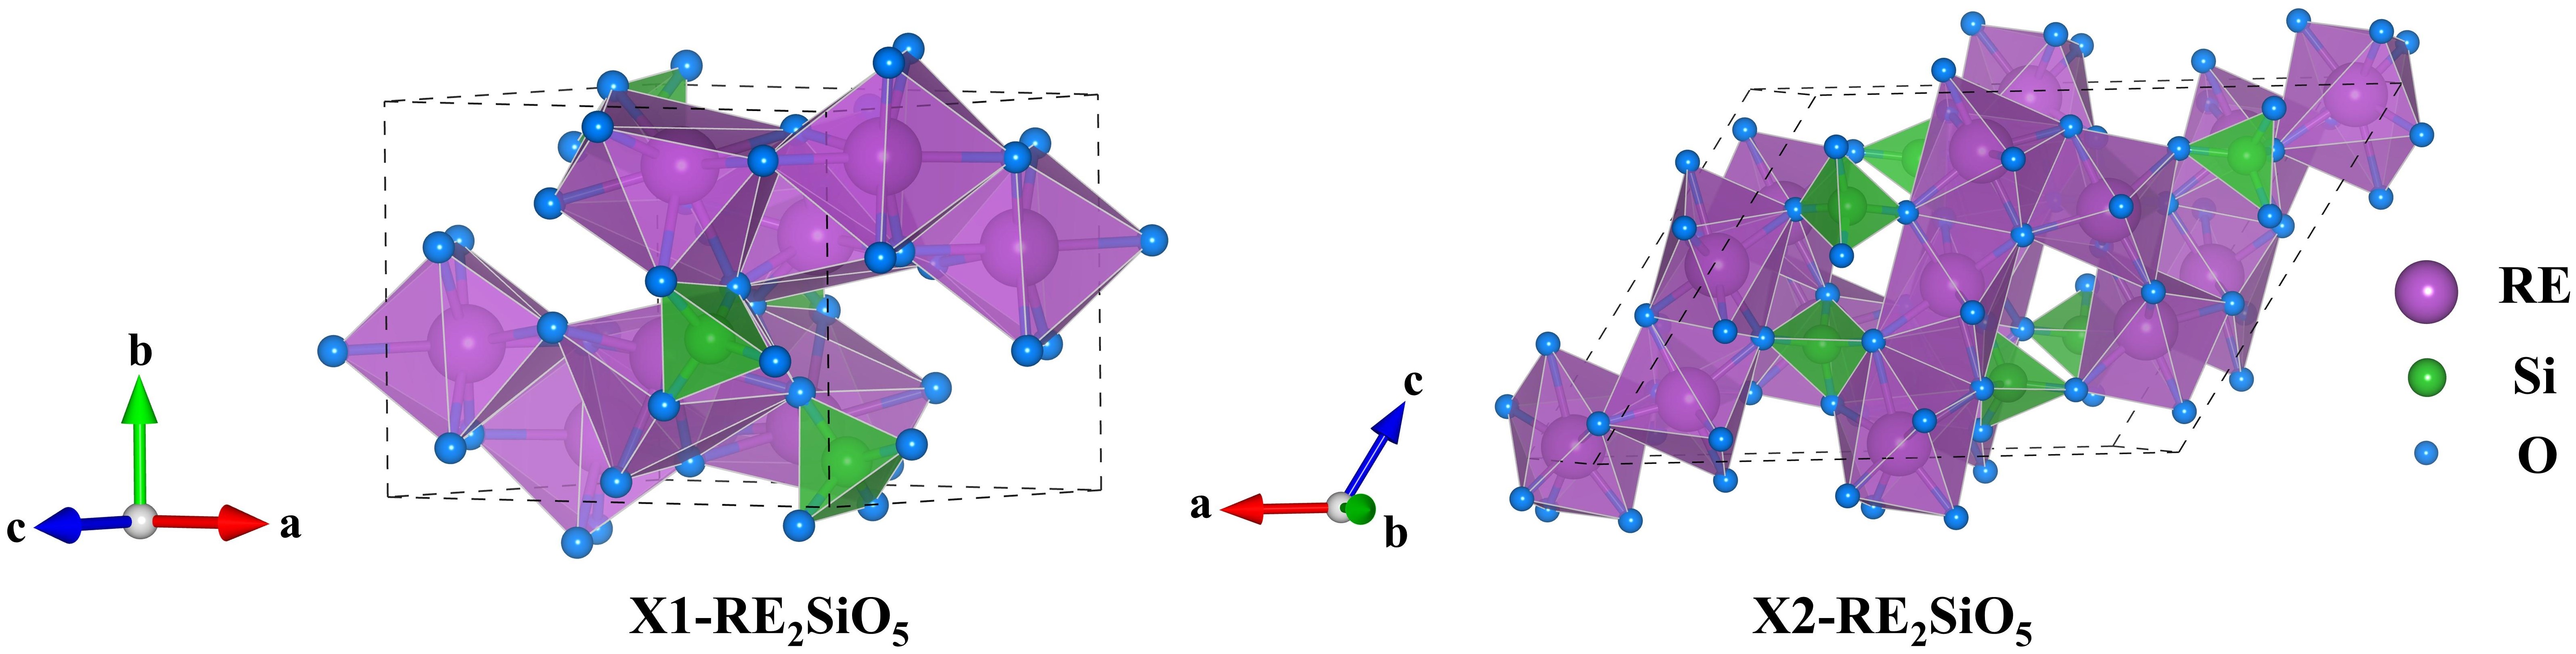
Fig. 27
The crystal structures of RE
2
SiO
5
.
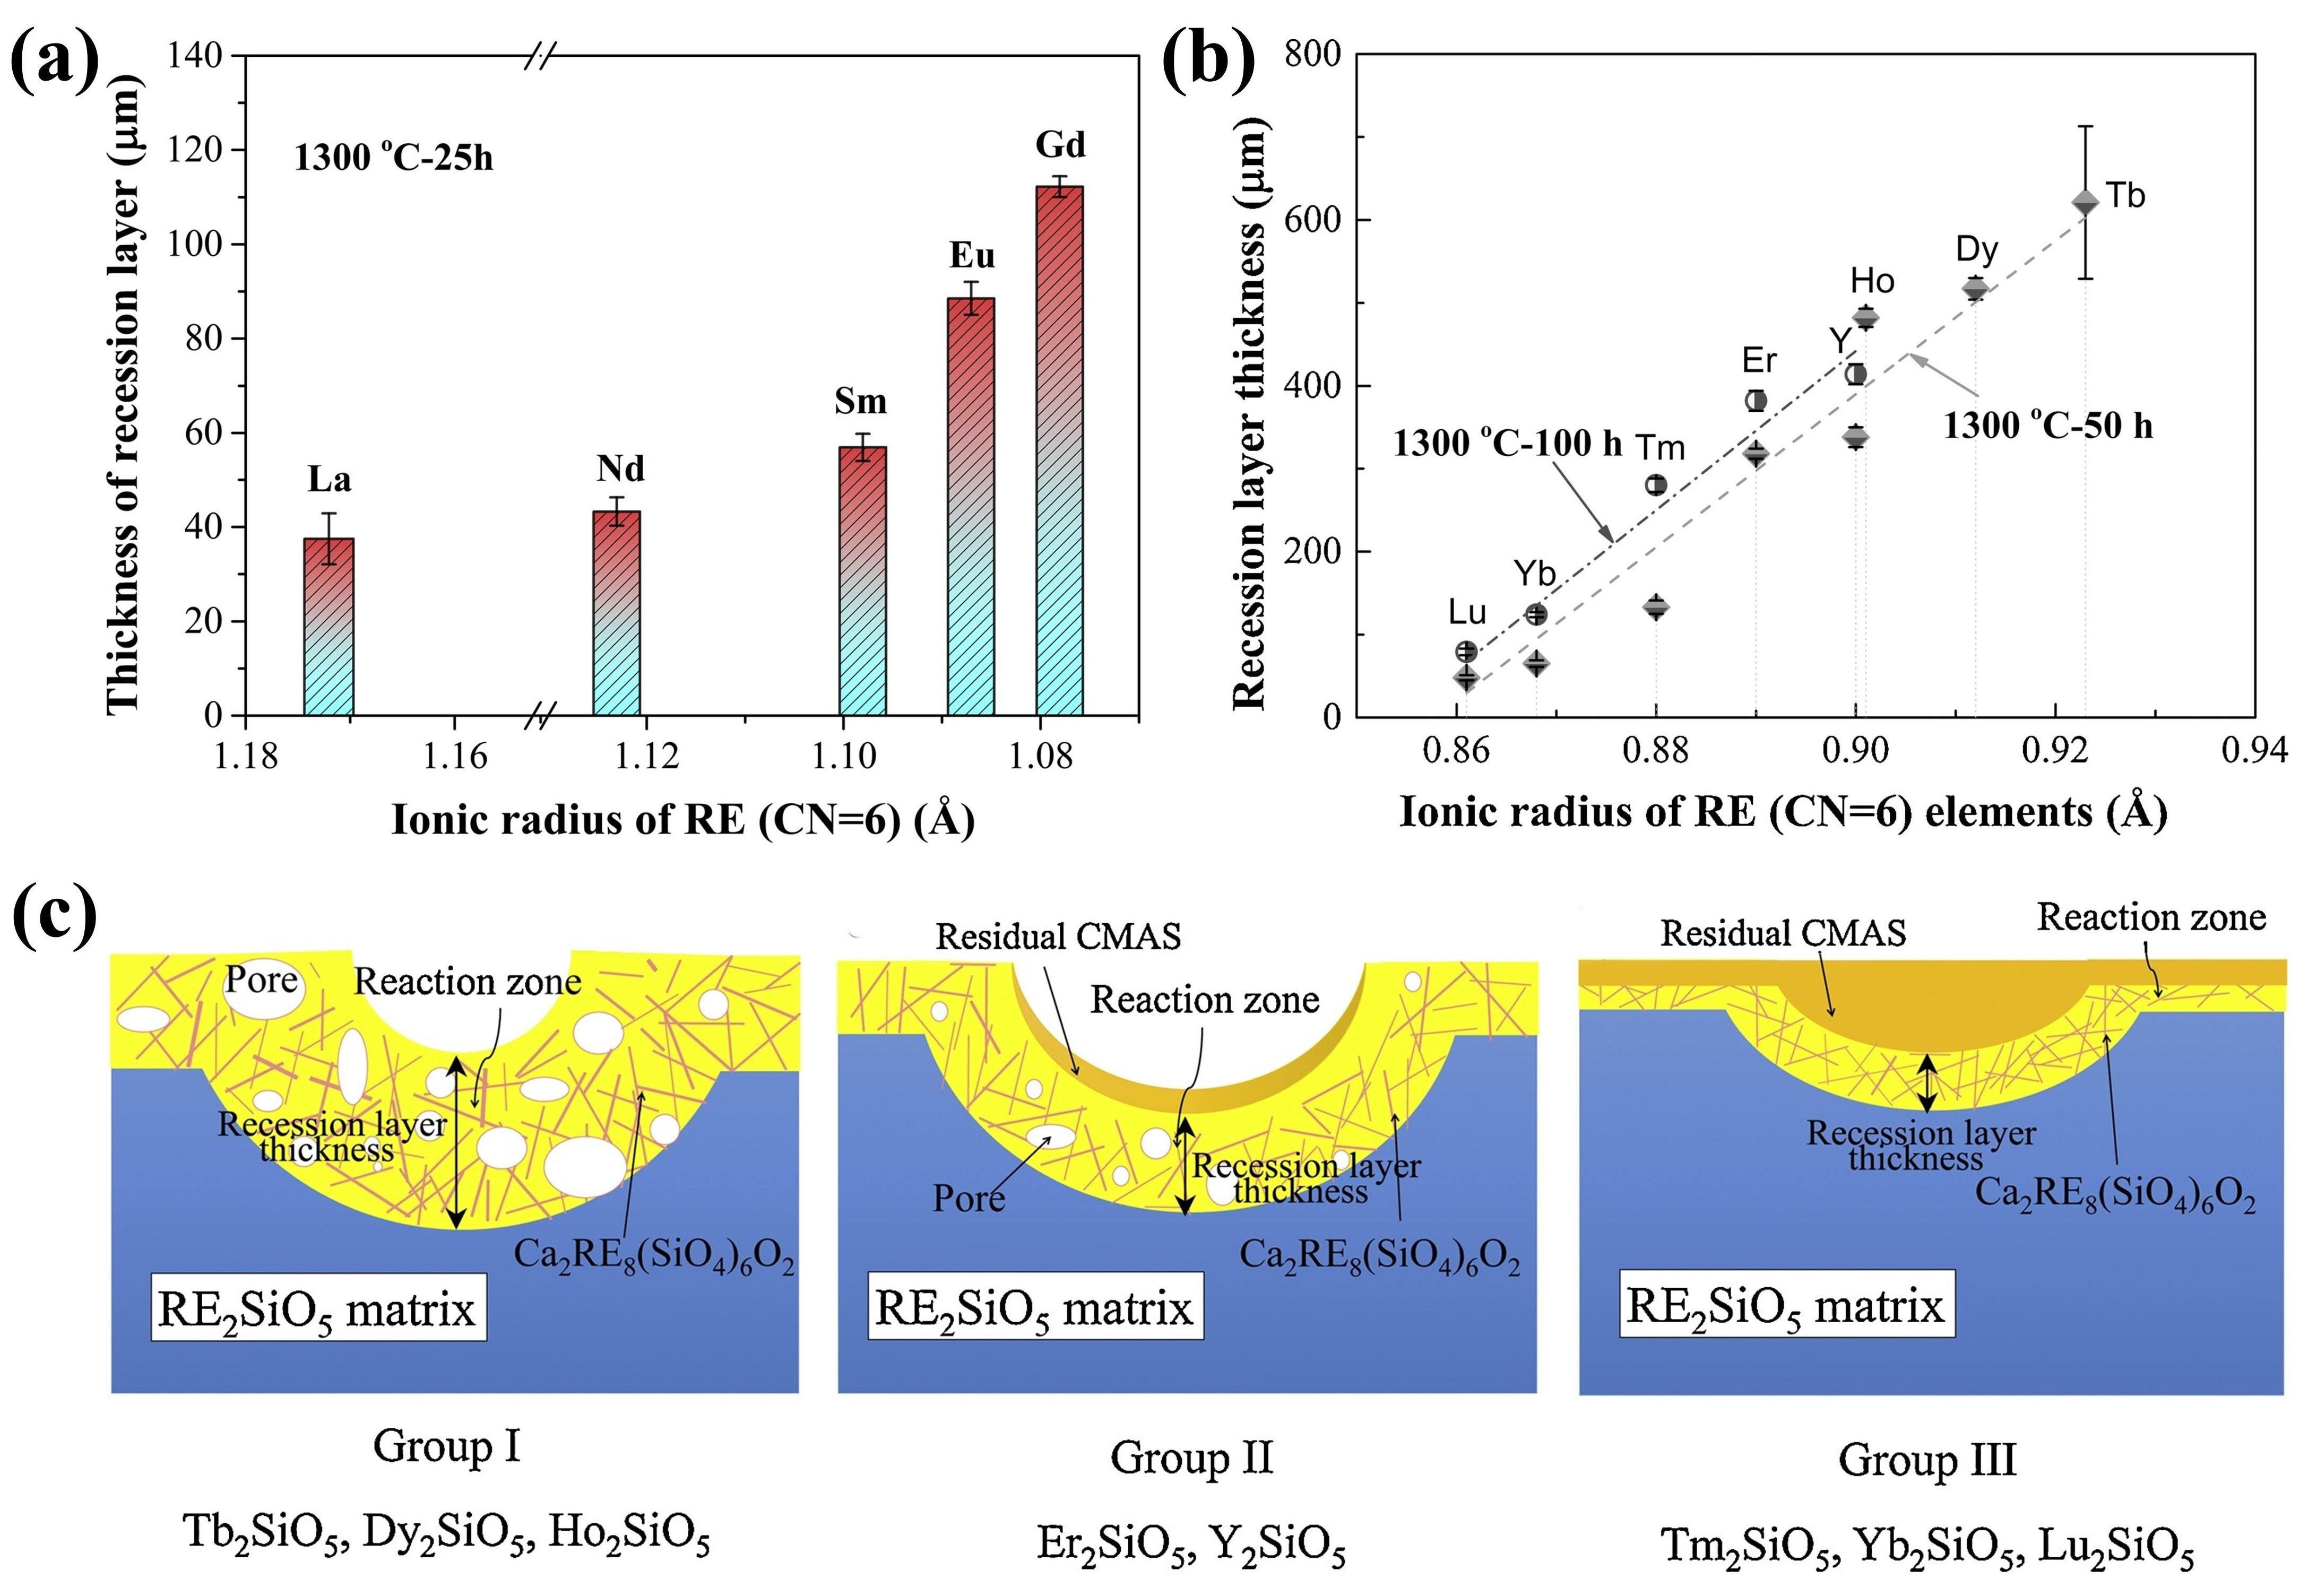
Fig. 28
(a) The recession layer thickness of X1-RE
2
SiO
5
(RE = La, Nd, Sm, Eu, Gd) after CMAS corrosion at 1300 ℃ for 25 h; (b) The recession layer thickness of X2- RE
2
SiO
5
(RE = Tb, Dy, Ho, Er, Y, Tm, Yb, and Lu) after CMAS corrosion at 1300 ℃for 50 h and 100 h; (c) Schematic diagram of CMAS corrosion of X2-RE
2
SiO
5
at 1300 ℃. Reproduced with permission from Ref. [
101
] for (a), © Elsevier 2019. Reproduced with permission from Ref. [
106
] for (b, c), © Elsevier 2019.
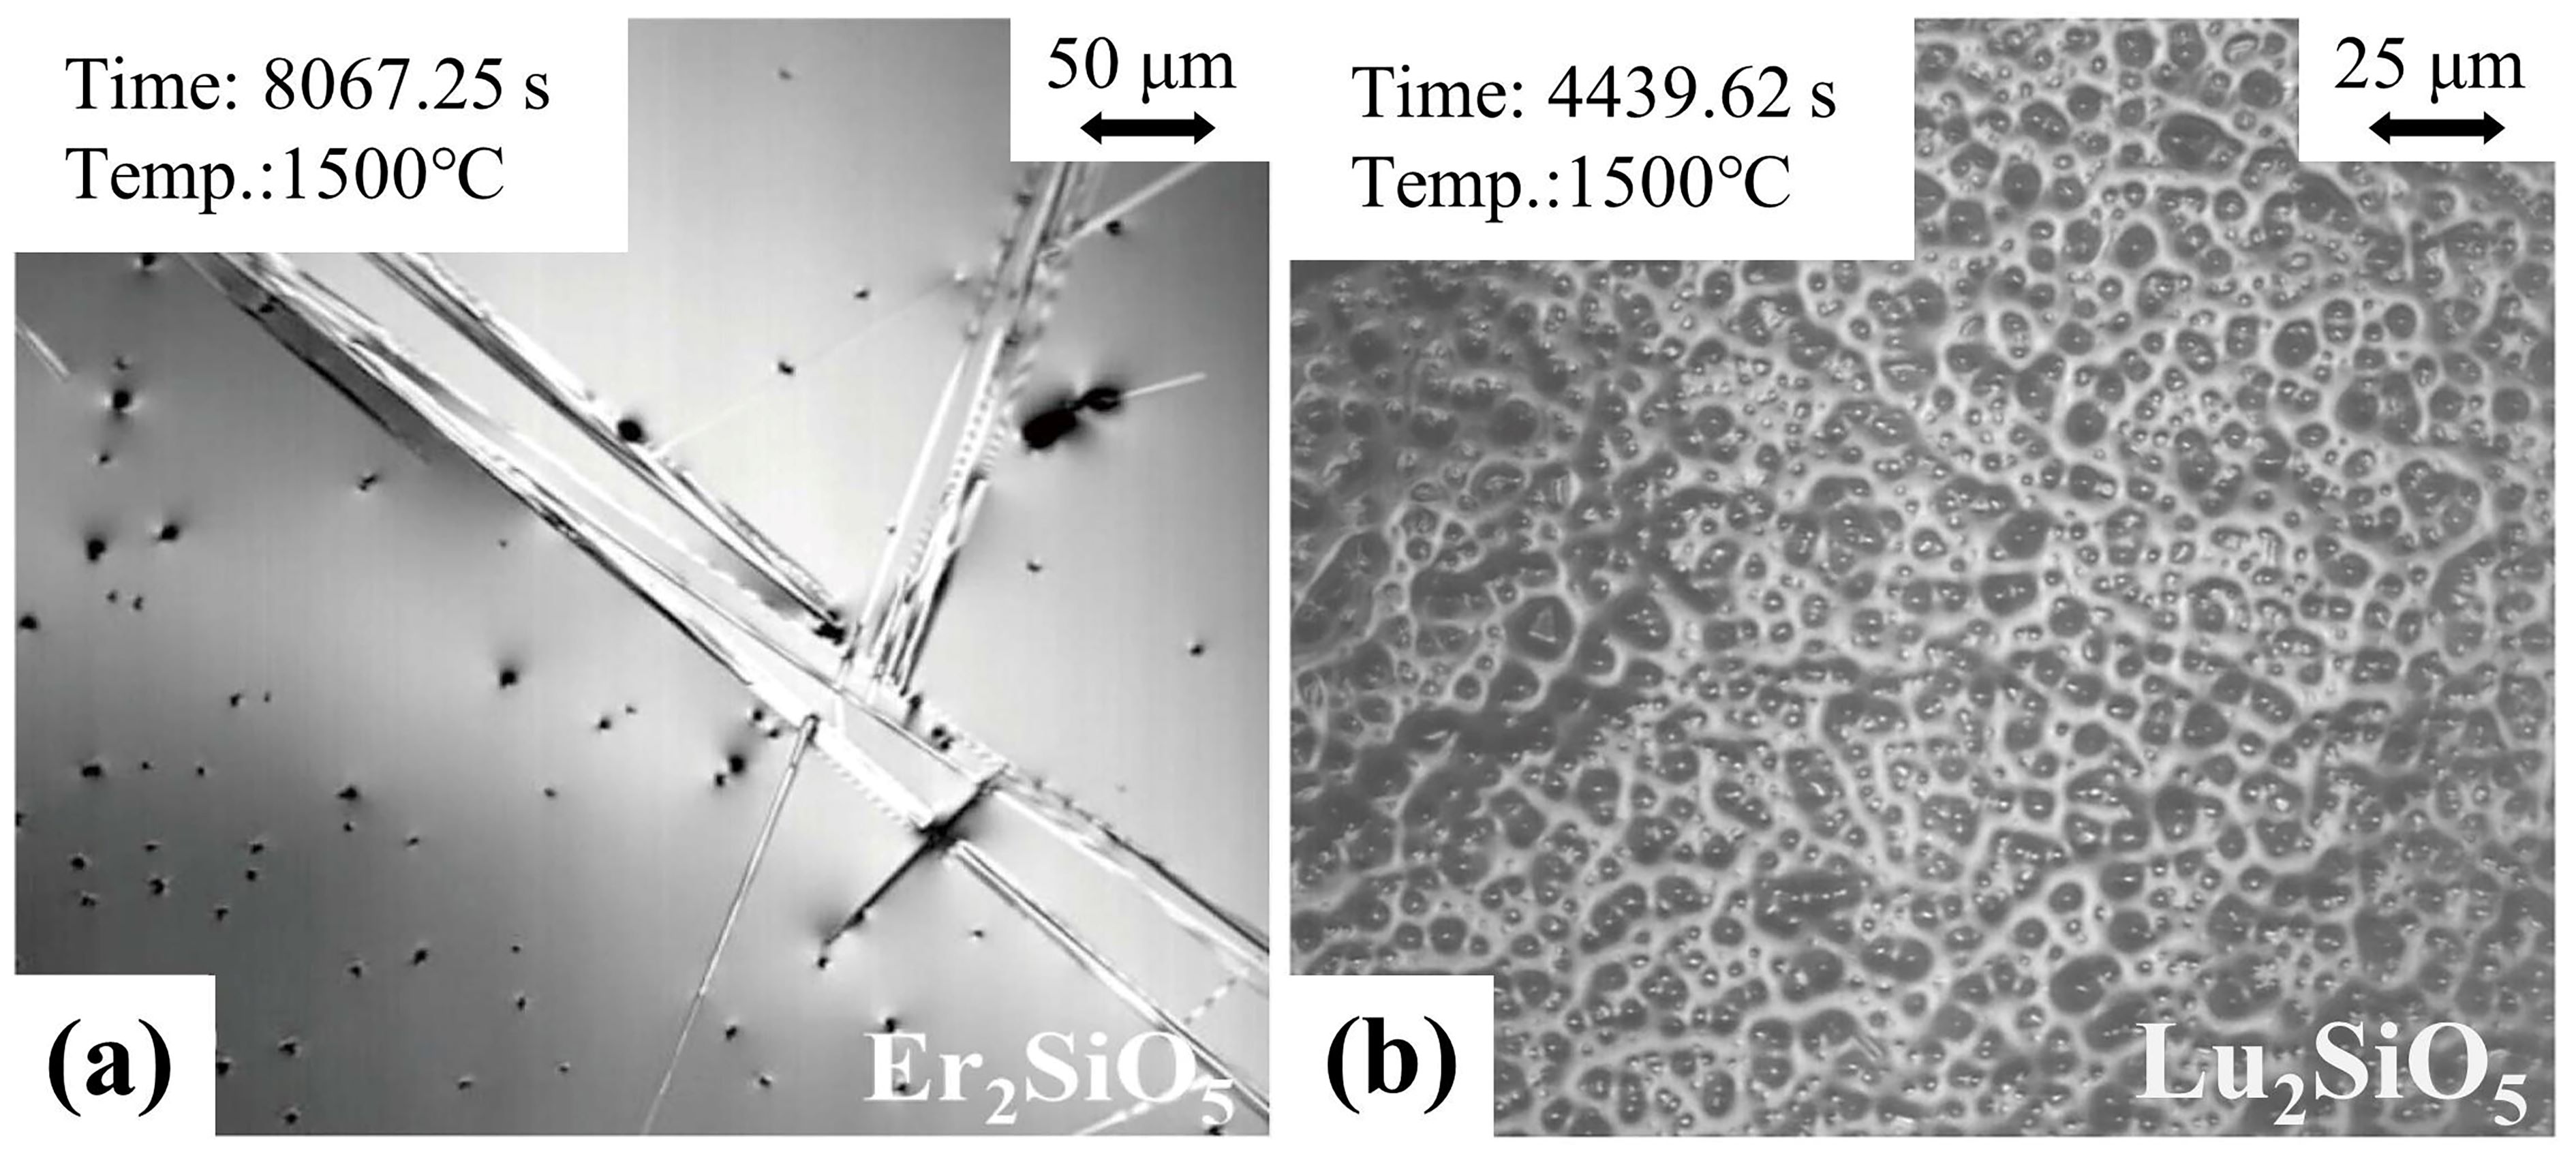
Fig. 29
The arrangement of Ca
2
RE
8
(SiO
4
)
6
O
2
apatite on the surfaces of (a) Er
2
SiO
5
and (b) Lu
2
SiO
5
at 1500 ℃. Reproduced with permission from Ref. [
110
] for (a), © The Author(s) 2023. Reproduced with permission from Ref. [
109
] for (b), © Elsevier 2024.
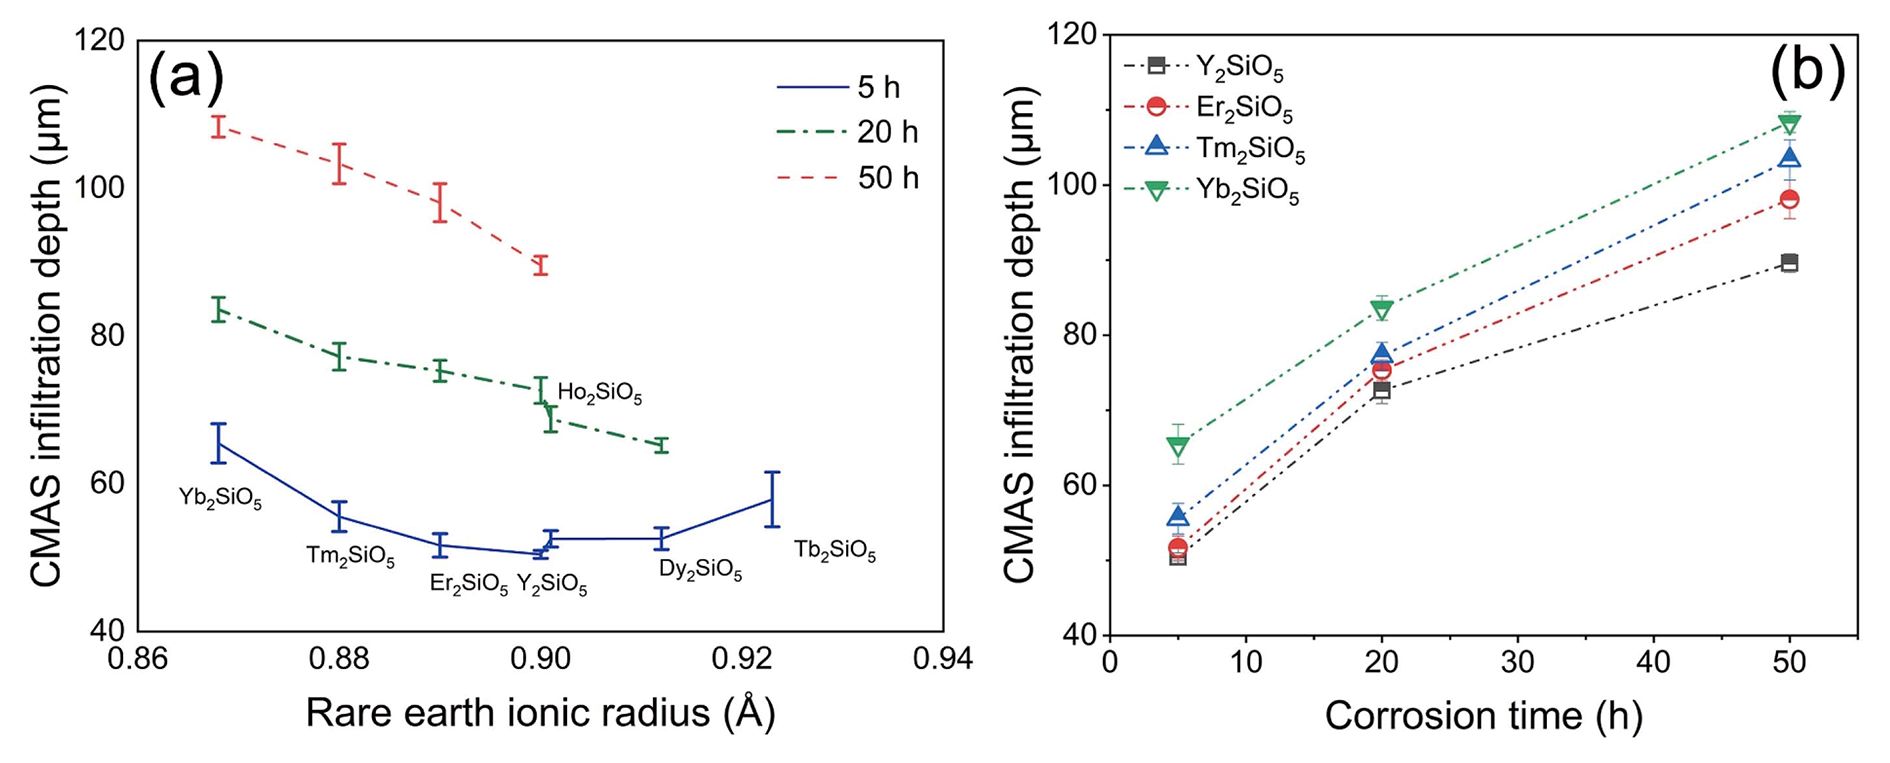
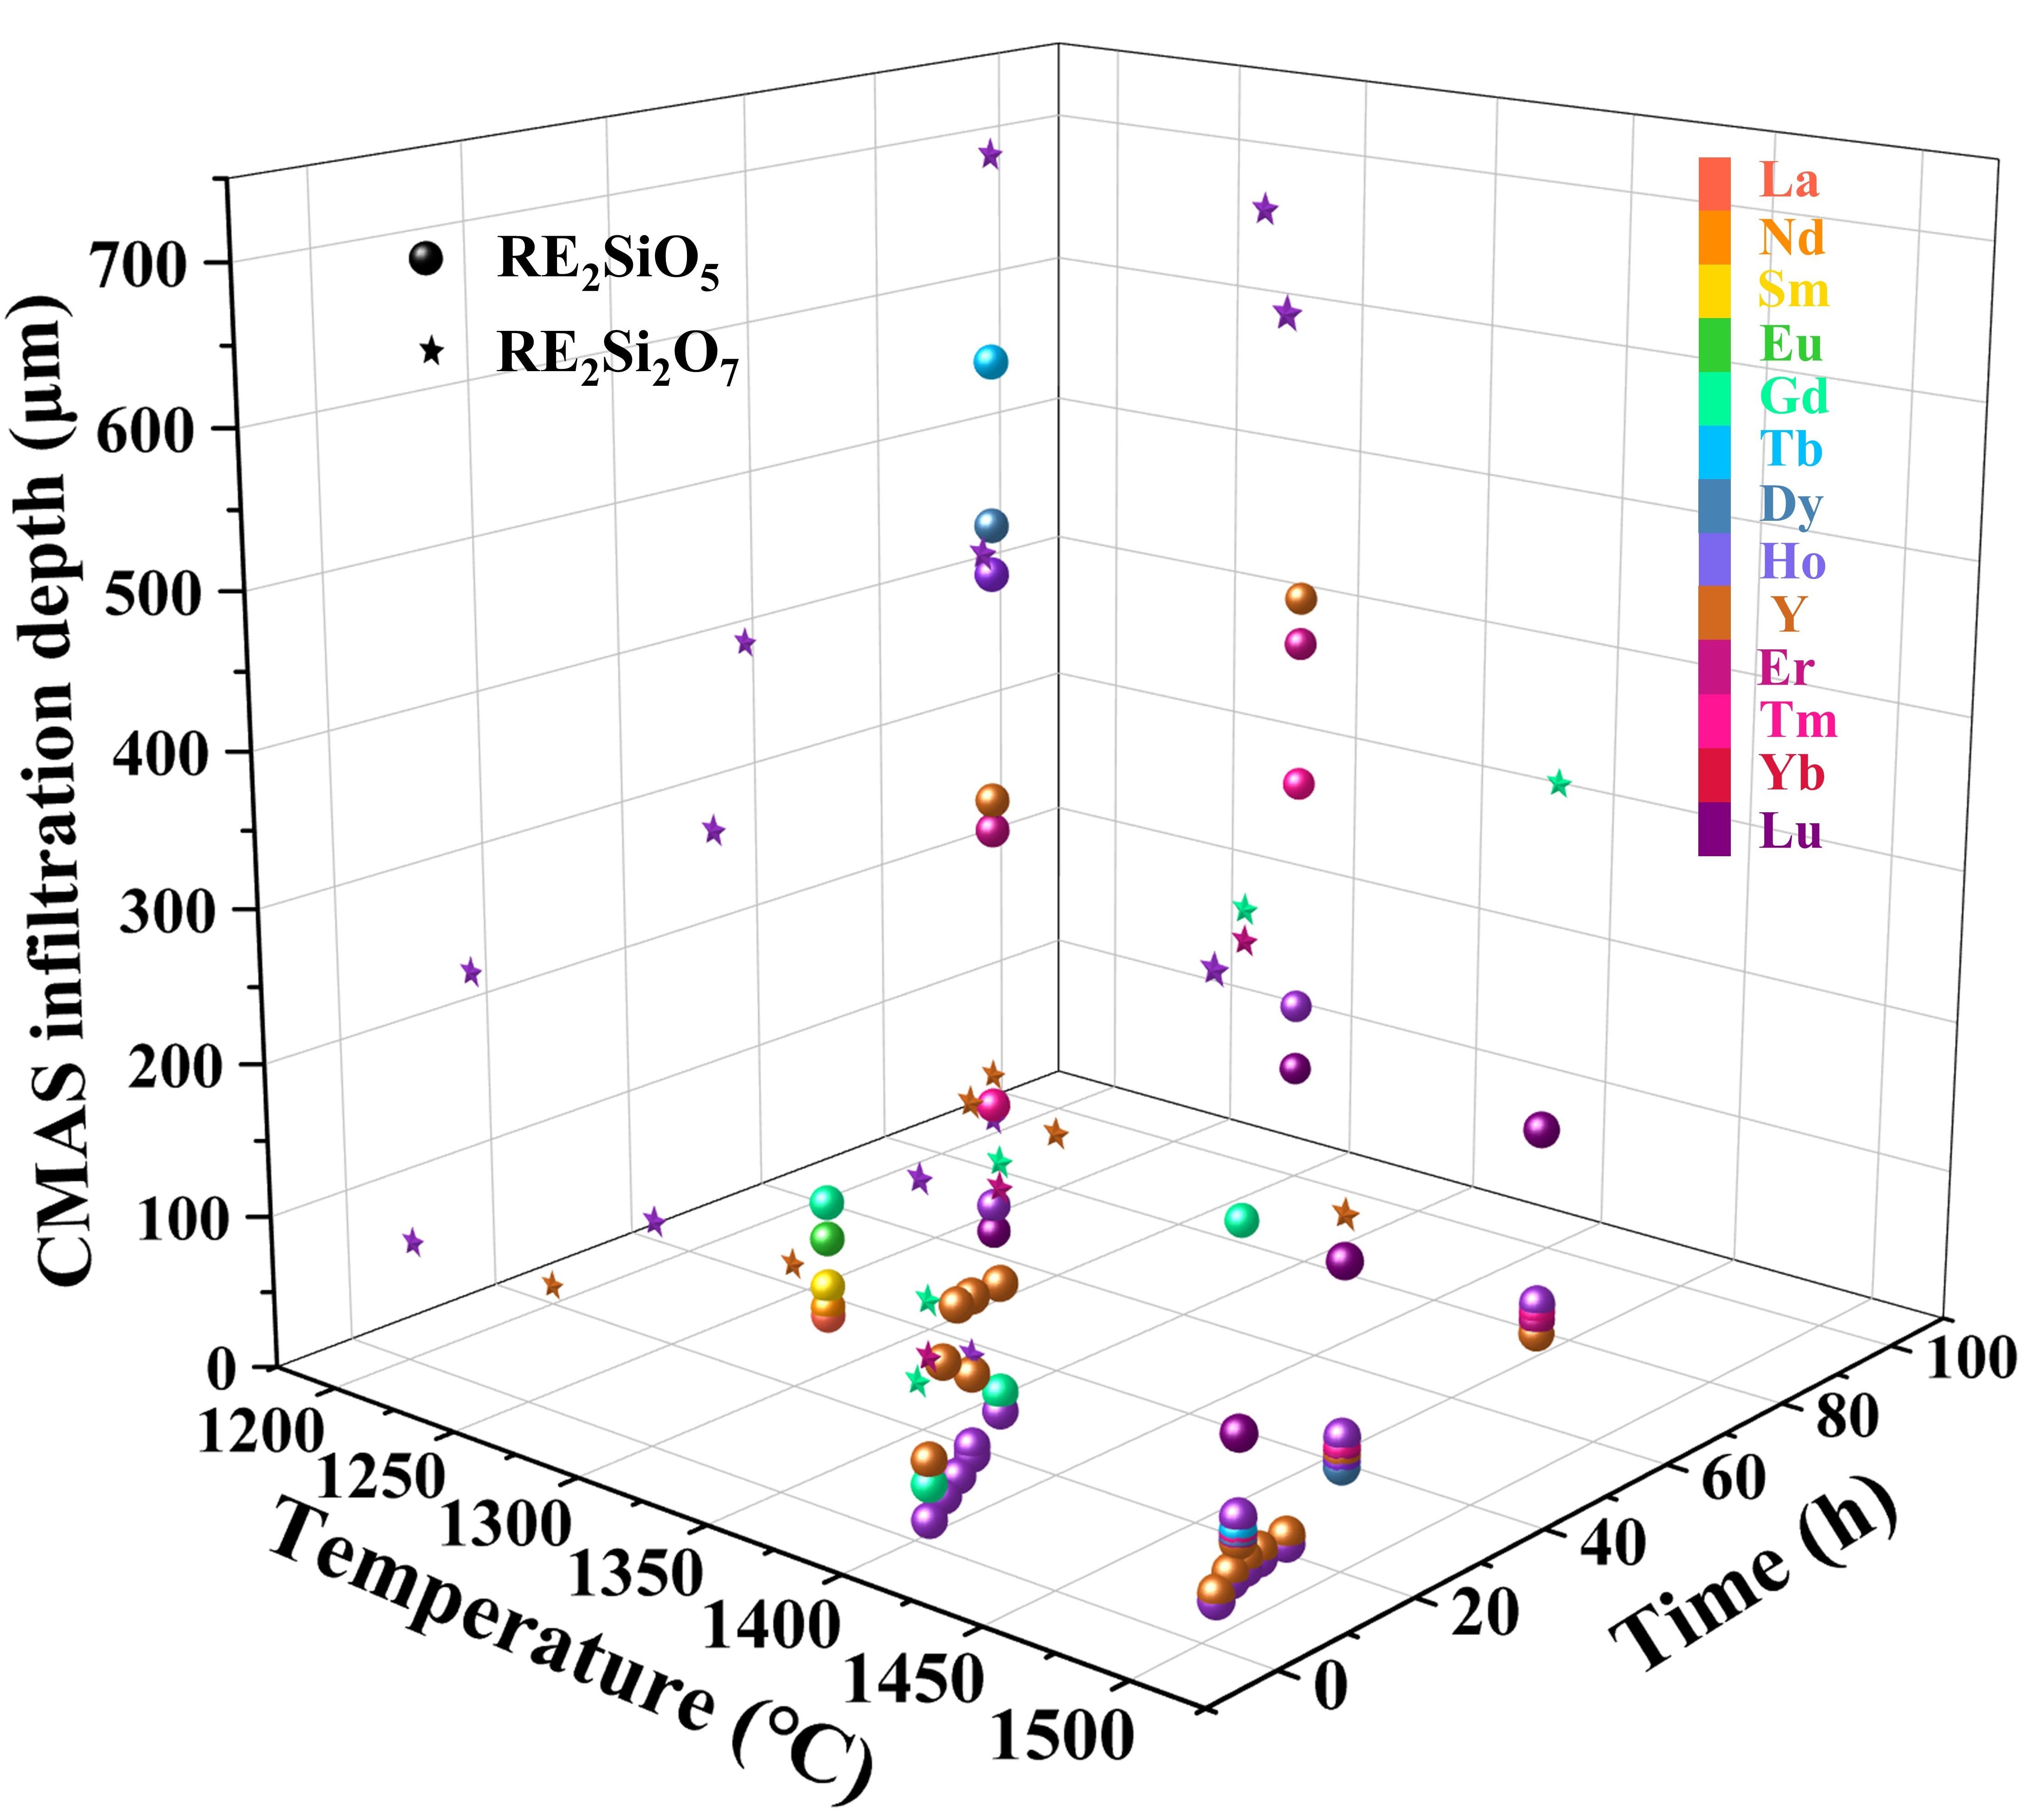
Fig. 30
The CMAS infiltration depth of X2-RE
2
SiO
5
(RE = Tb, Dy, Ho, Er, Y, Tm, and Yb) after CMAS corrosion at 1500 ℃. Reproduced with permission from Ref. [
110
], © The Author(s) 2023.
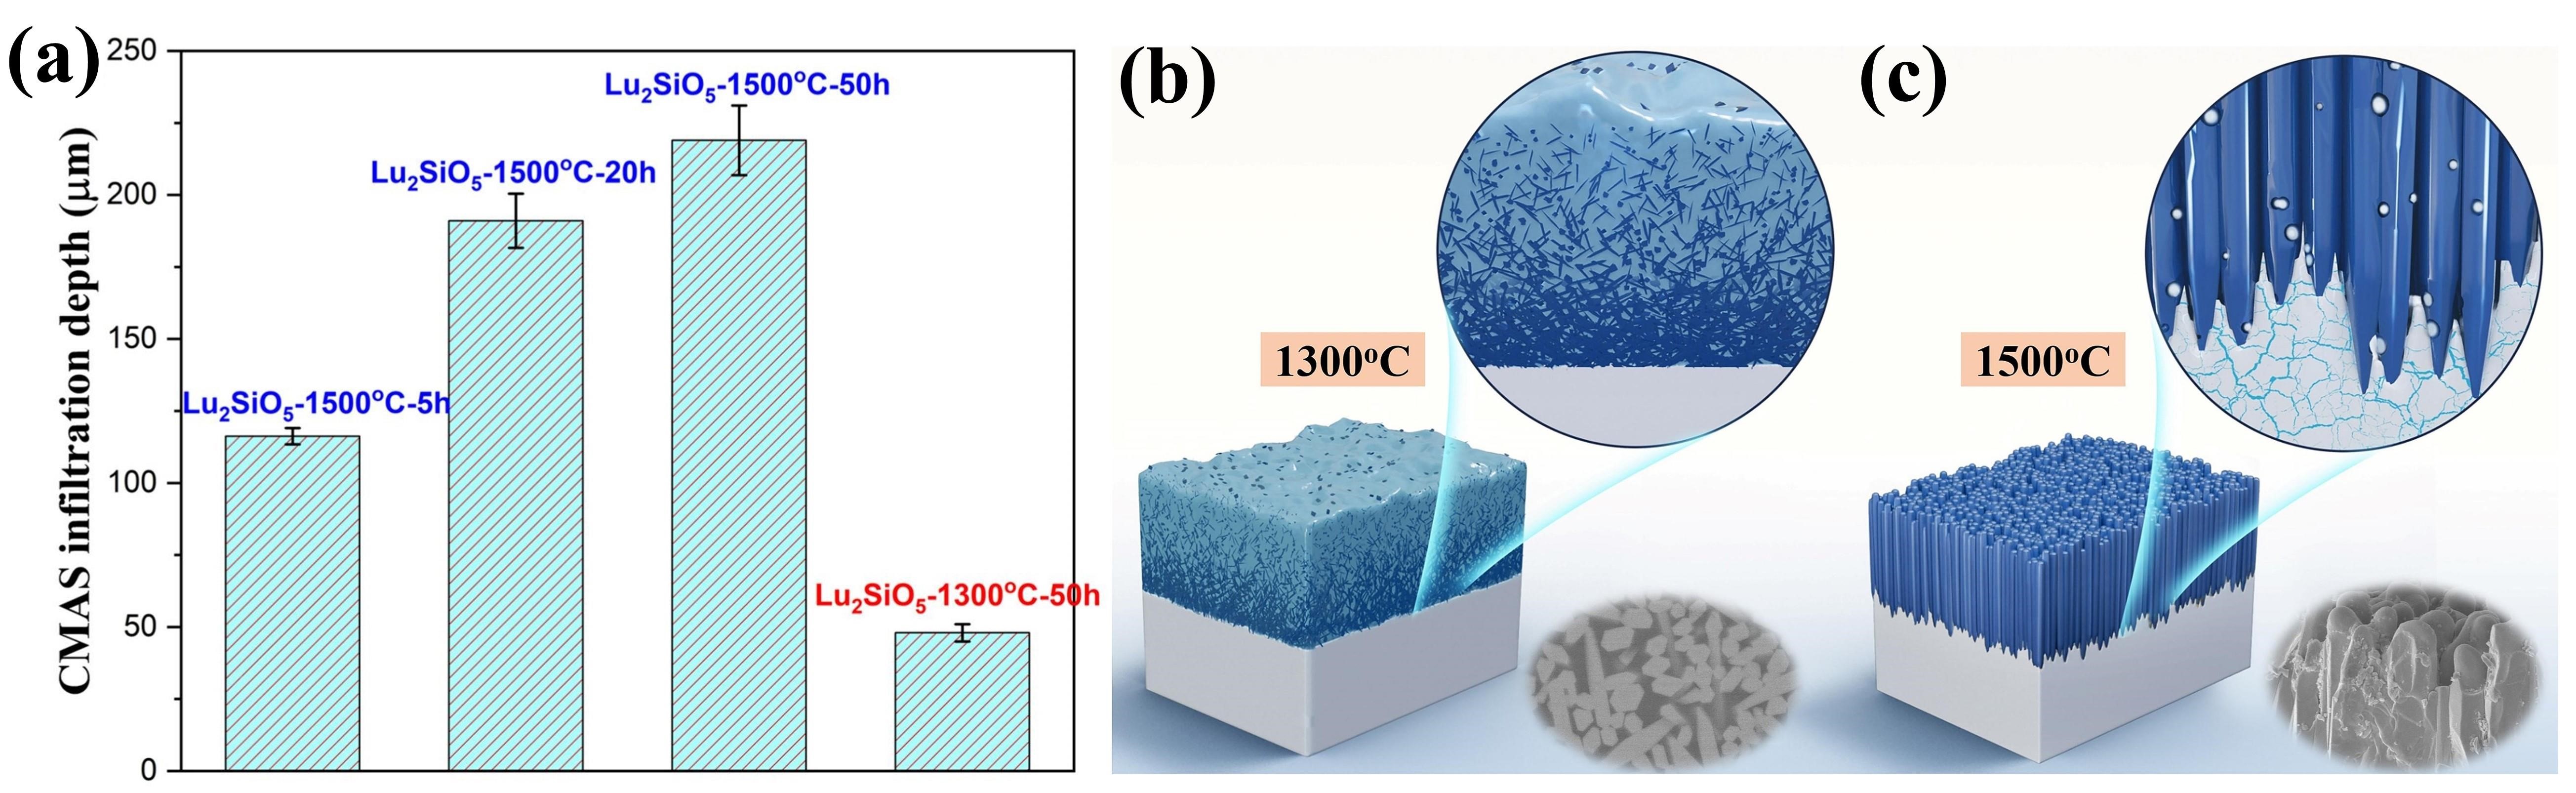
Fig. 31
(a) CMAS infiltration depth of Lu
2
SiO
5
at 1300 ℃ and 1500 ℃. Schematic diagram of the CMAS corrosion behavior of Lu
2
SiO
5
at (b) 1300 ℃ and (c) 1500 ℃. Reproduced with permission from Ref. [
109
], © Elsevier 2024.
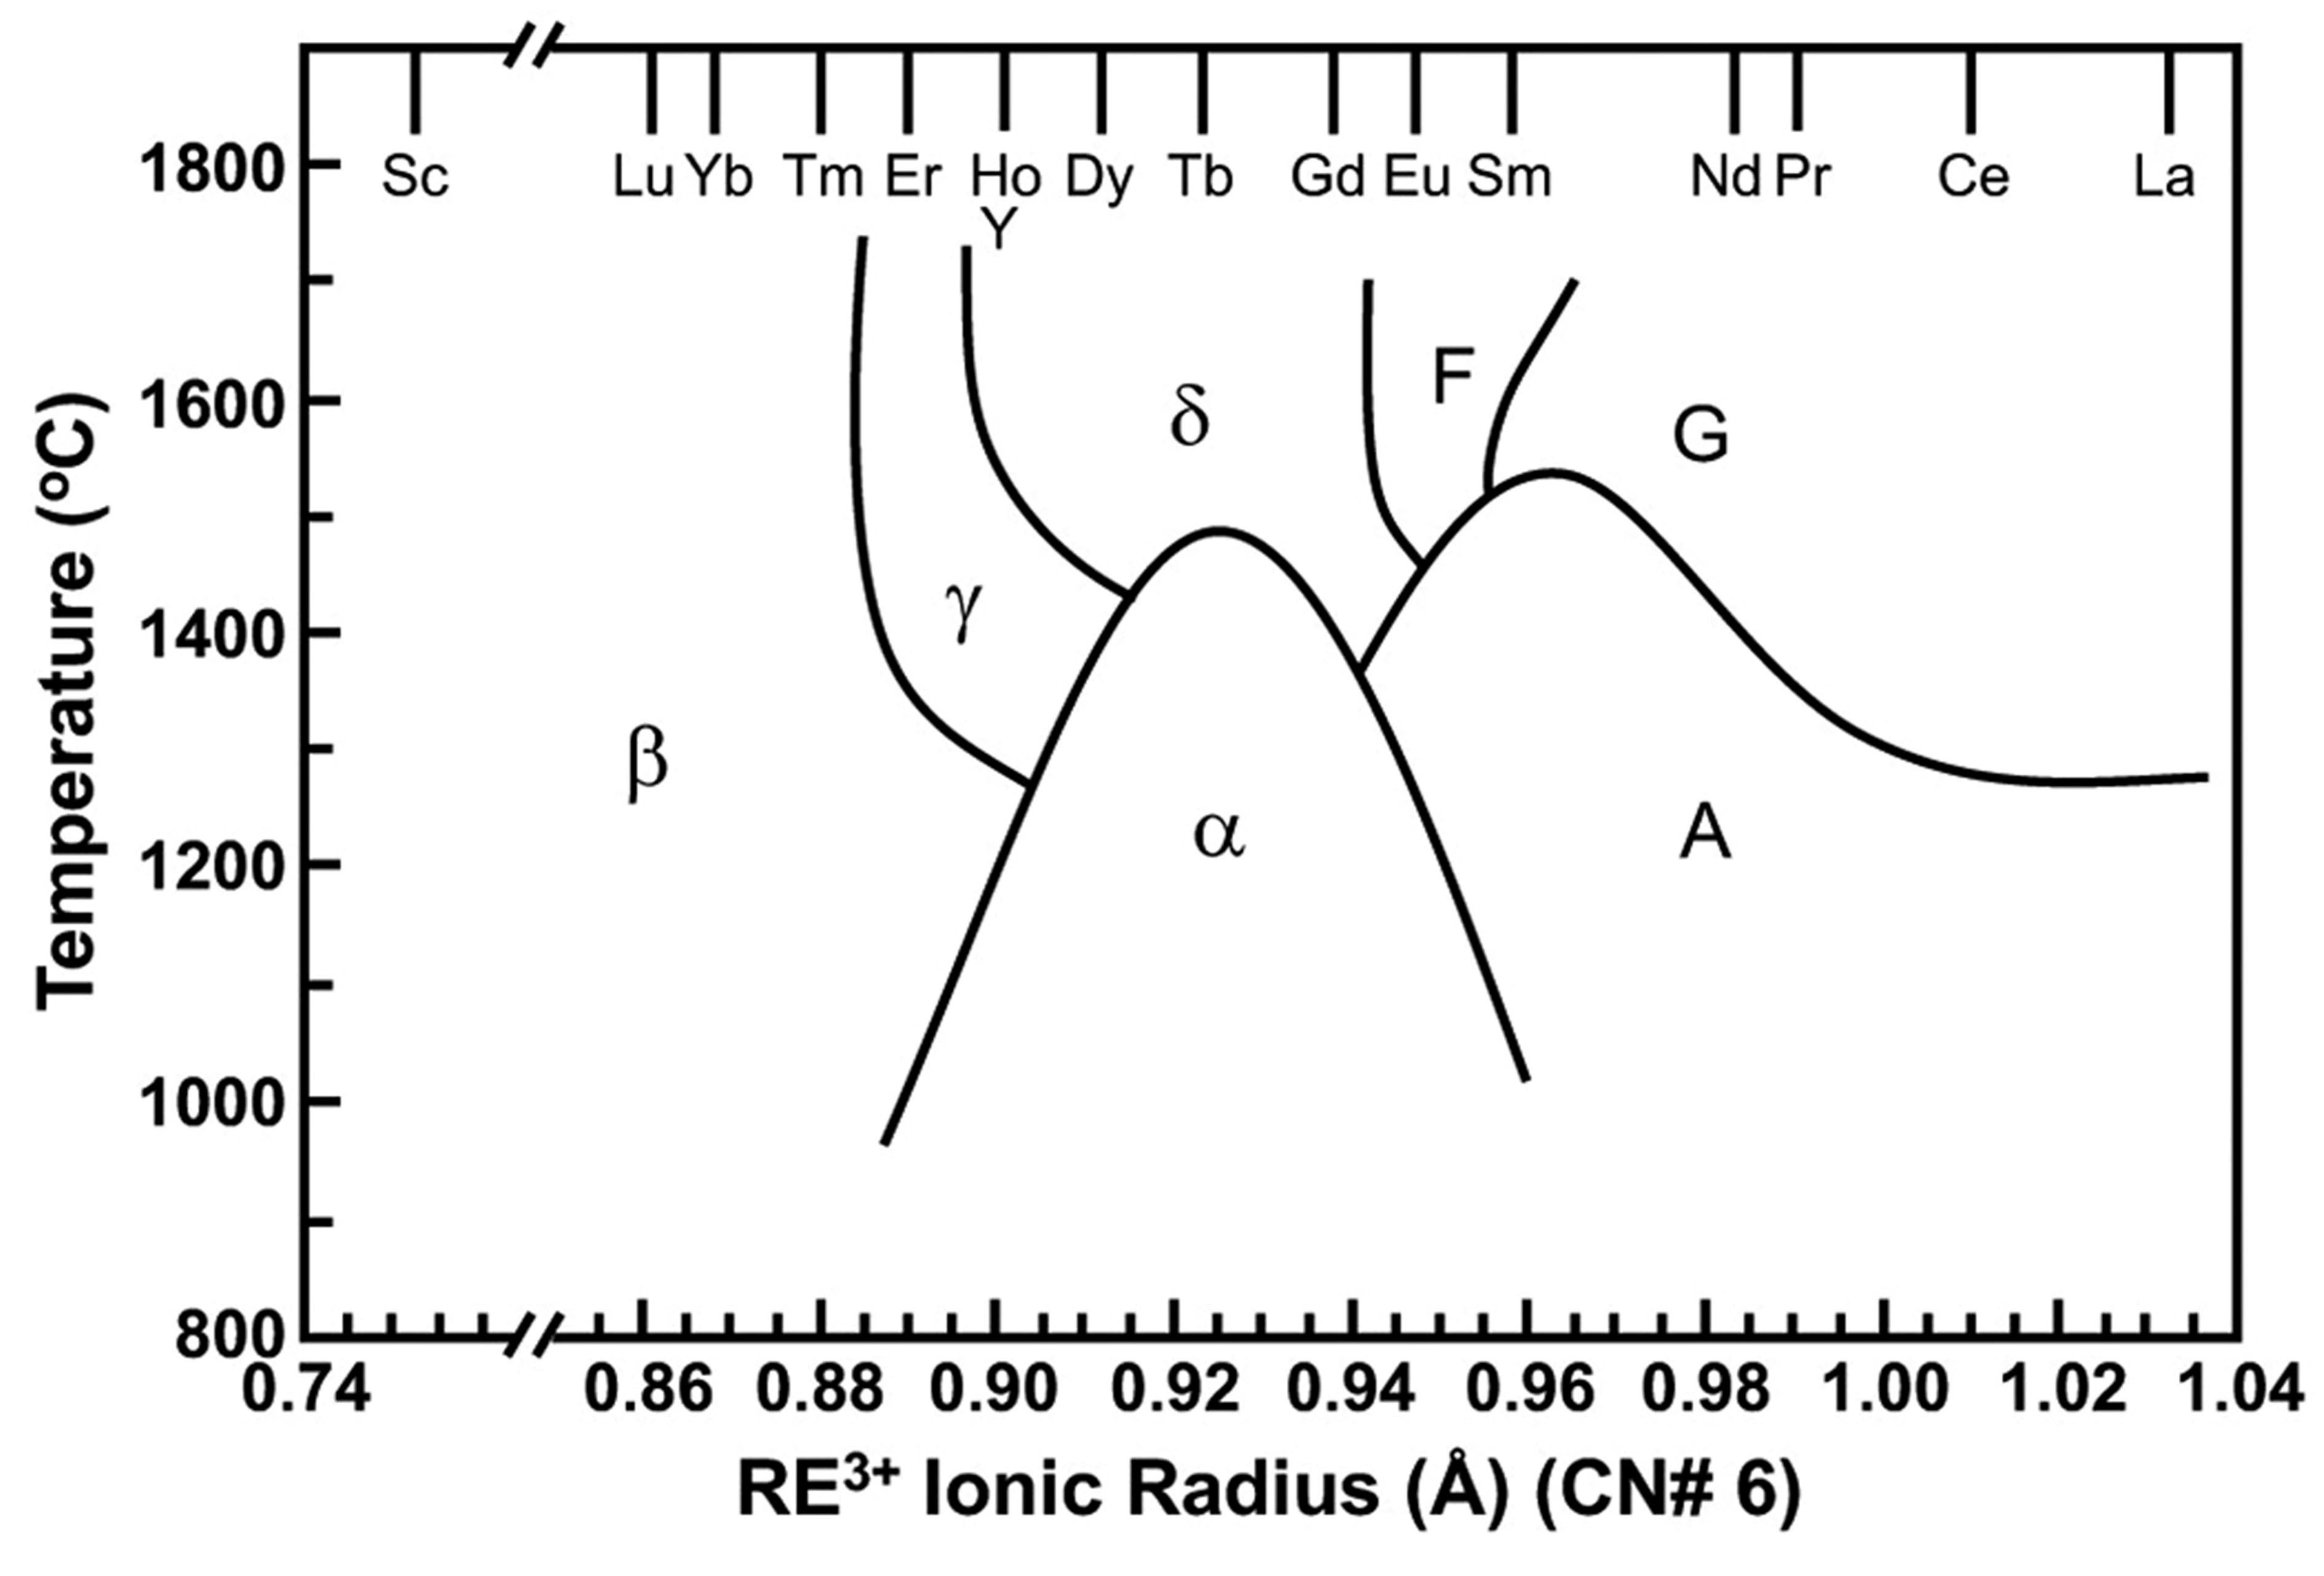
Fig. 32
The relationship between the polymorphism of RE
2
Si
2
O
7
and the temperature as well as the RE ionic radius. Reproduced with permission from Ref. [
100
], © Elsevier 2018.
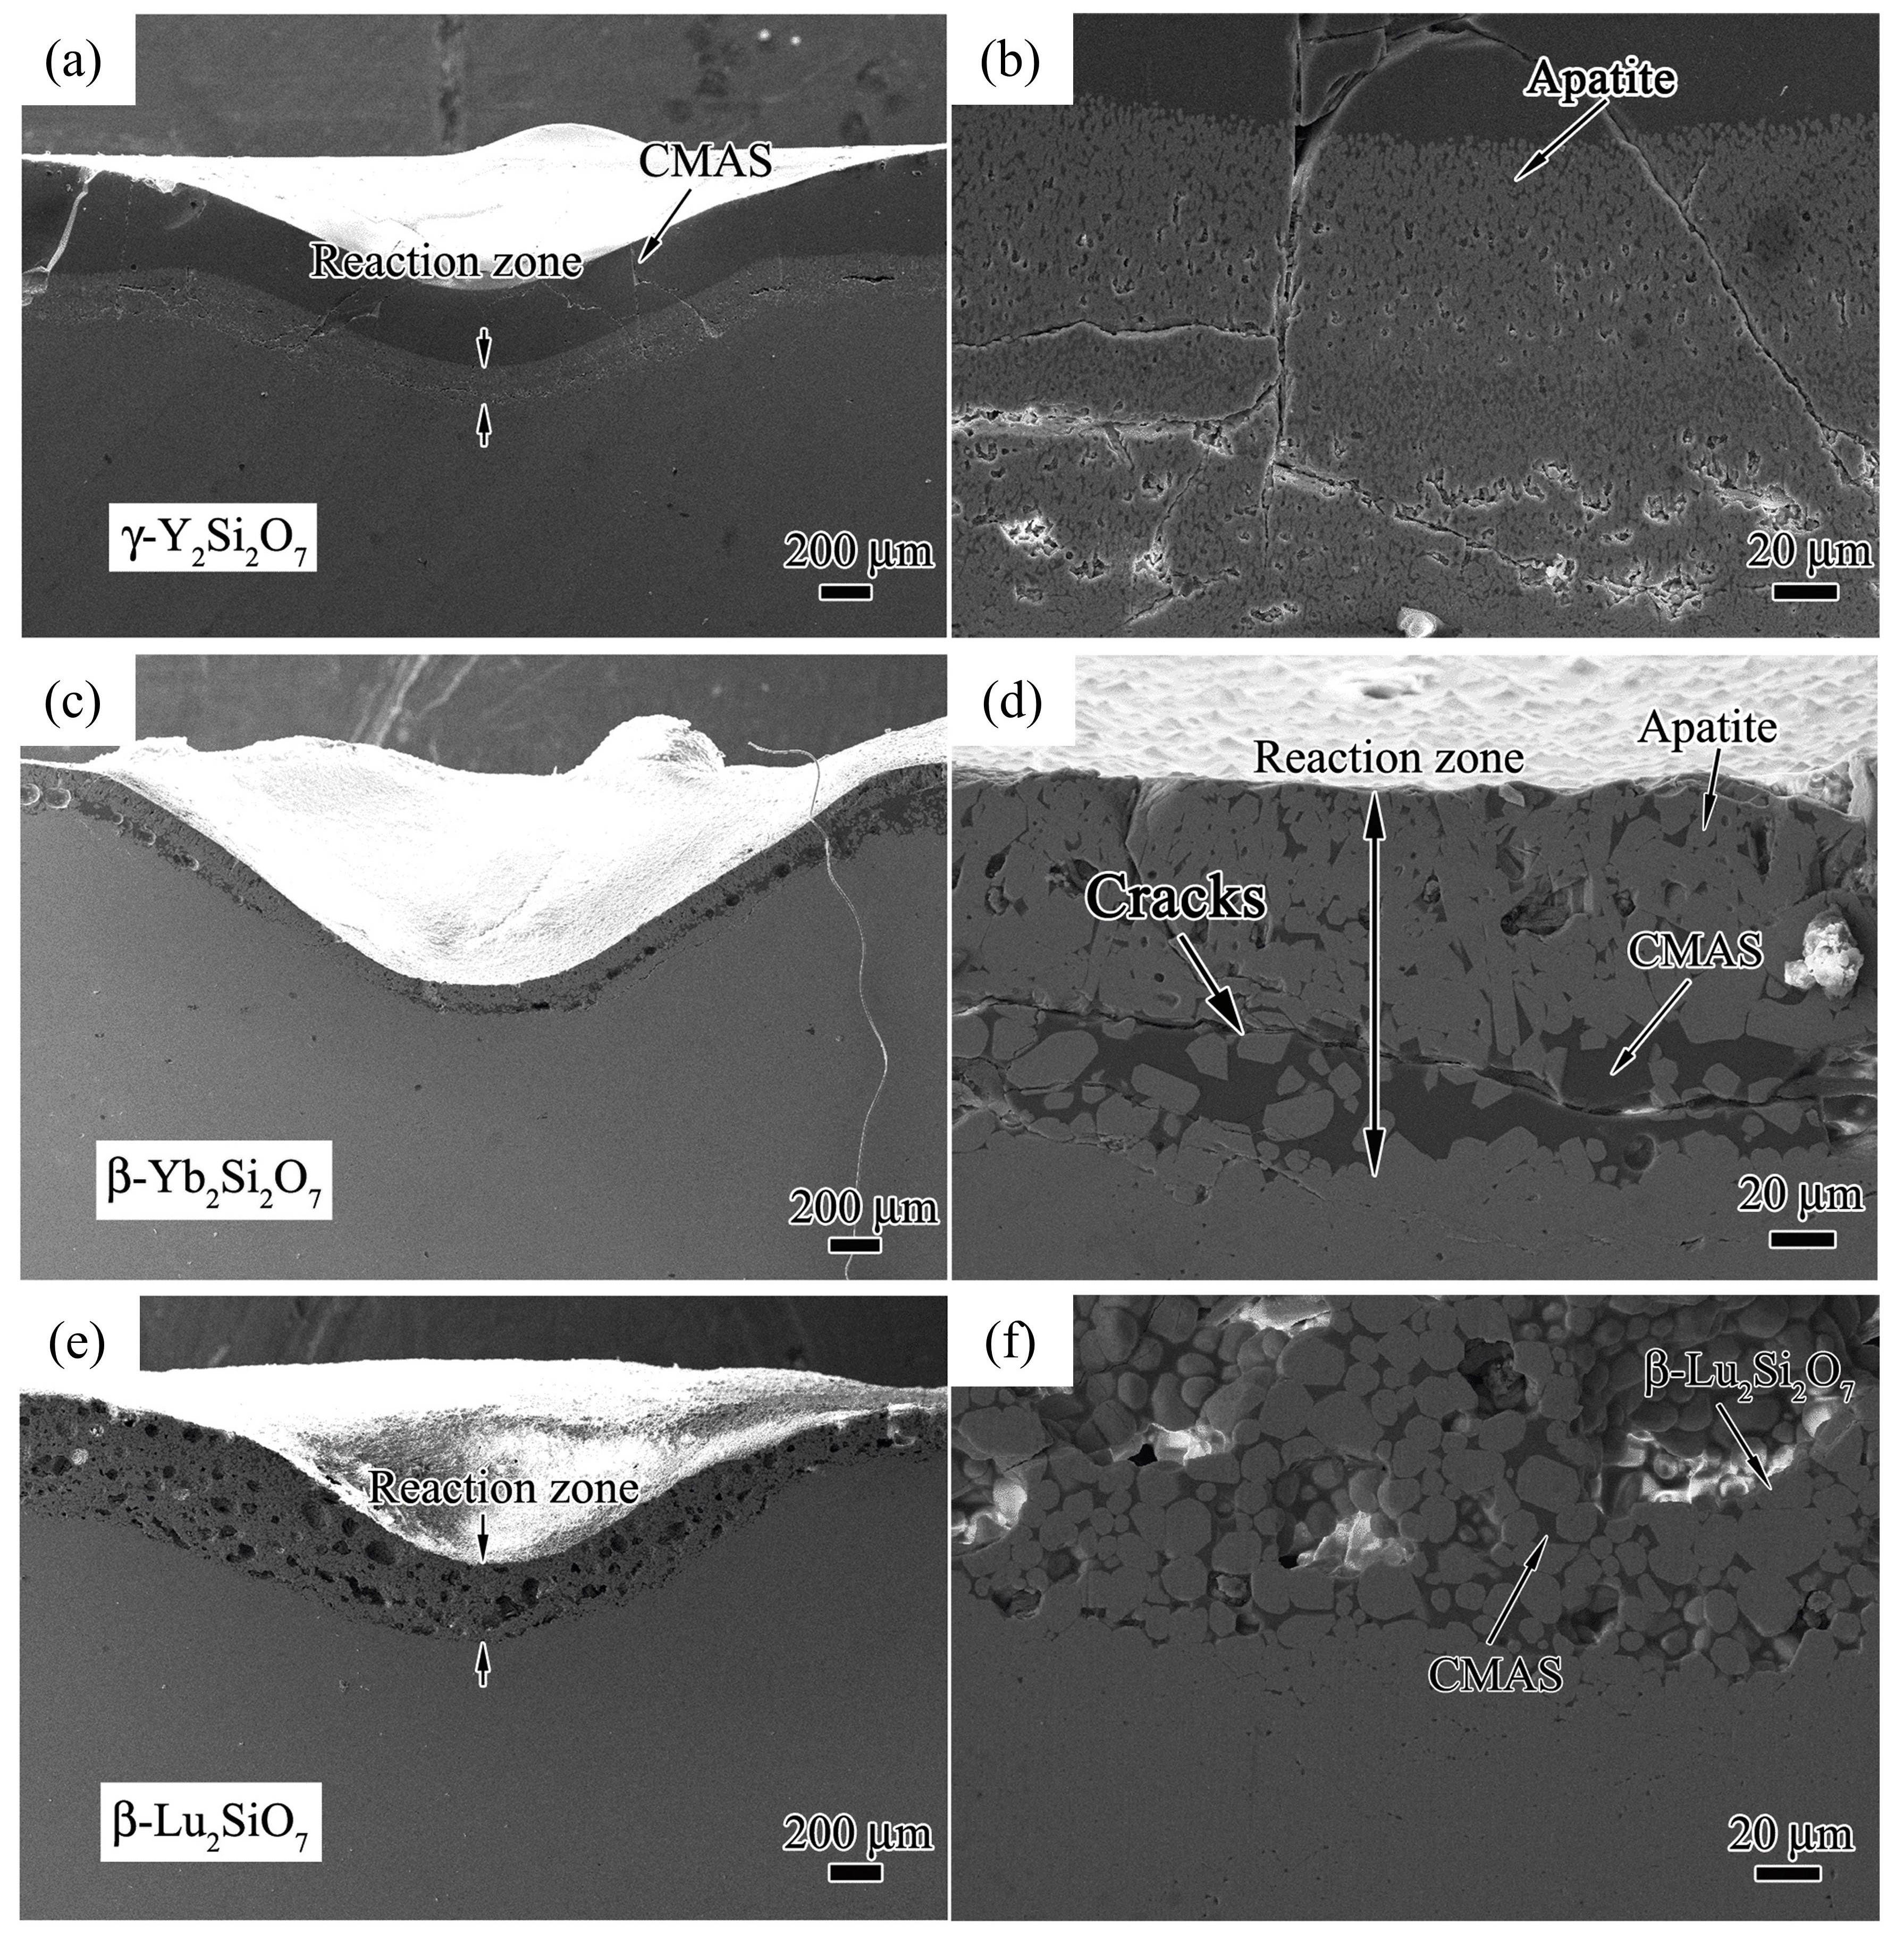
Fig. 33
Cross-sectional morphologies after CMAS corrosion at 1300 ℃: (a, b) γ-Y
2
Si
2
O
7
, (c, d) β-Yb
2
Si
2
O
7
, and (e, f) β-Lu
2
Si
2
O
7
. Reproduced with permission from Ref. [
114
], © Elsevier 2019.
Fig. 34
(a-c) Cross-sectional morphology of RE
2
Si
2
O
7
(RE = Y, Yb, and Lu) after CMAS corrosion at 1500 ℃; (d) Temperature-dependent internal friction of RE
2
Si
2
O
7
(RE = Y, Yb, and Lu). Reproduced with permission from Ref. [
114
], © Elsevier 2019.
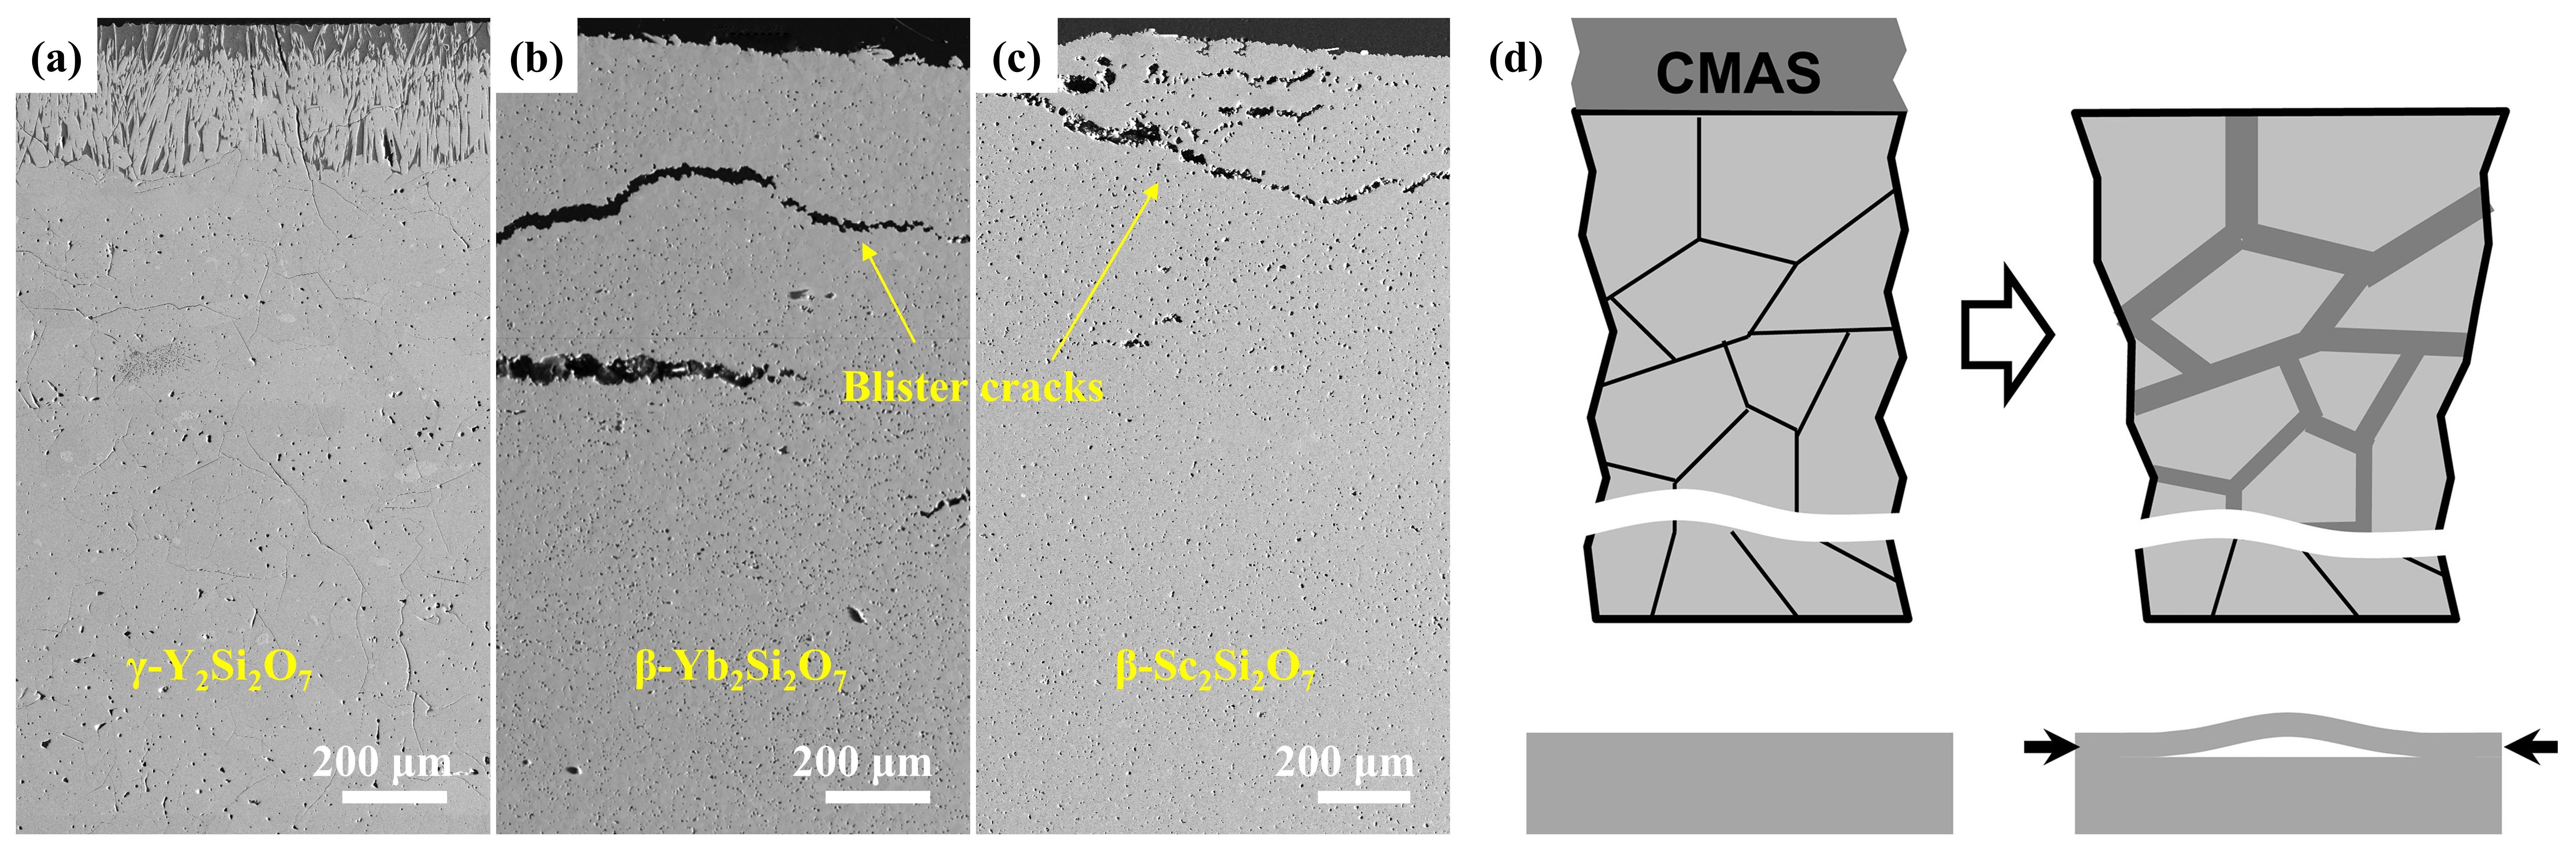
Fig. 36
(a-c) Cross-sectional morphology of γ-Y
2
Si
2
O
7
, β-Yb
2
Si
2
O
7
, and β-Sc
2
Si
2
O
7
after CMAS corrosion at 1500 ℃; (d) Schematic diagram of the formation of “blister” cracks. Reproduced with permission from Ref. [
116
] for (a), © Elsevier 2018. Reproduced with permission from Ref. [
115
] for (b-d), © Elsevier 2018.
summarizes representative studies on the CMAS corrosion of rare earth silicates. For RE
2
Si
2
O
7
, β-phases with smaller RE ionic radii (such as Yb
2
Si
2
O
7
and Lu
2
Si
2
O
7
) demonstrate relatively lower corrosion resistance than γ- and δ-phases, which contain larger ions, exemplified by γ-Y
2
Si
2
O
7
and δ-Gd
2
Si
2
O
7
. At high temperatures, the CMAS grain boundary infiltration occurs in RE
2
Si
2
O
7
resulting in a lower corrosion resistance relative to that of the RE
2
SiO
5
counterpart. Within RE
2
SiO
5
, the corrosion resistance of the X1 phase positively correlates with the RE ionic radius but remains inferior to that of the X2 phase. Notably, for X2-RE
2
SiO
5
, corrosion resistance inversely correlates with RE ionic radius at lower temperatures, while at elevated temperatures, it becomes less sensitive to variations in the RE element species.
Fig. 36
Summary of CMAS corrosion resistance of rare earth silicates [
100
,
103
⇓
-
105
,
108
⇓
⇓
⇓
⇓
-
113
,
119
⇓
⇓
⇓
⇓
-
124
].
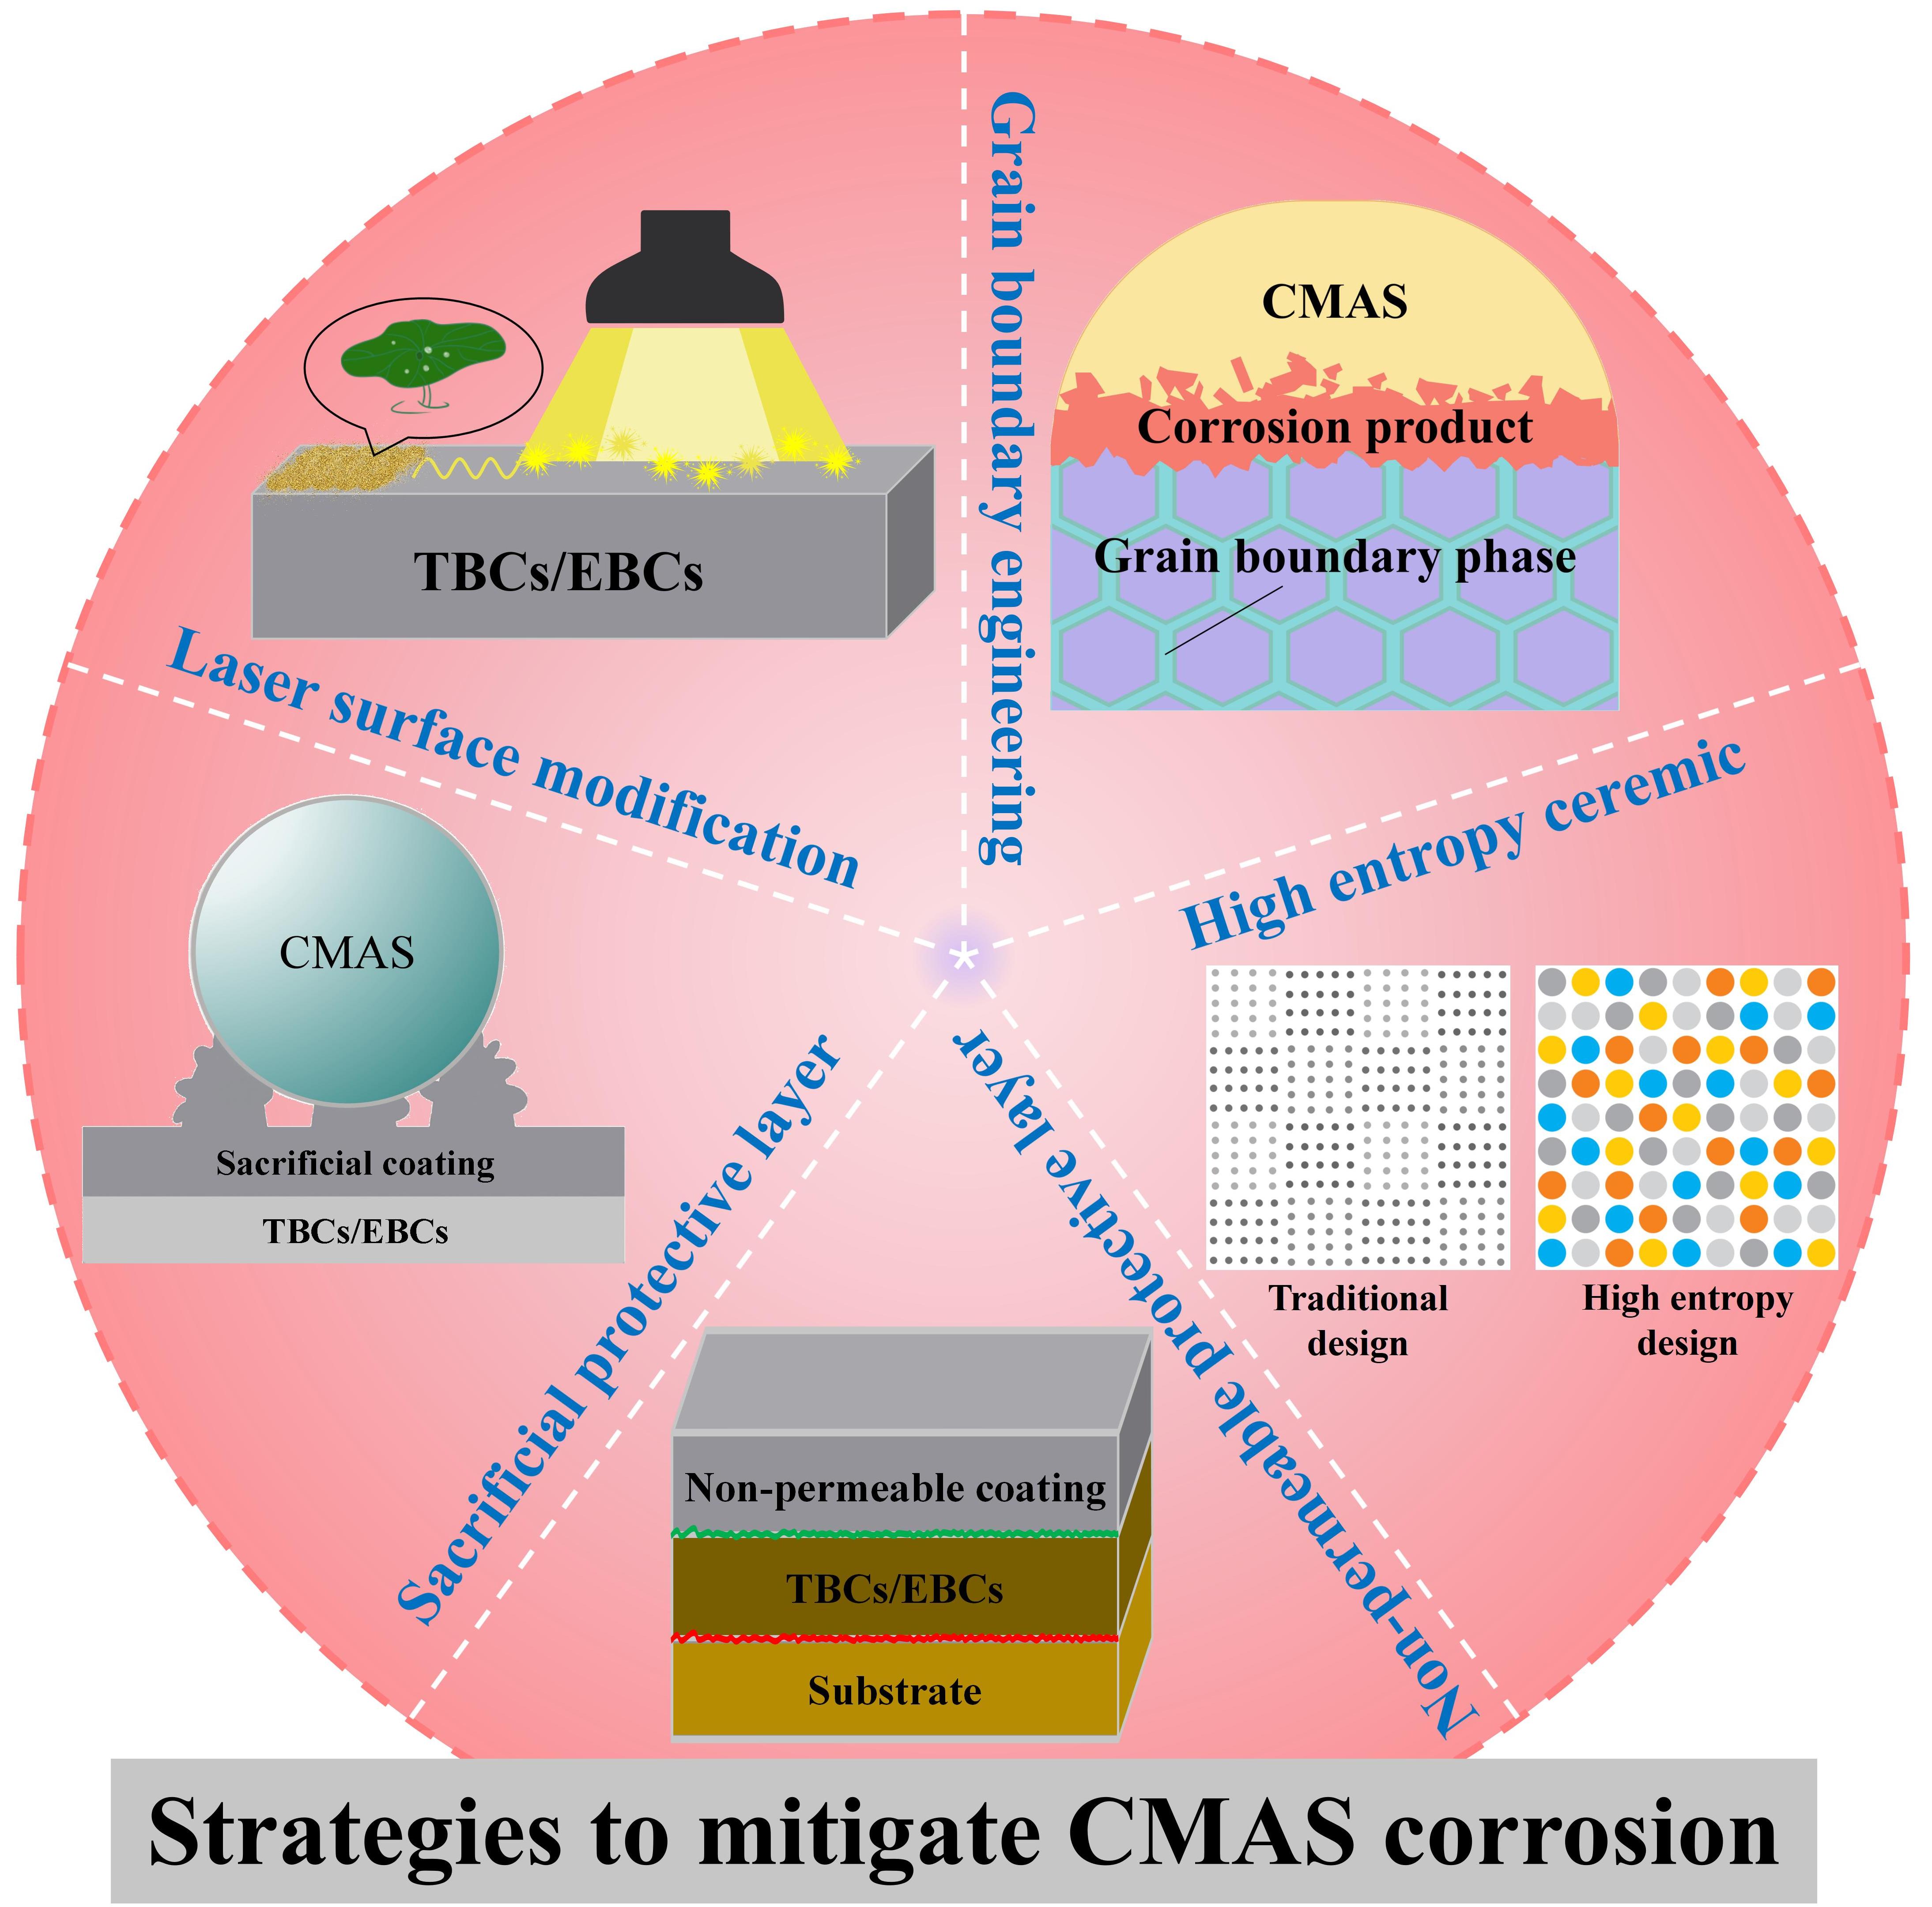
Fig. 37
Strategies to mitigate CMAS corrosion of TBCs and EBCs.
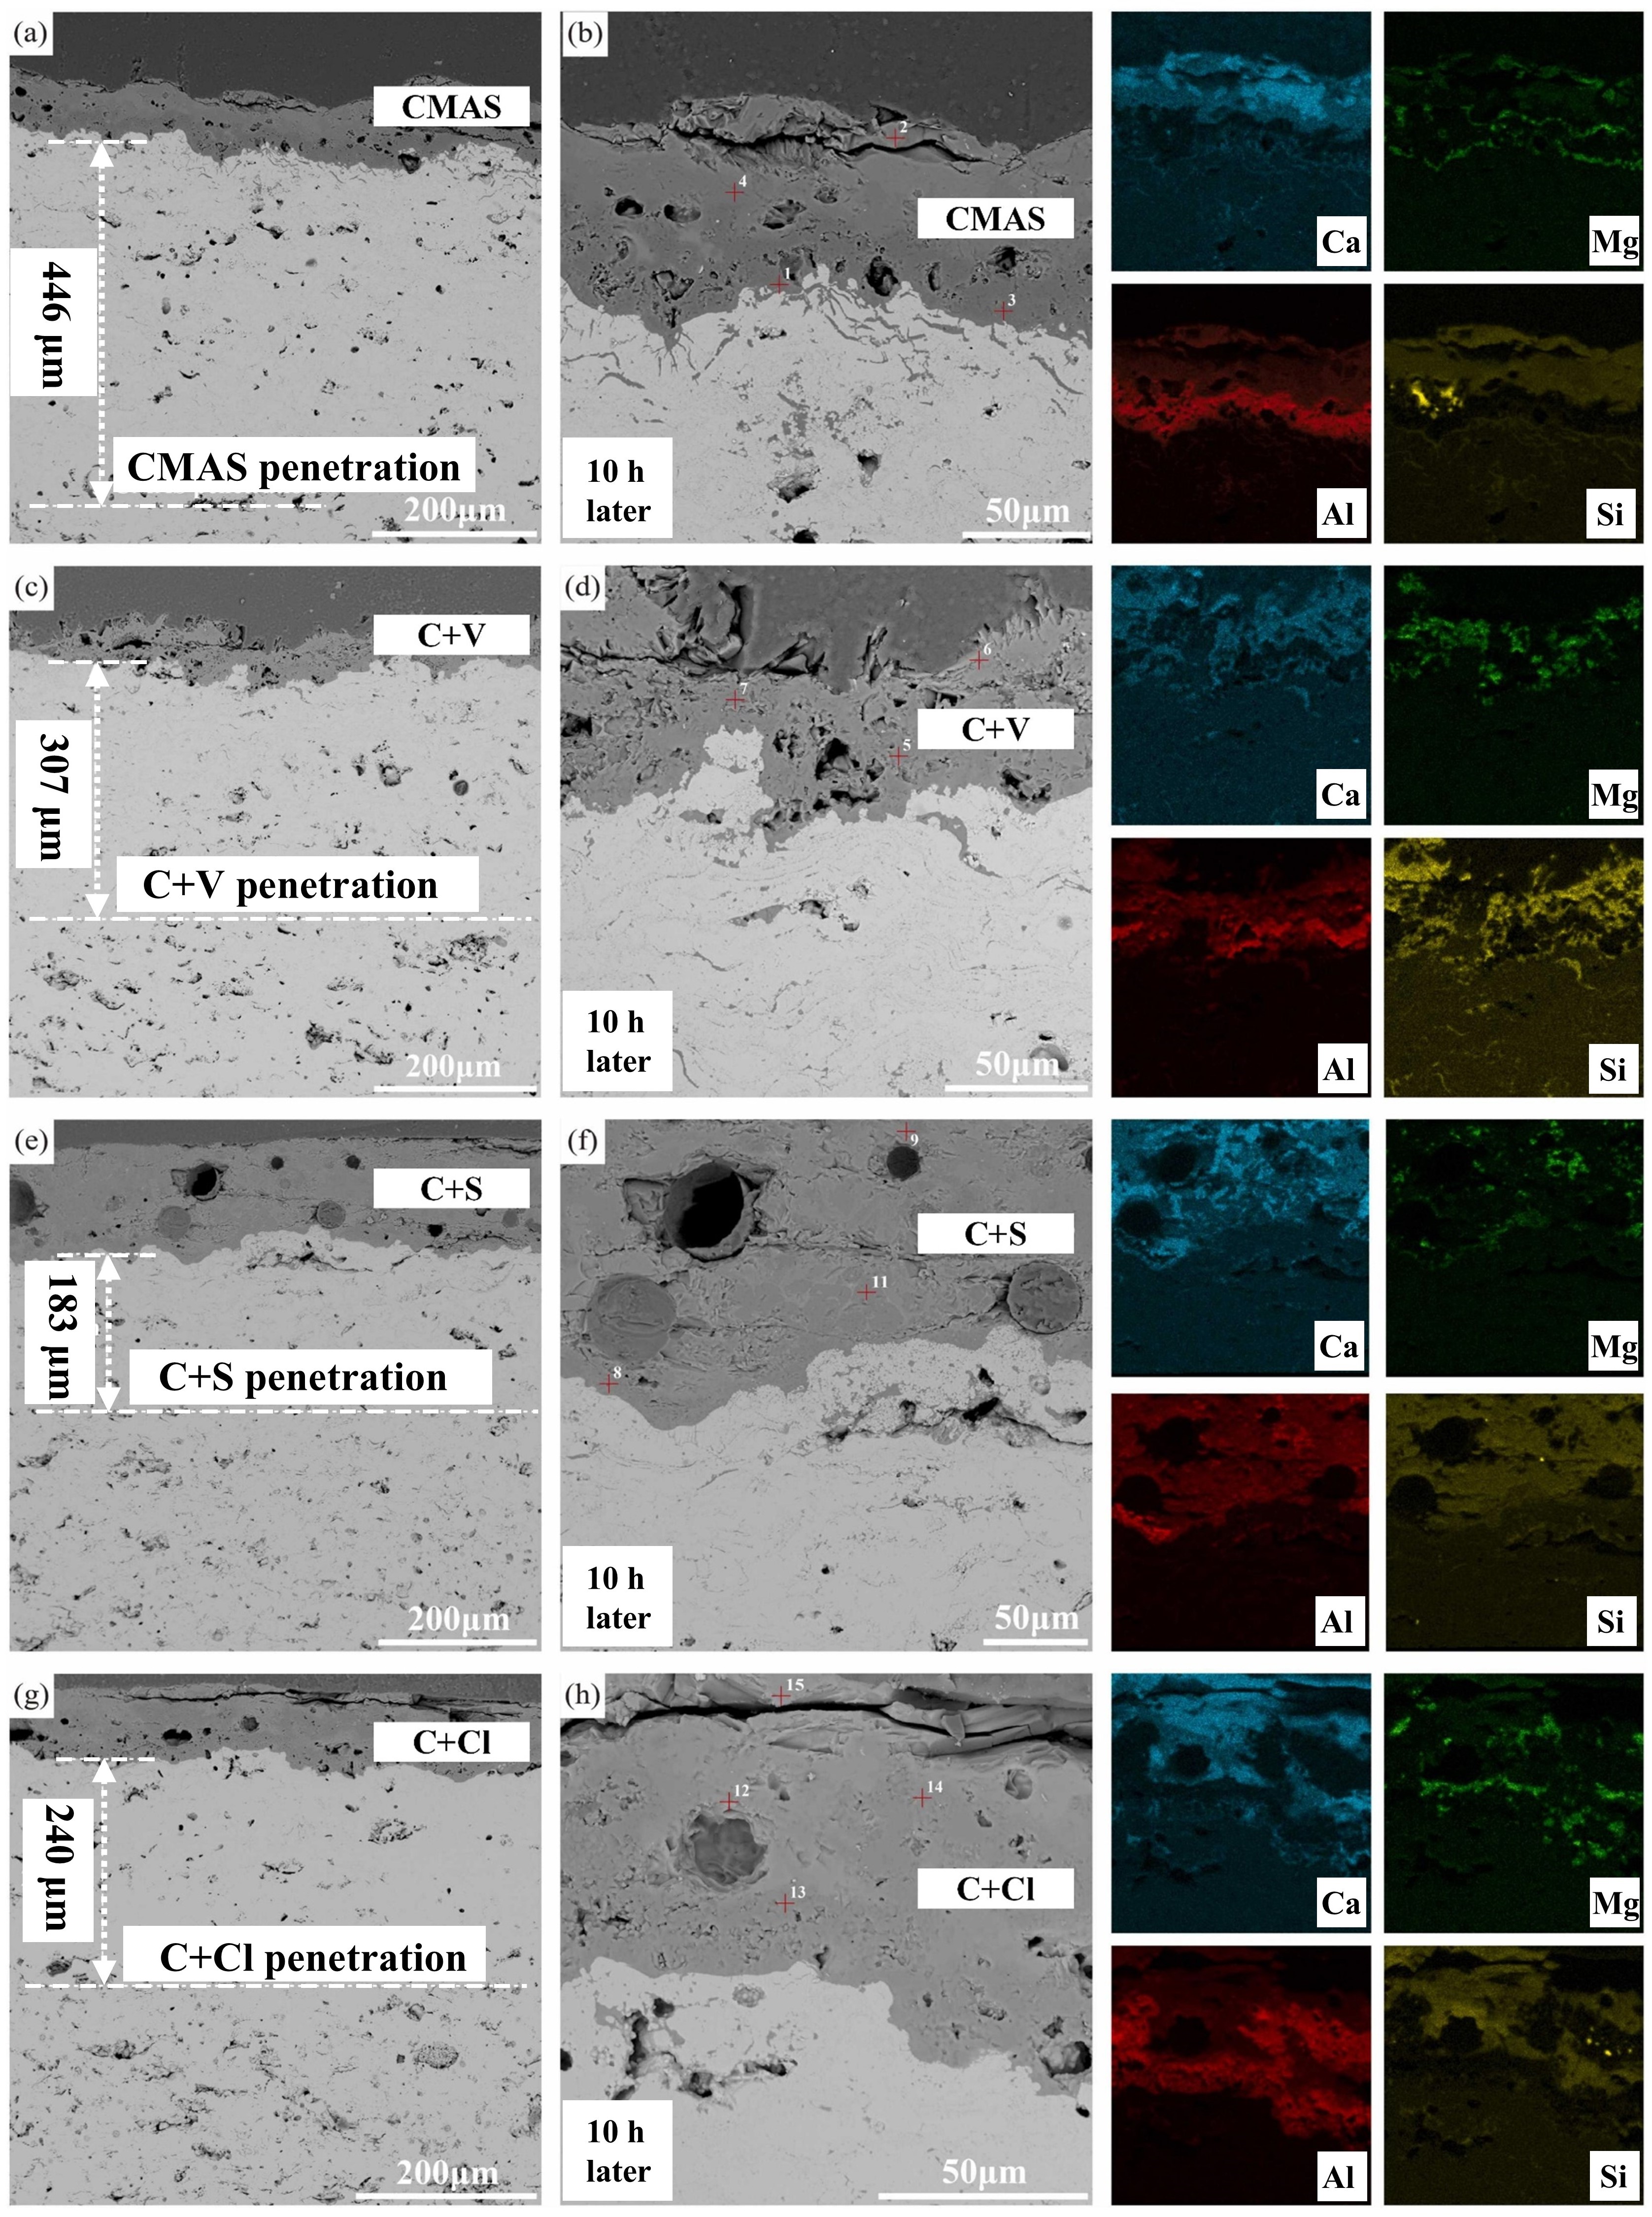
Fig. 39
A cross-sectional SEM images of the Al
2
O
3
-YSZ coating exposed to (a-b) CMAS, (c-d) CMAS+NaVO
3
powders, (e-f) CMAS+Na
2
SO
4
powders, and (g-h) CMAS+NaCl powders for 10 h, and corresponding EDS mapping results (Ca, Mg, Al, and Si elements) are also provided. Reproduced with permission from Ref. [
131
], © Elsevier 2024.
Fig. 40
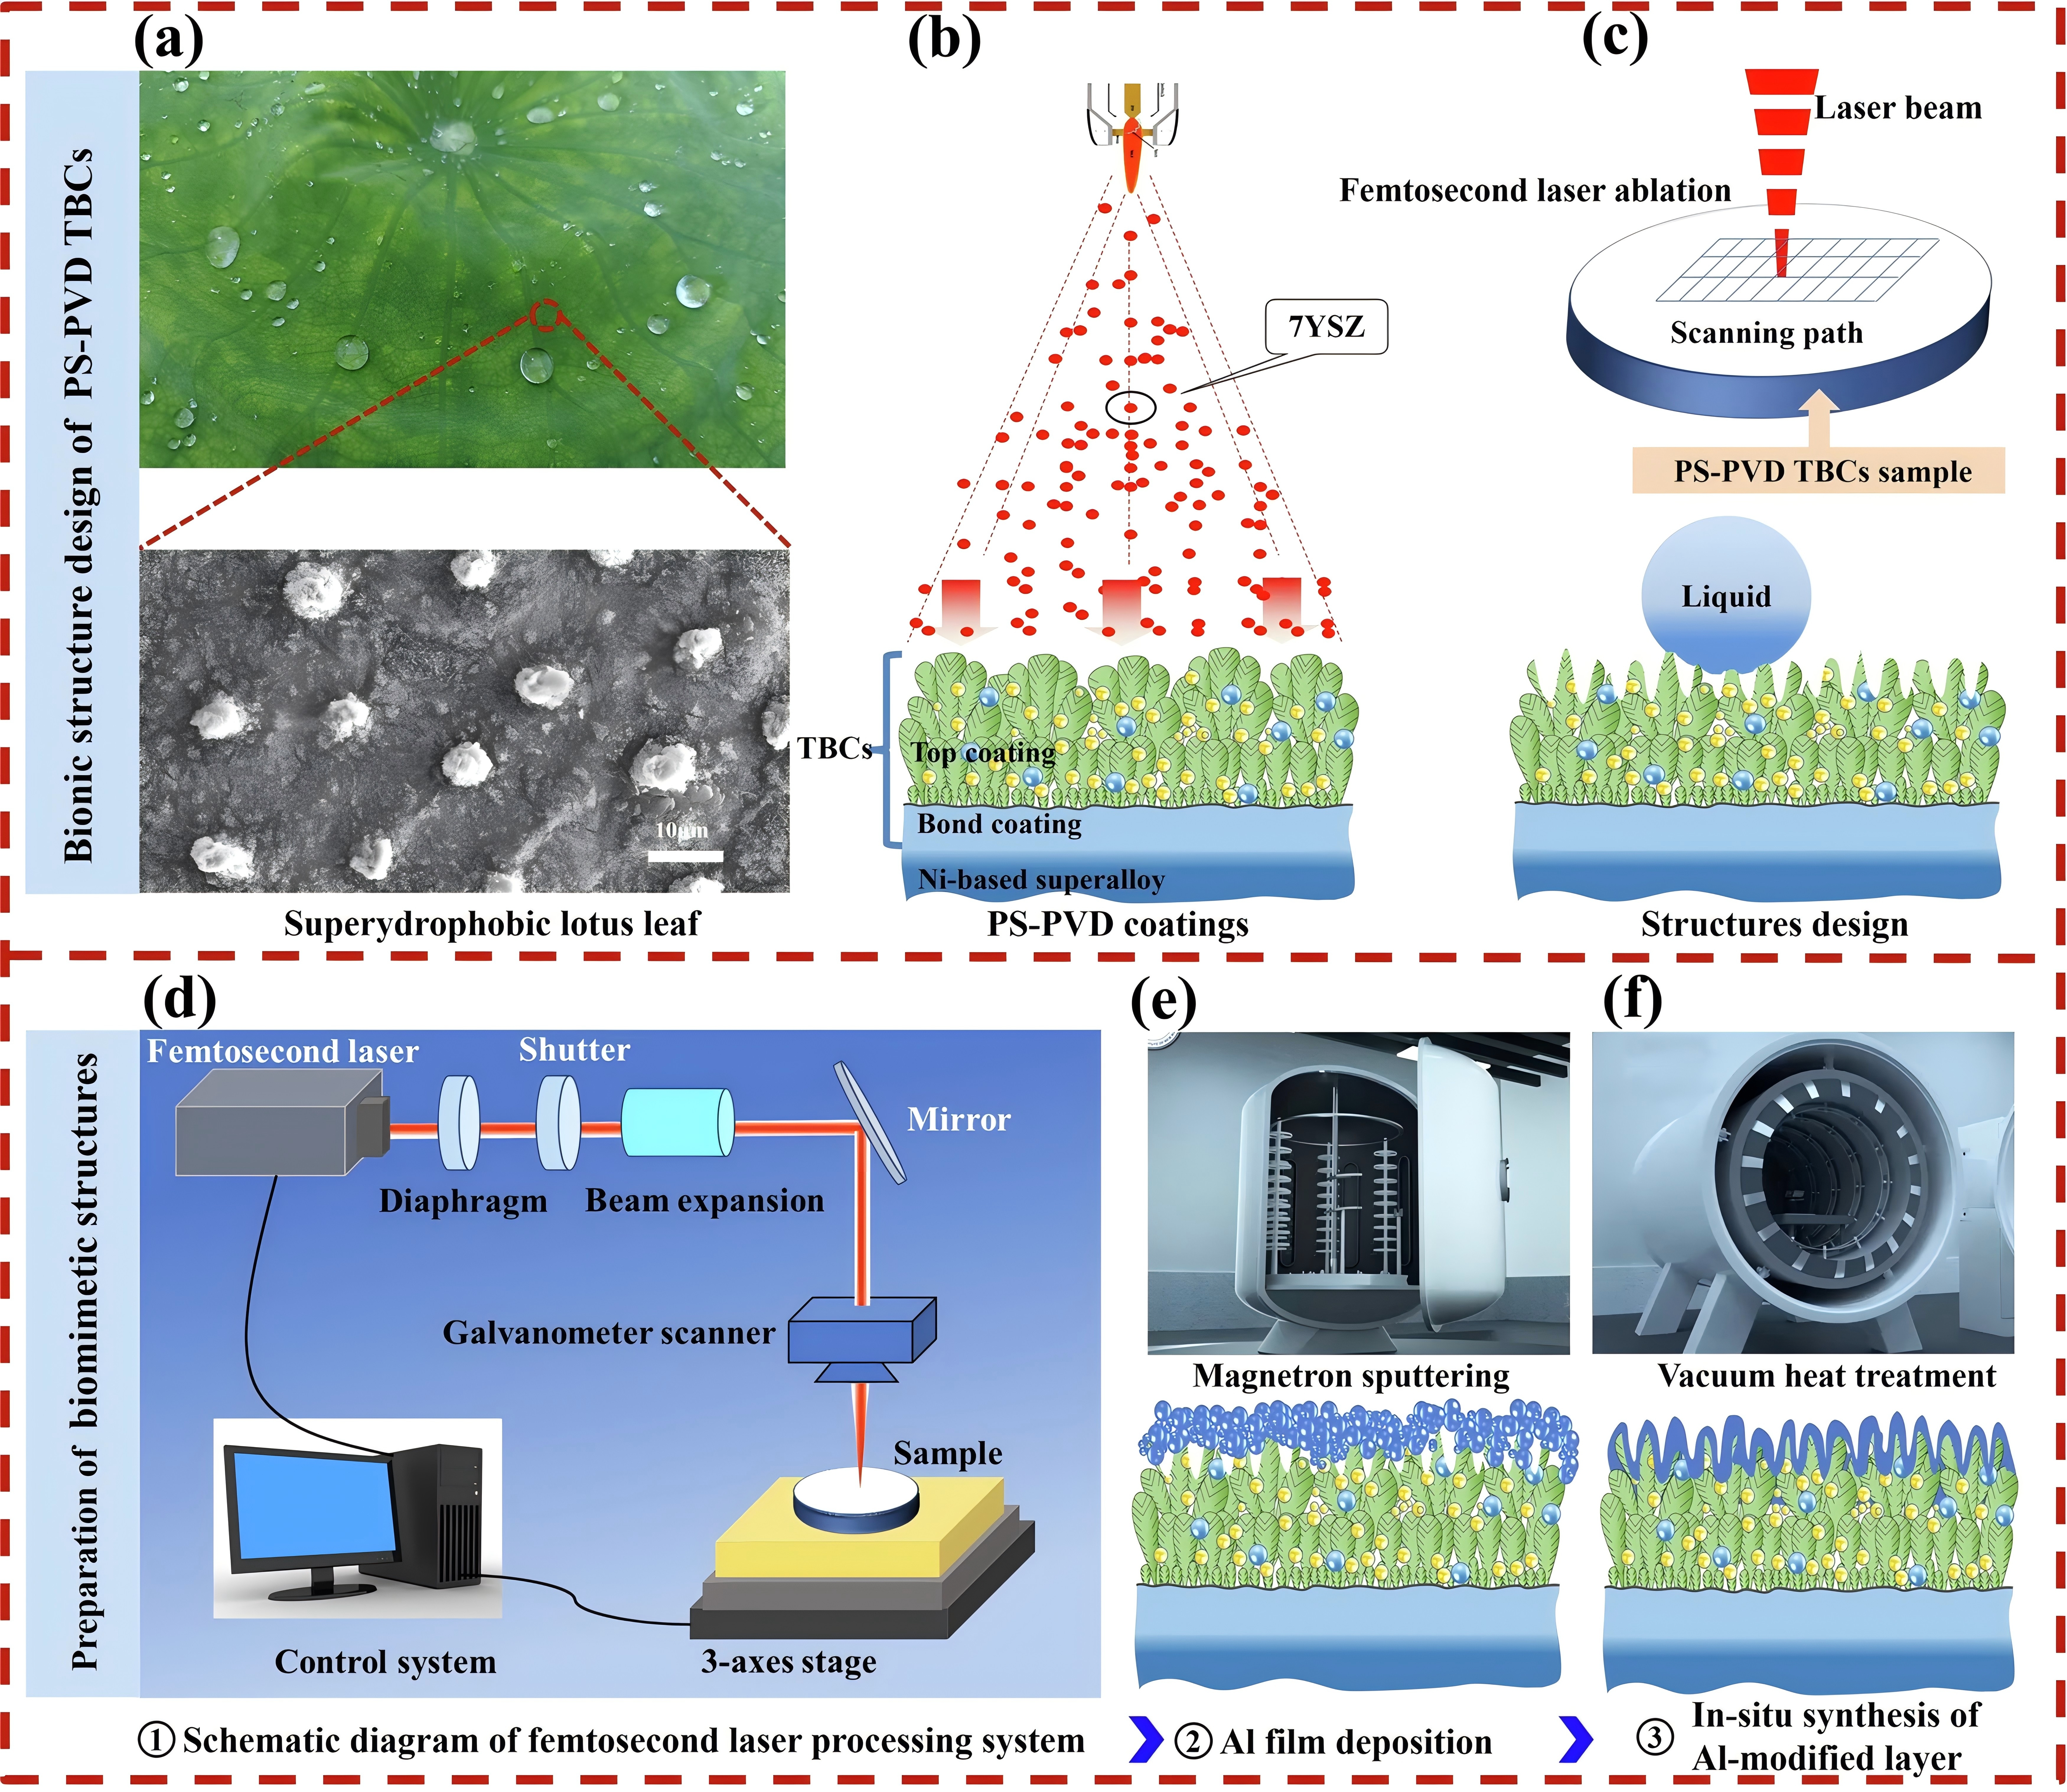
(a) Superhydrophobic lotus leaf and its microstructure-the source of inspiration. (b) PS-PVD TBCs preparation. (c) Constructing the lotus leaf structure on PS-PVD TBCs surface. (d) Schematic diagram of femtosecond laser processing system and fabrication of micro-nanostructured PS-PVD TBCs. (e) Al film deposition by magnetron sputtering. (f) In situ synthesis of Al-modified layer on laser textured PS-PVD TBCs by vacuum heat treatment. Reproduced with permission from Ref. [
132
], ©The Author(s) 2024.
Fig. 41
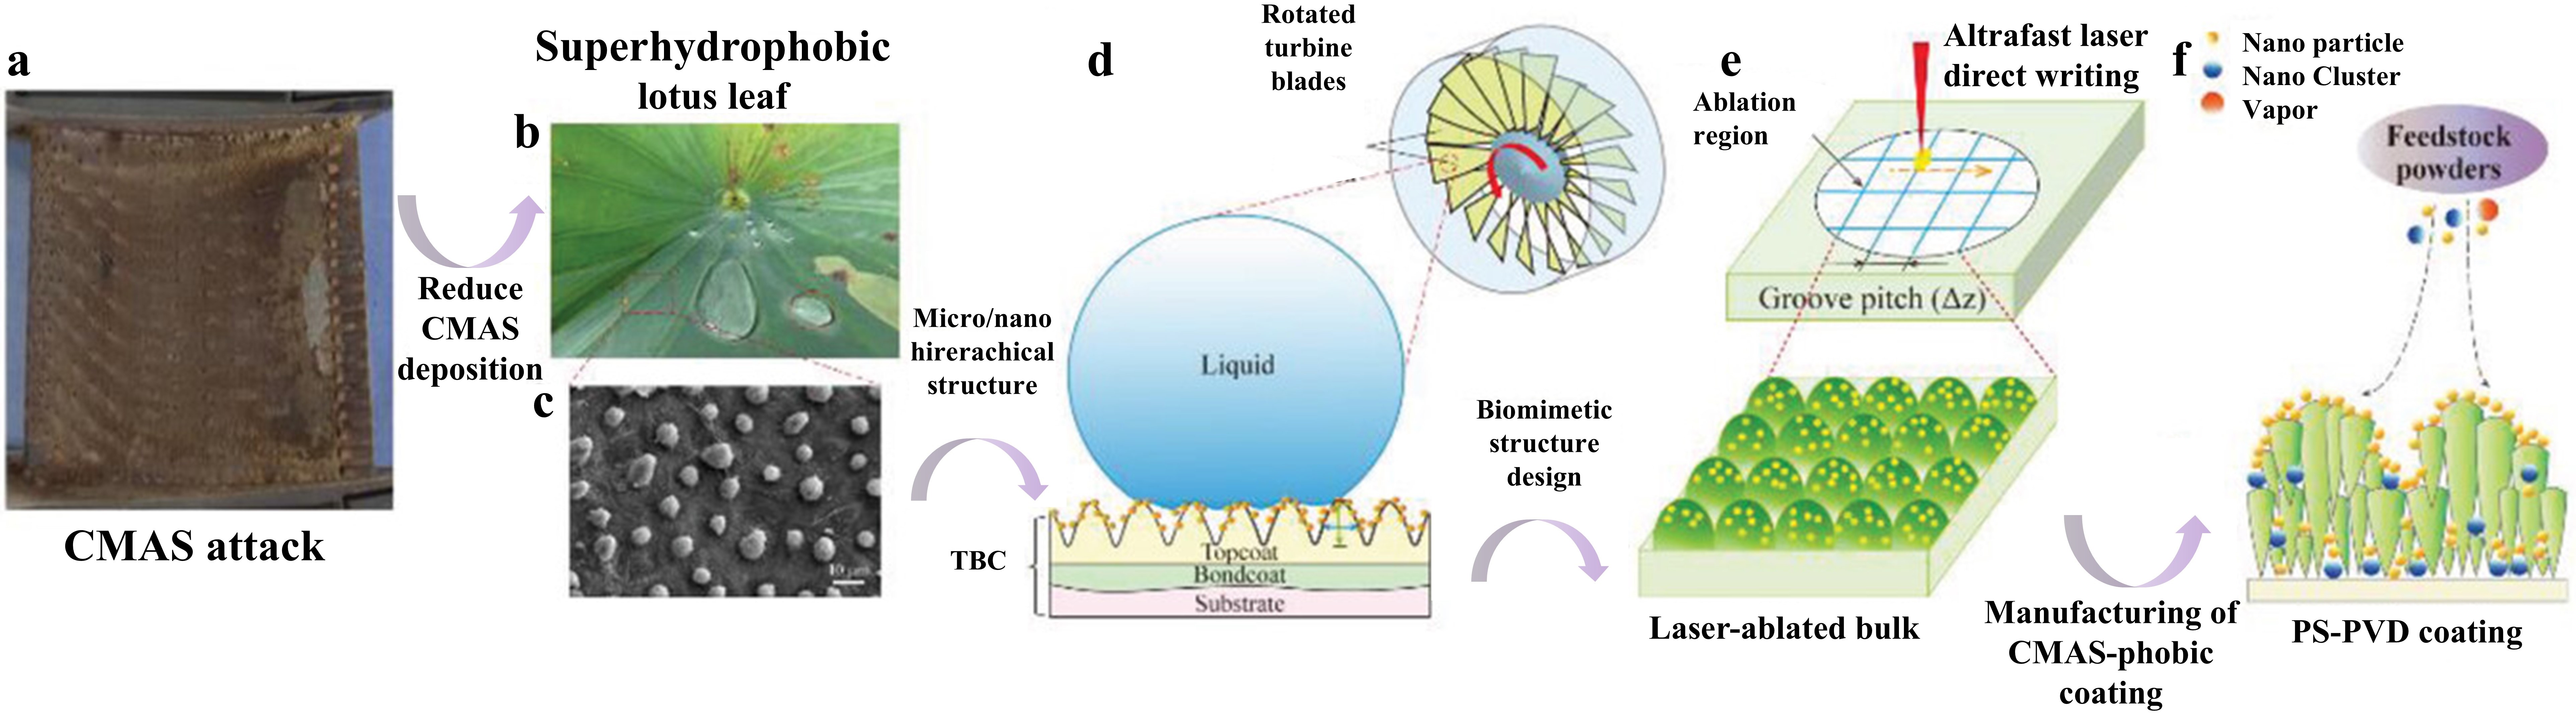
(a) Volcanic ash accumulation on turbine blades leading to engine failure. (b) Lotus leaf-inspired superhydrophobicity for CMAS-phobic surface design. (c) Micro/nano hierarchical structure on TBC surface reducing CMAS deposition. (d) Biomimetic structure application on turbine blades to prevent CMAS adherence. (e) Ultrafast laser direct writing for micro/nano hierarchical structure on (Gd
0.9
Yb
0.1
)
2
Zr
2
O
7
material. (f) PS-PVD process for CMAS-phobic coating with microconical papillae and nanoparticles. Reproduced with permission from Ref. [
133
], ©The Author(s) 2023.
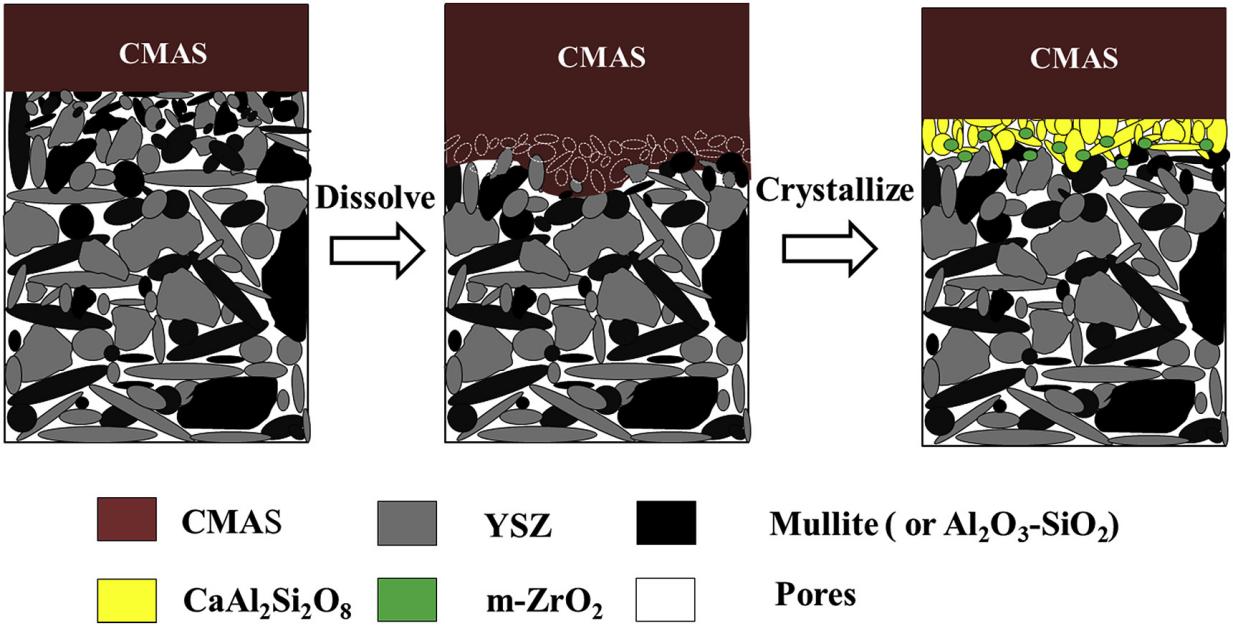
Fig. 42
The etching process of the ceramic material by CMAS. Left: CMAS initially erodes YSZ grains. Middle: CMAS dissolves YSZ to form CaAl
2
Si
2
O
8
phase. On the right: CMAS crystallizes, forming the m-ZrO
2
phase. Reproduced with permission from Ref. [
138
], ©The Author(s) 2019.
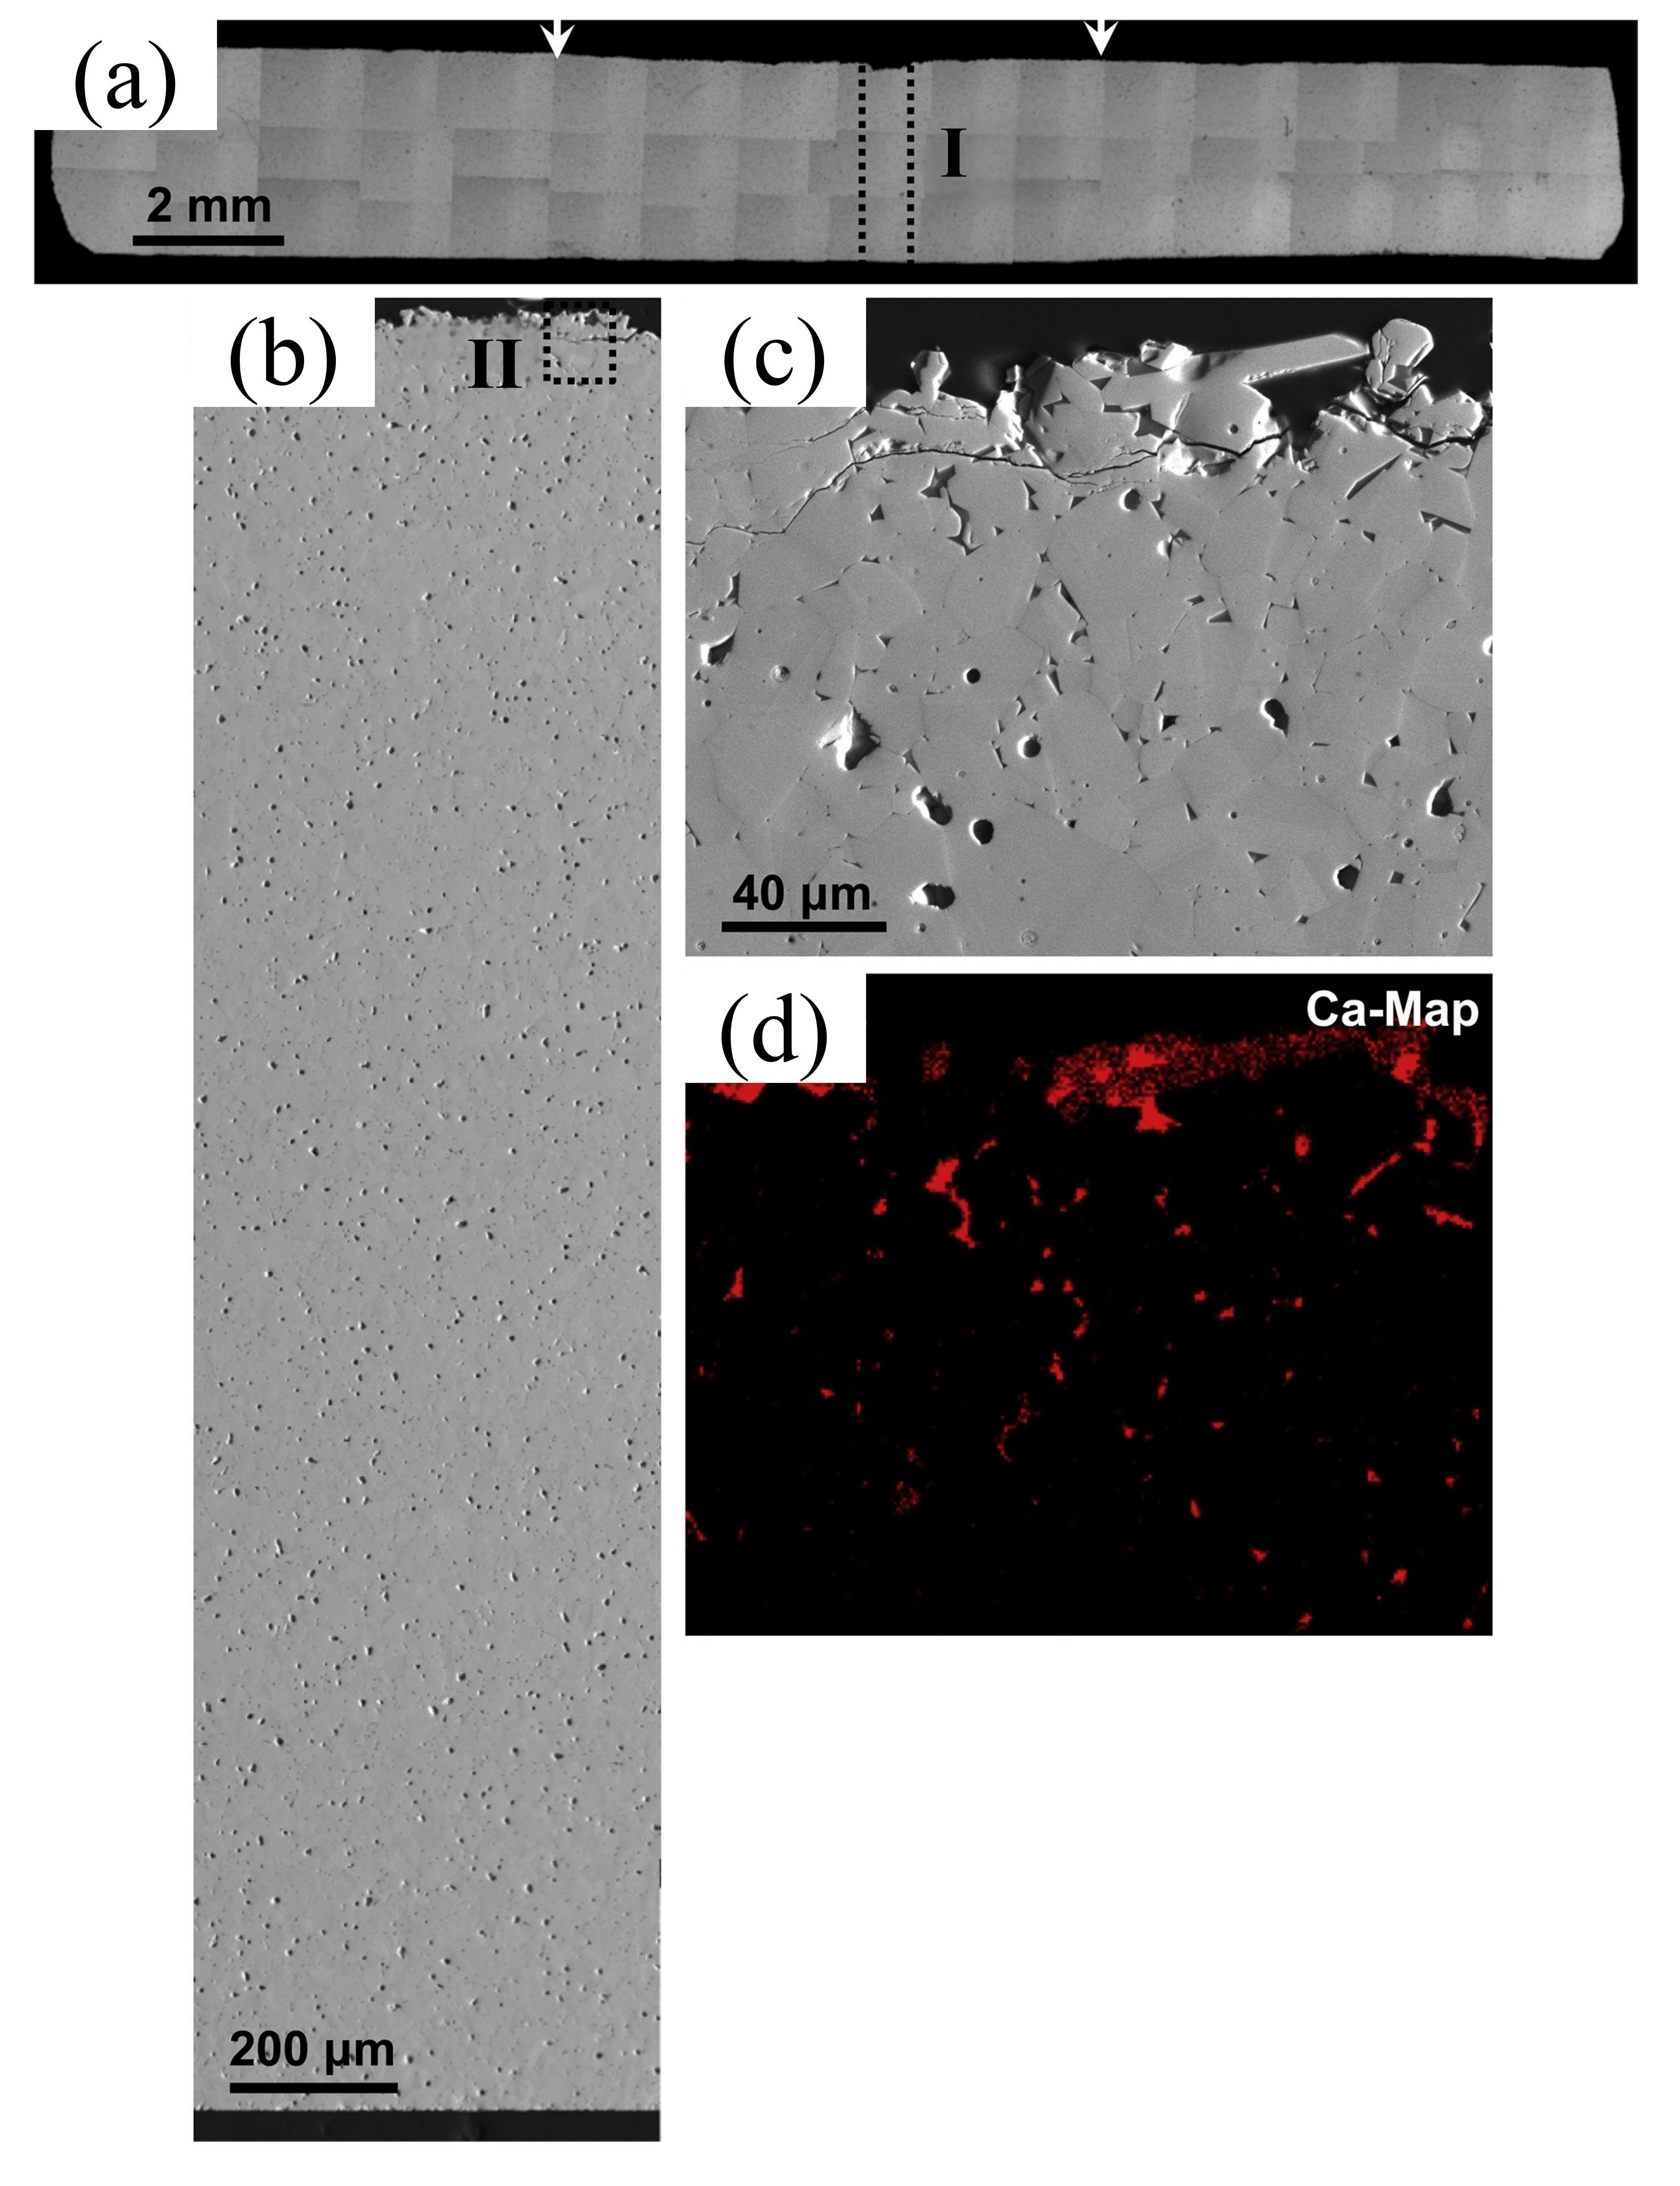
Fig. 43
(a) Collage of cross-sectional optical micrographs of β-Yb
2
Si
2
O
7
/1 vol% CMAS pellet that have interacted with CMAS at 1500 ℃ for 24 h. The region between the arrows is where the CMAS was applied. (b) Cross-sectional SEM image of the whole pellet from the region I. (c) Higher-magnification cross-sectional SEM image of the region II, and (d) corresponding EDS elemental Ca map. Reproduced with permission from Ref. [
114
], ©The Author(s) 2018.
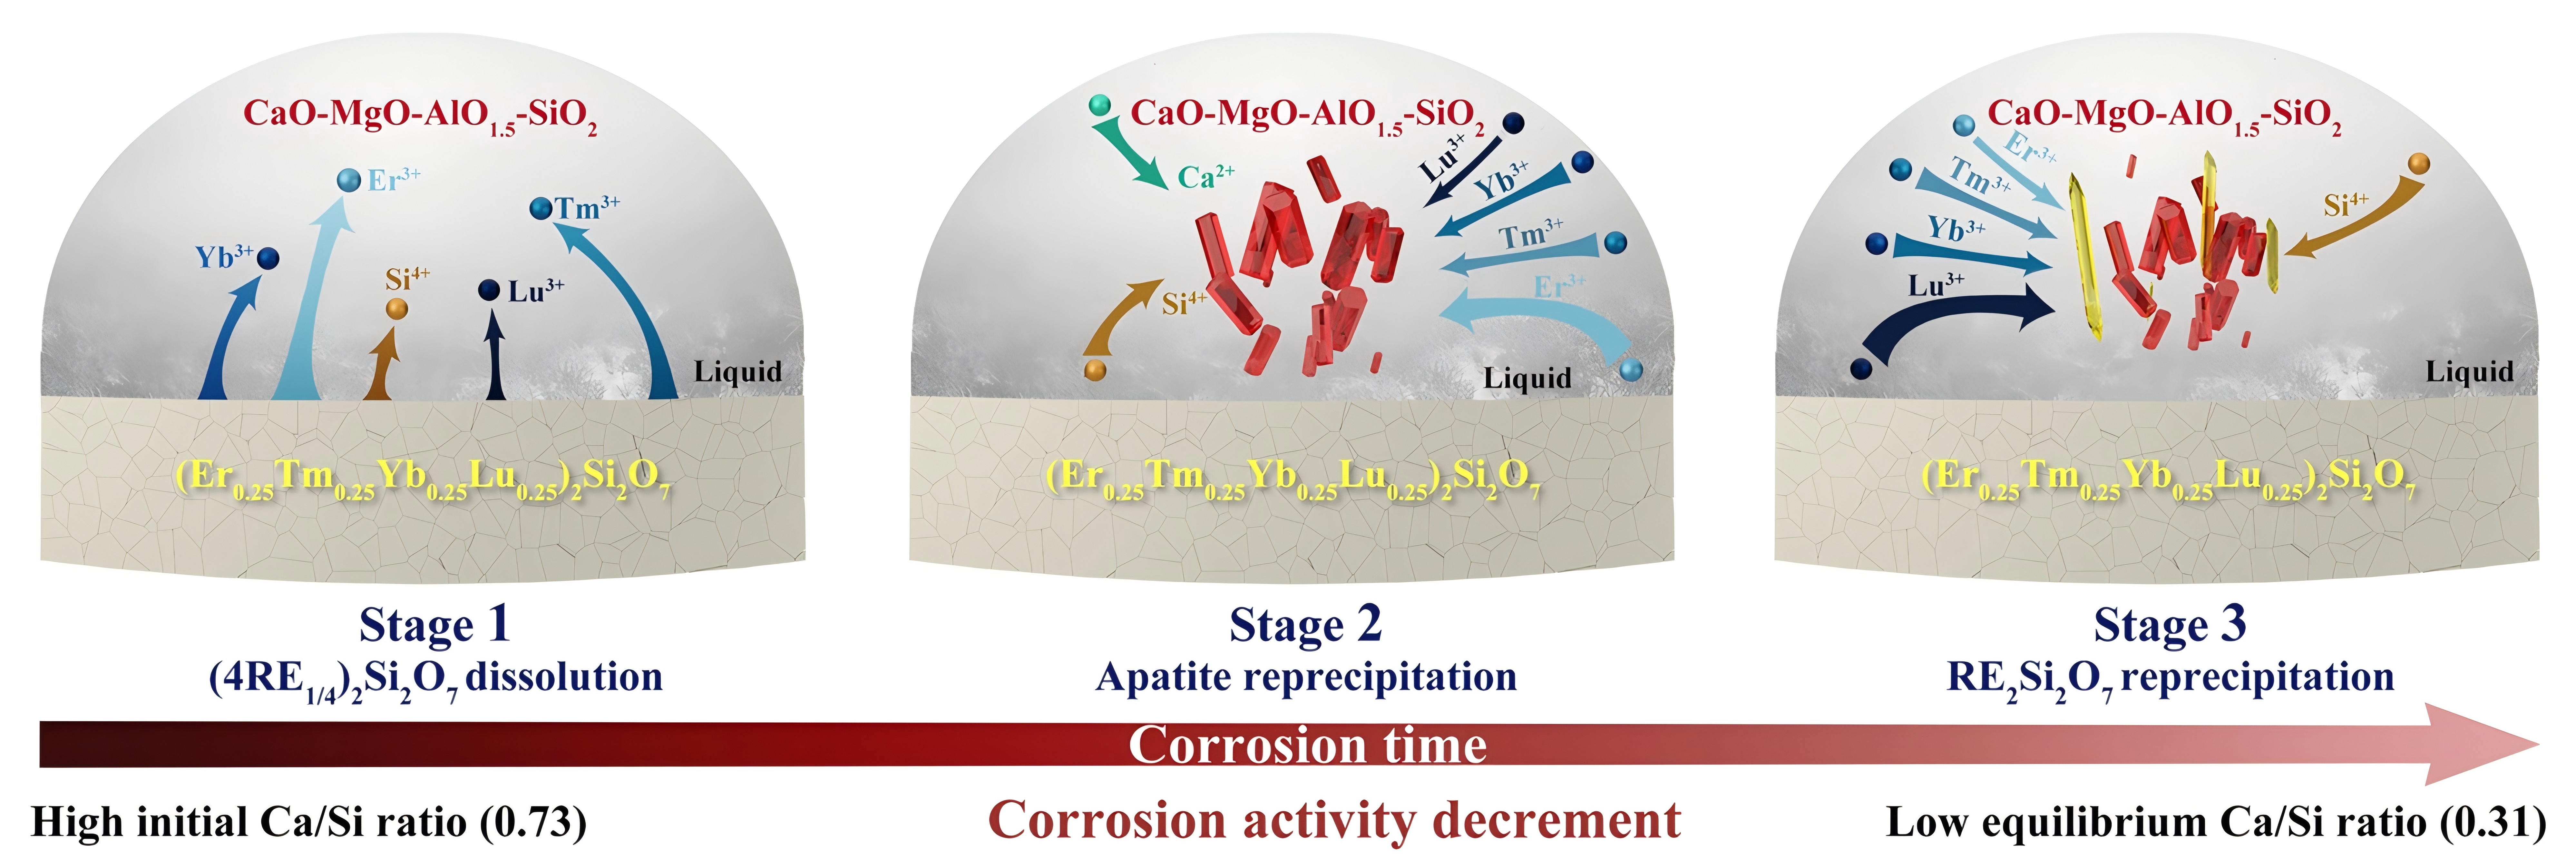
Fig. 44
Schematic diagram for the interaction between CMAS and (Er
0.25
Tm
0.25
Yb
0.25
Lu
0.25
)
2
Si
2
O
7
multicomponent disilicate at 1500 ℃. Reproduced with permission from Ref. [
139
], © Elsevier 2022.
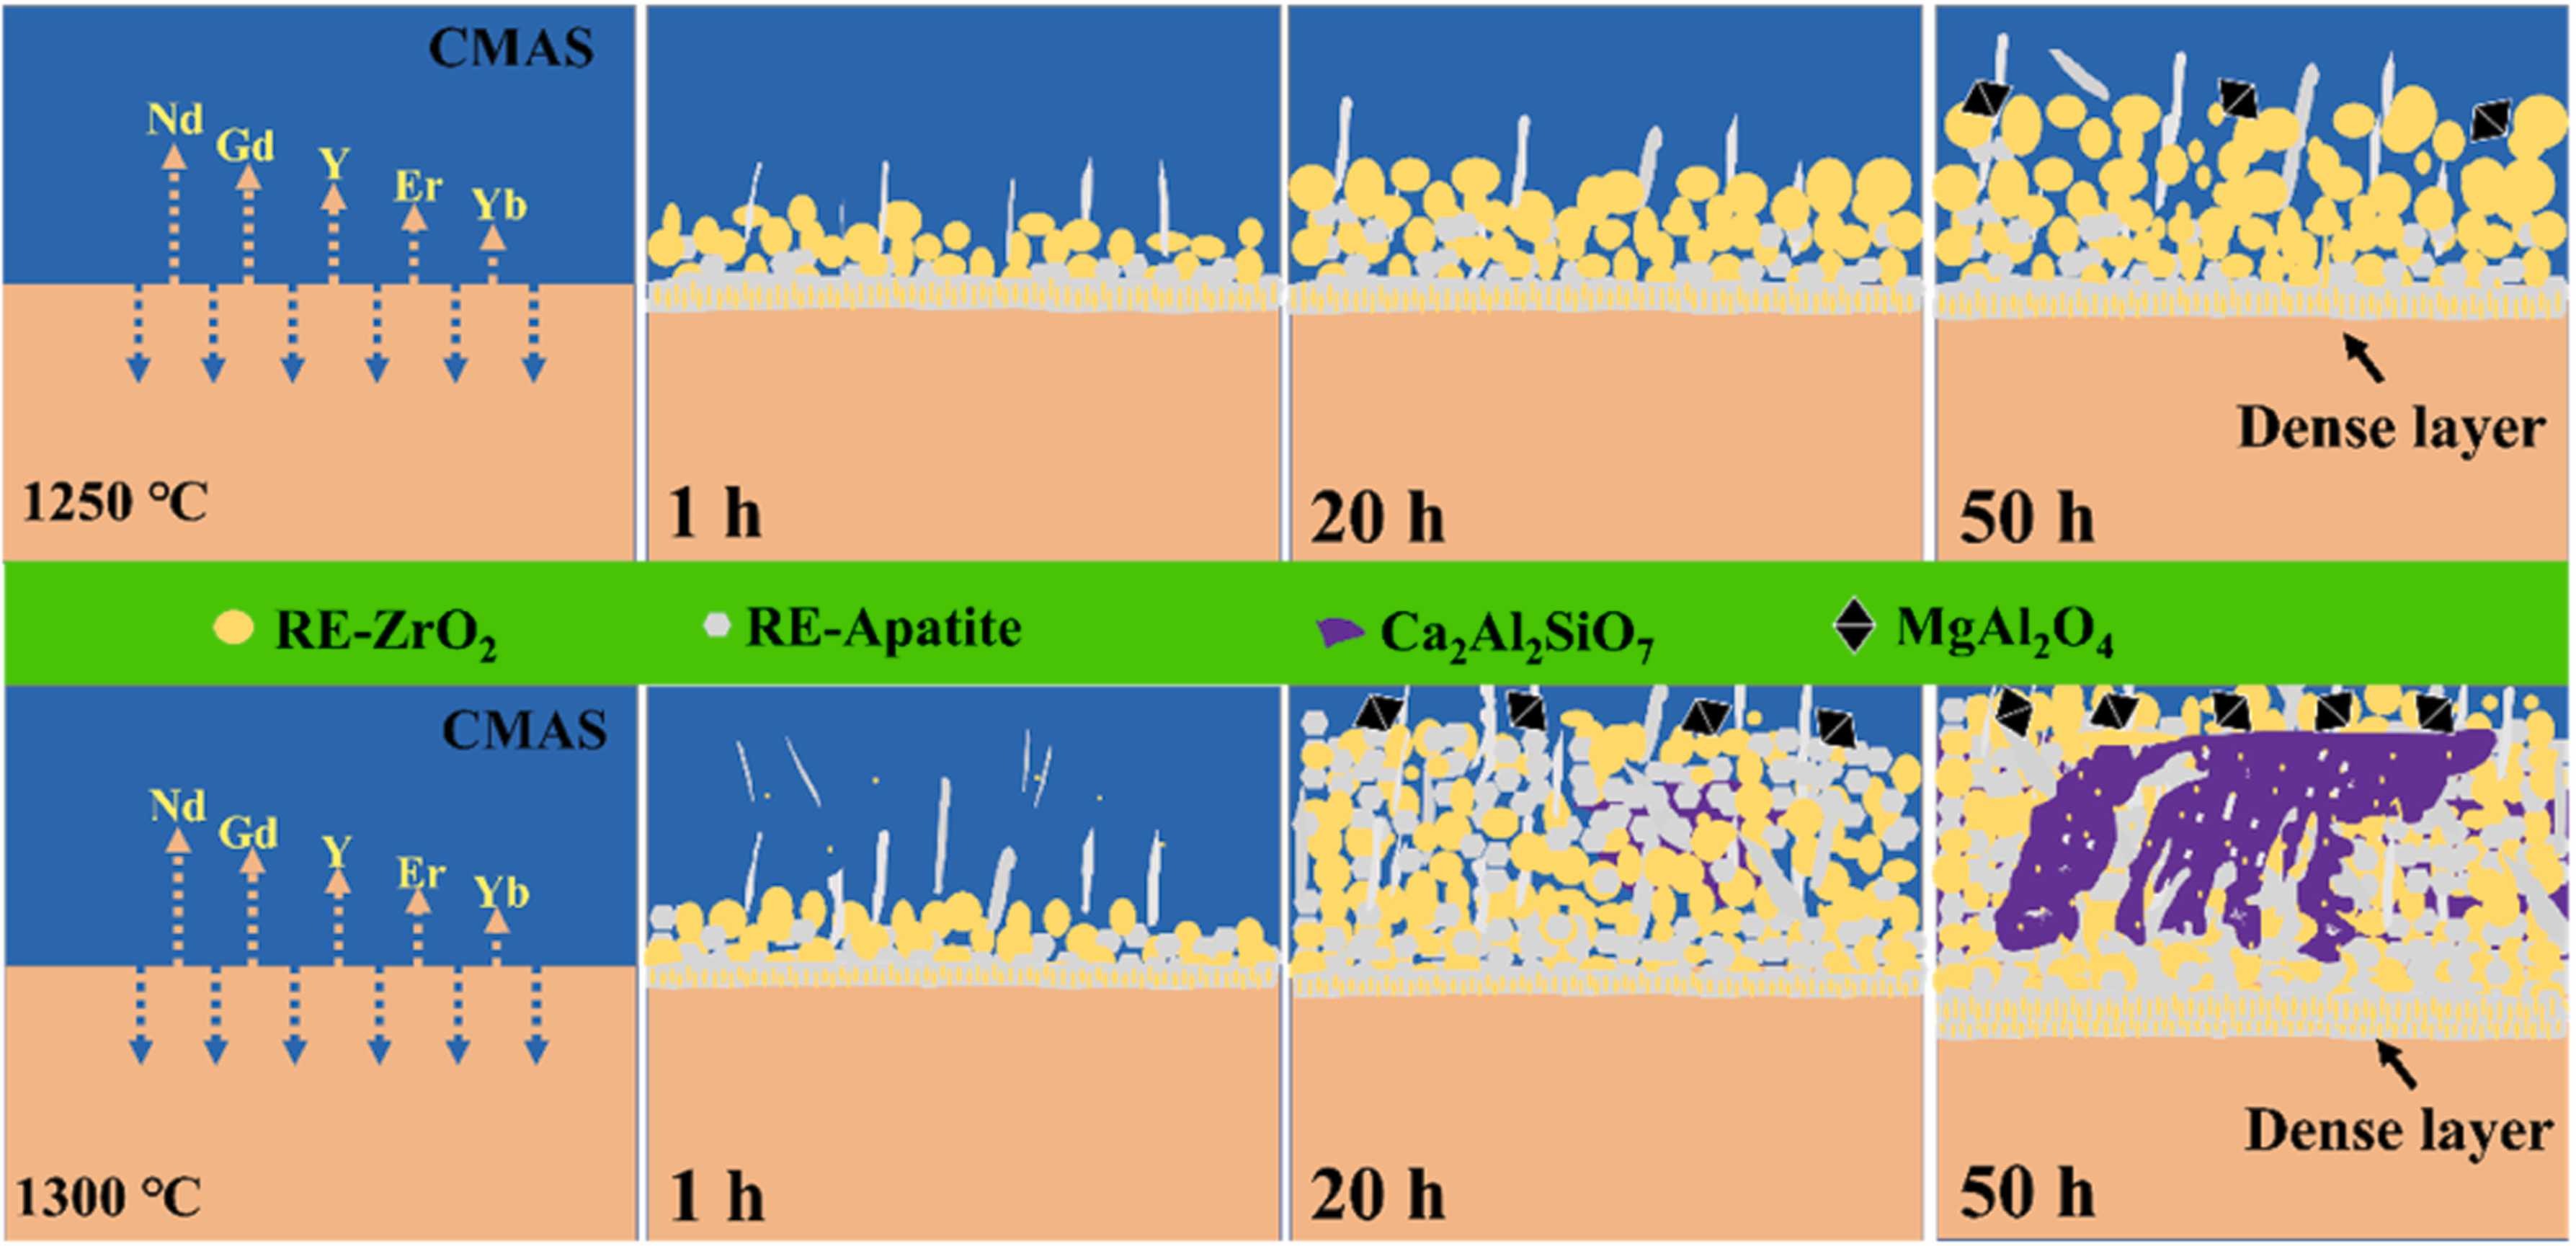
Fig. 45
Corrosion of high-entropy ceramic by CMAS at 1250 ℃ and 1300 ℃. Upper row: 1250 ℃; lower row: 1300 ℃. CMAS interaction leads to dense layers of RE-ZrO
2
, RE-apatite, Ca
2
Al
2
SiO
7
, and MgAl
2
O
4
. Reproduced with permission from Ref. [
141
], © Elsevier 2023.
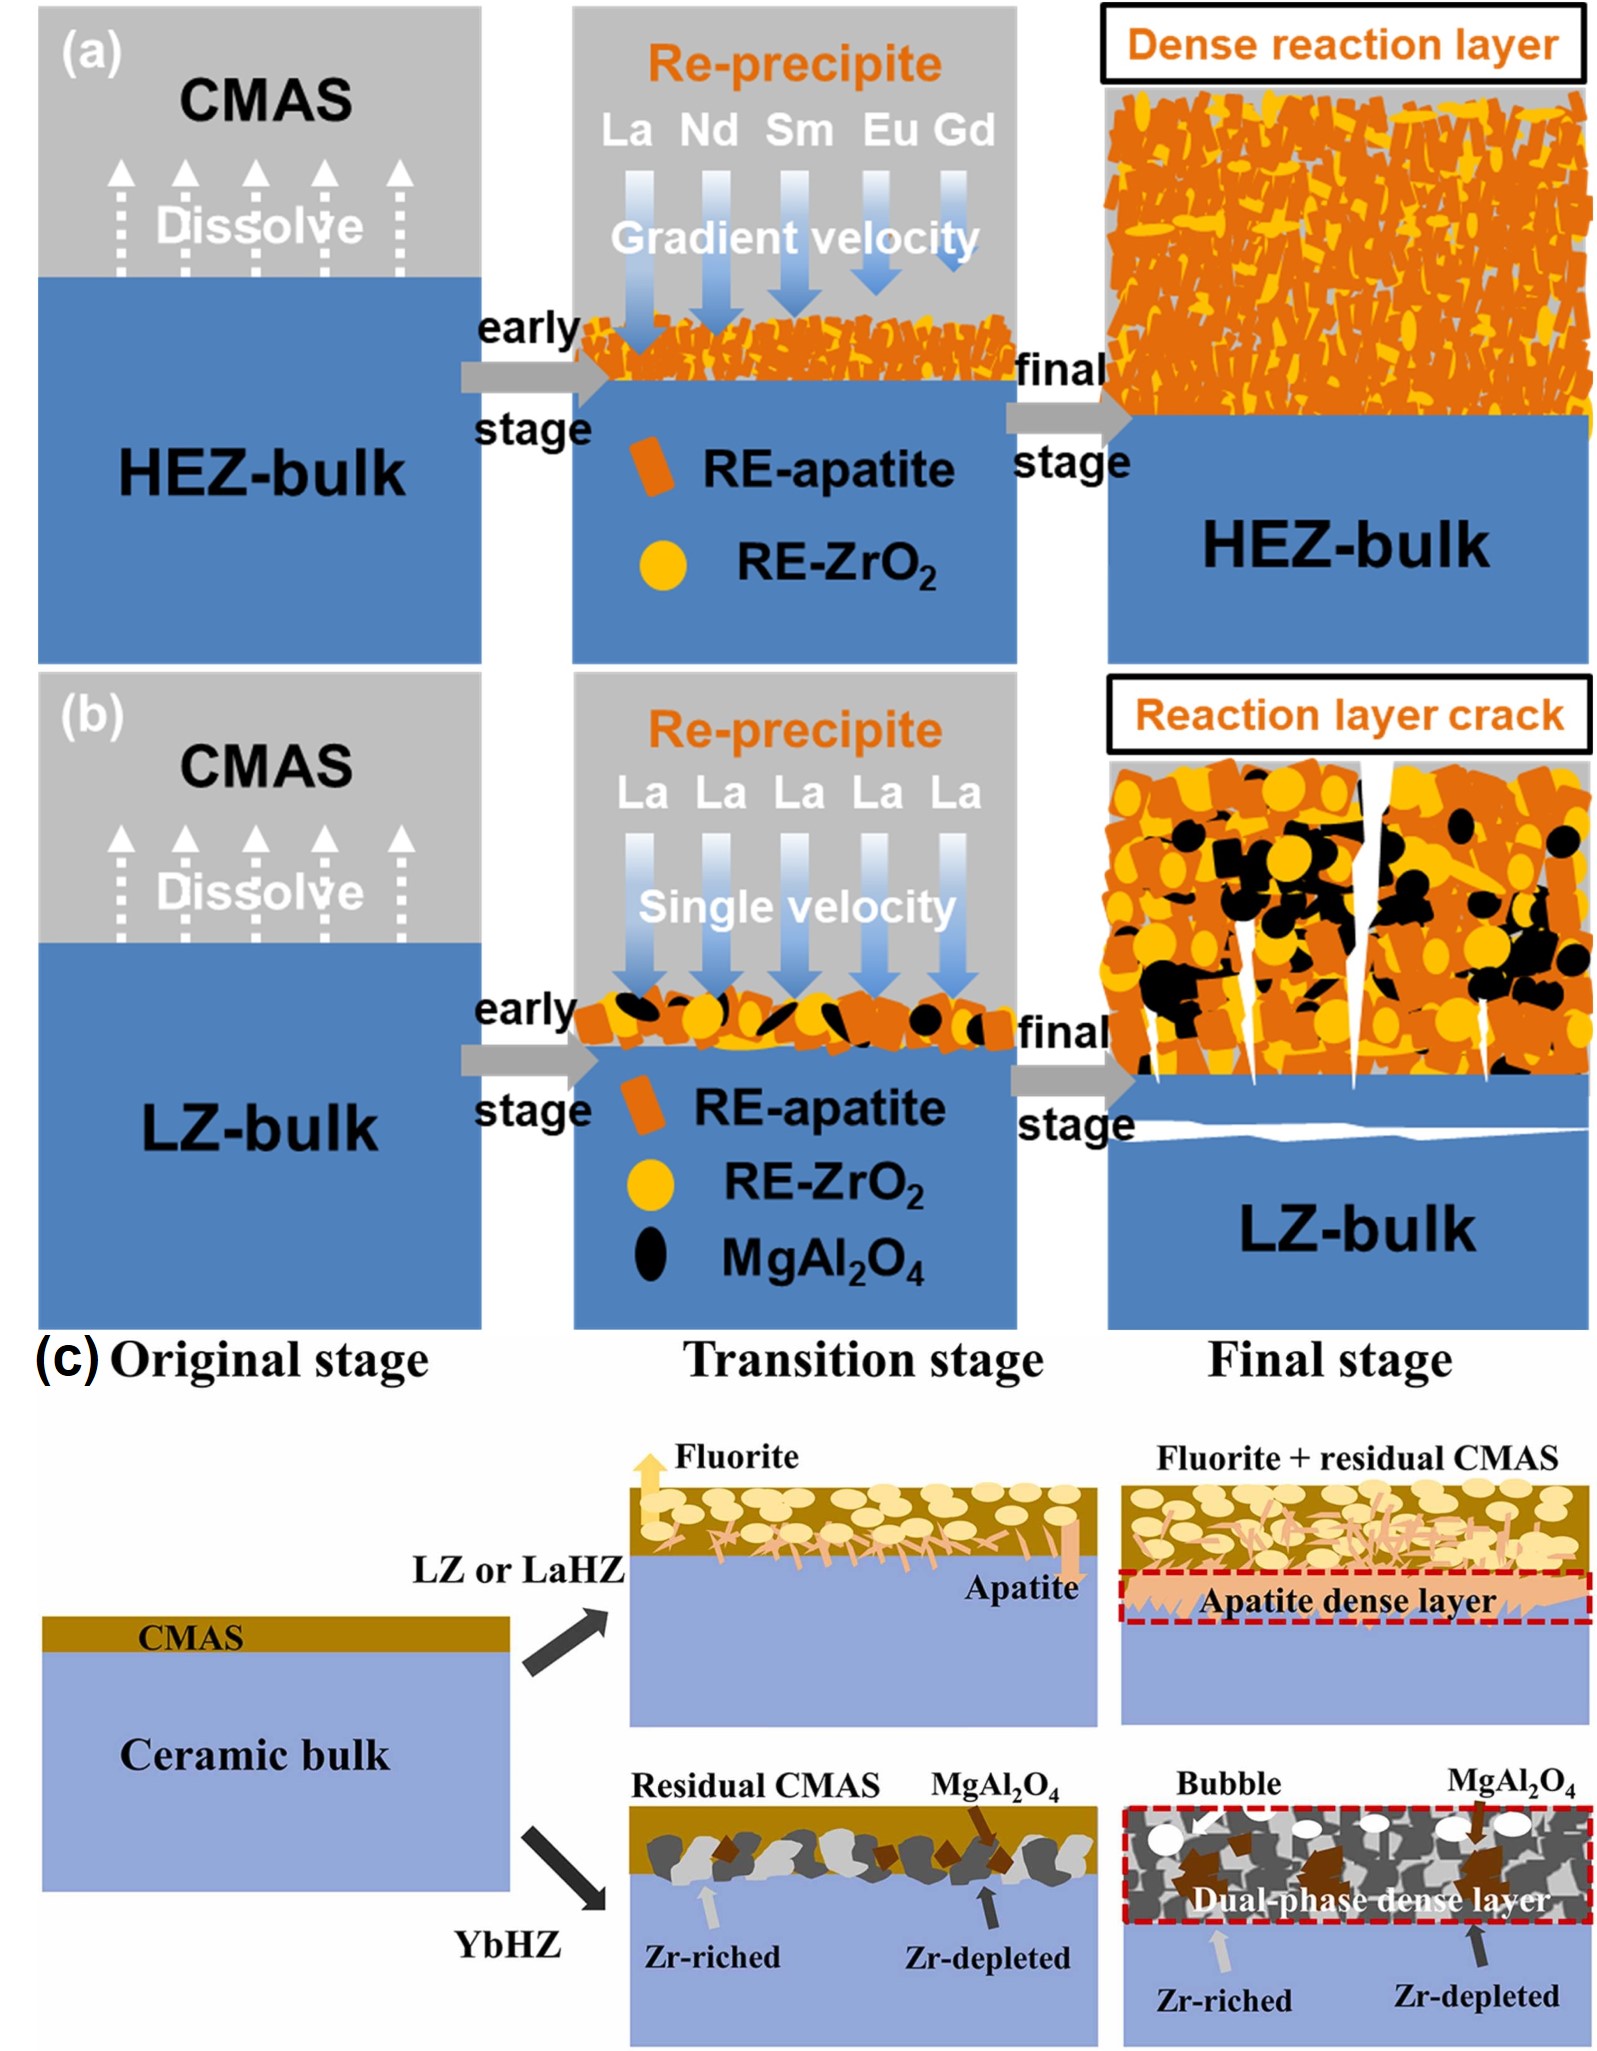
Fig. 46
CMAS-induced corrosion in HEZ and LZ ceramics. (a) HEZ: Dense RE-apatite and RE-ZrO
2
layer without cracks, exhibiting graceful degradation. (b) LZ: Formation of RE-apatite, RE-ZrO
2
, and MgAl
2
O
4
layer with cracks, indicating reduced CMAS resistance. Reproduced with permission from Ref. [
142
], © Elsevier 2022. (c) Corrosion progression of ceramic materials under CMAS exposure. Initial contact with CMAS initiates corrosion. Transition: LZ and LaHZ exhibit fluorite and apatite formation with residual CMAS and MgAl
2
O
4
. YbHZ shows the Zr-rich layer and Zr-depleted regions. Final: LZ and LaHZ develop a dense apatite layer with fluorite and CMAS residues. YbHZ forms a dual-phase layer of fluorite and pyrochlore, with enhanced CMAS resistance and no CMAS residue. Reproduced with permission from Ref. [
143
], © Elsevier 2024.