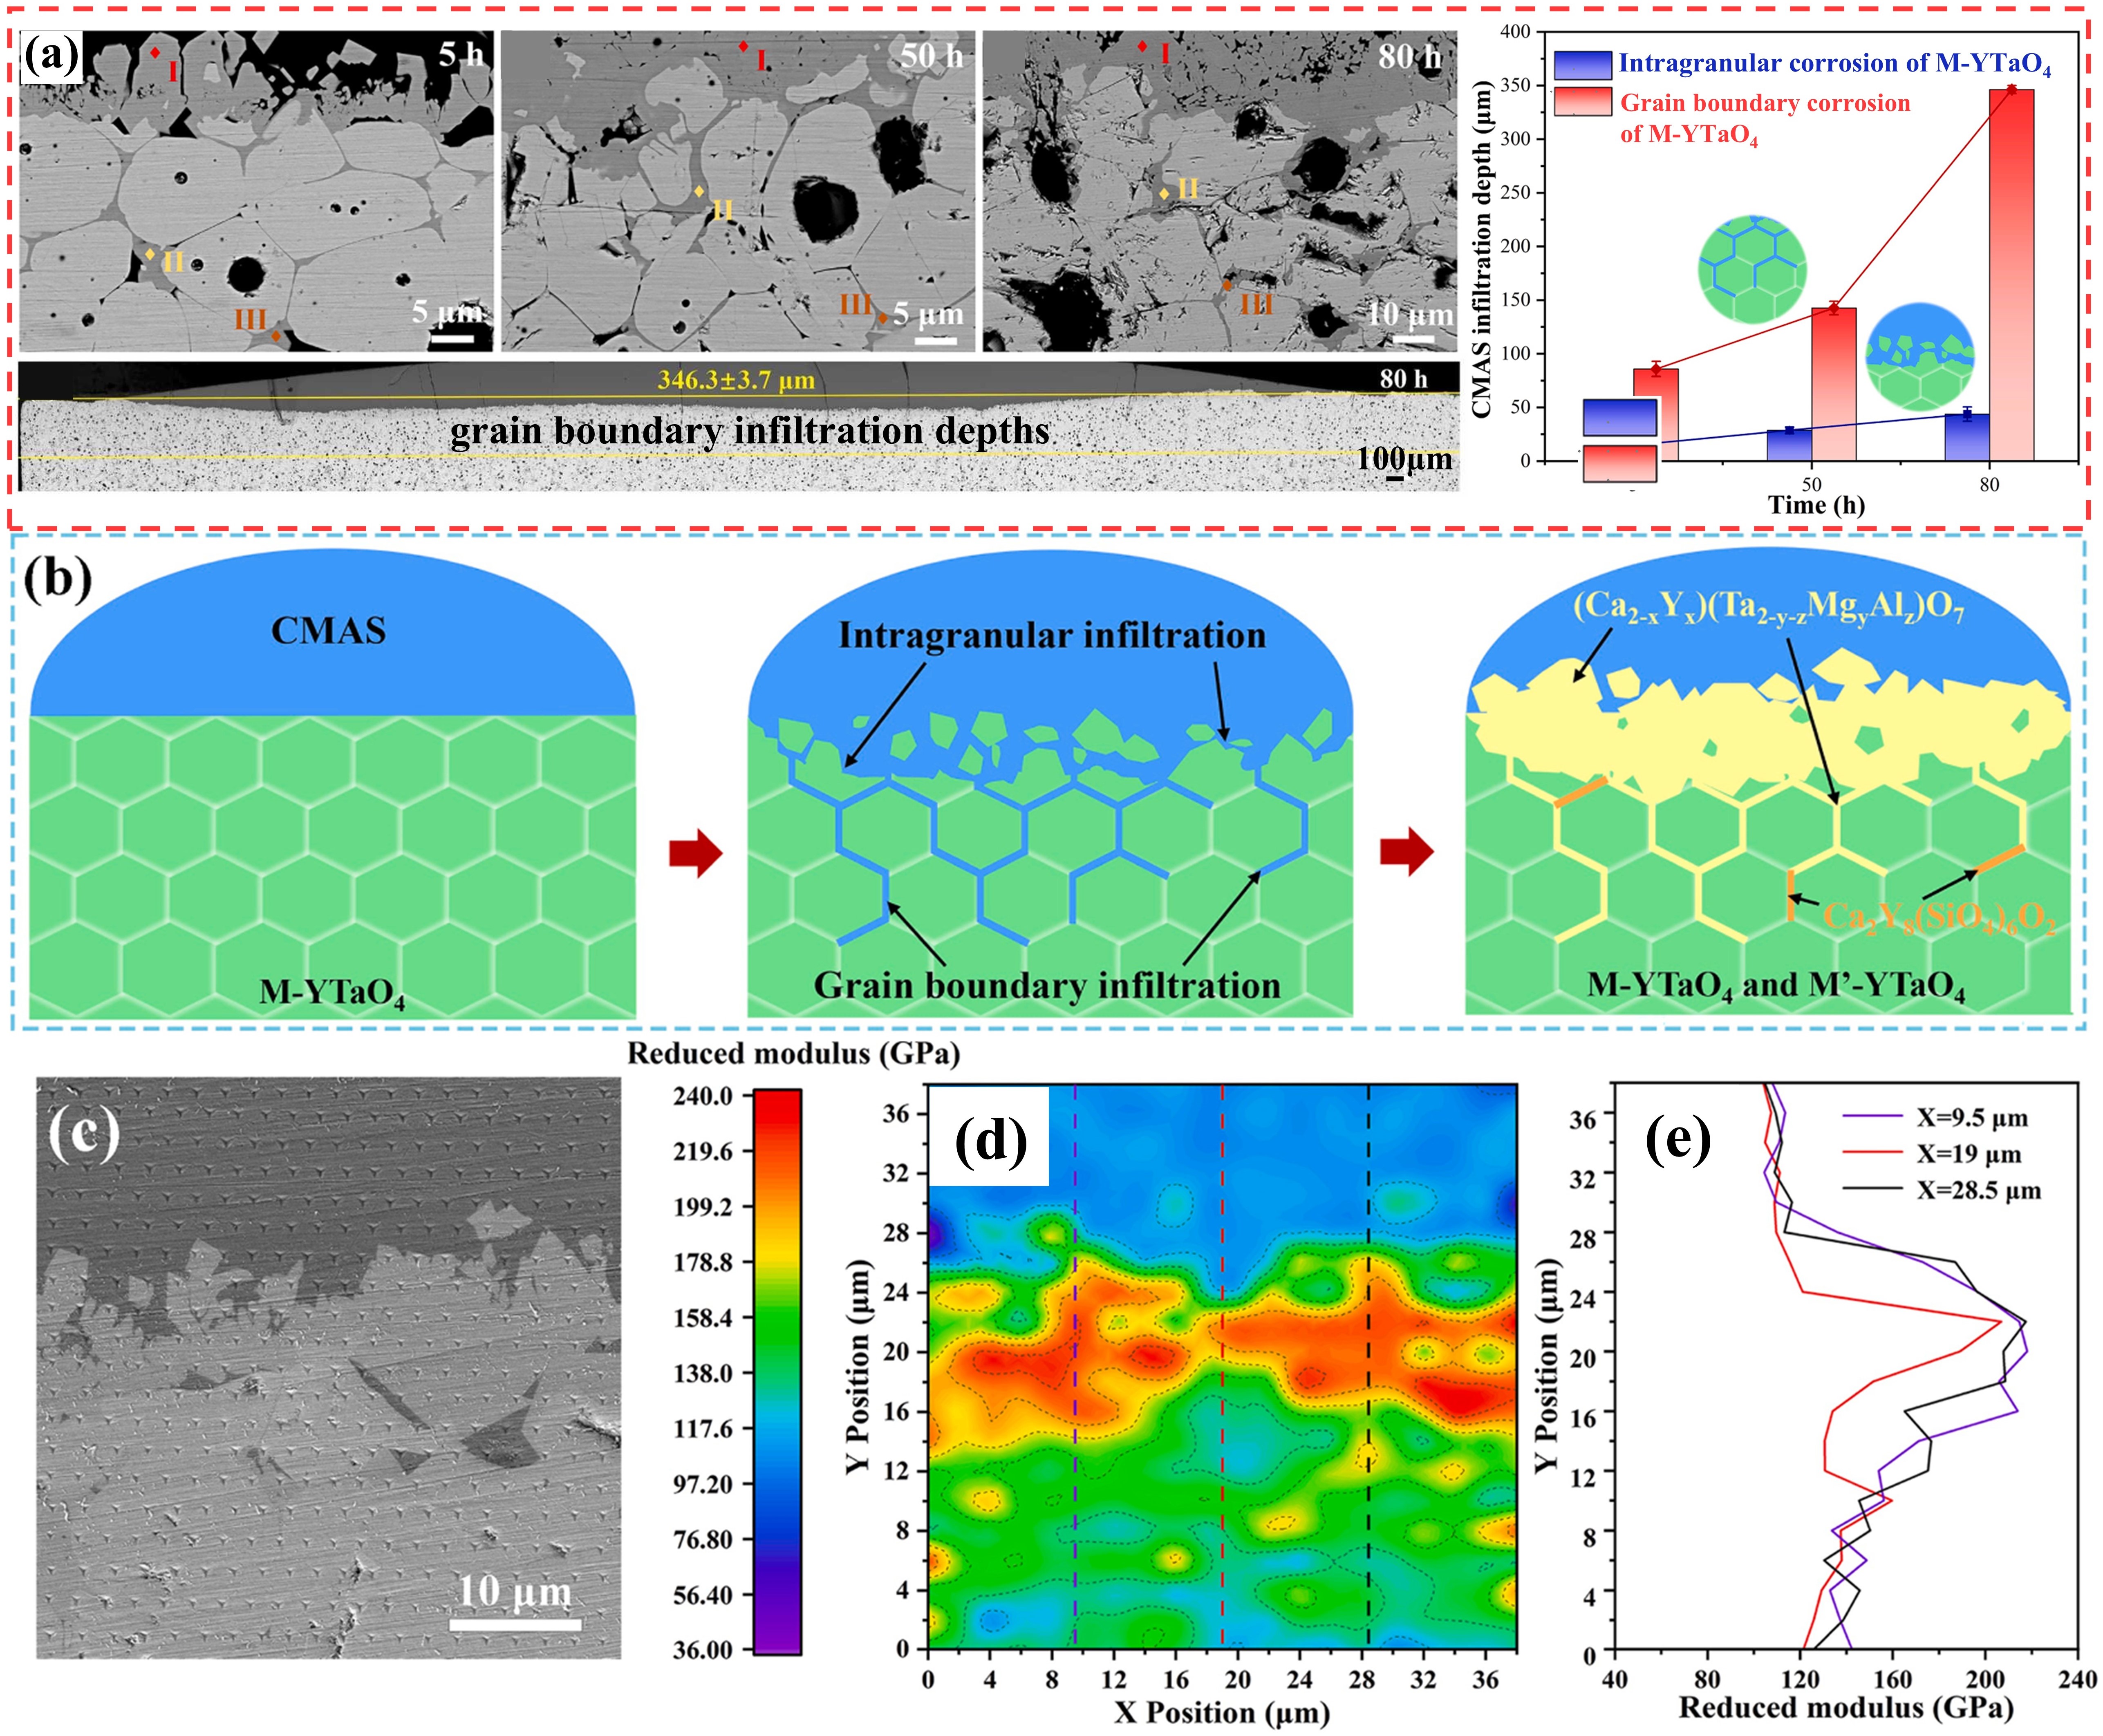
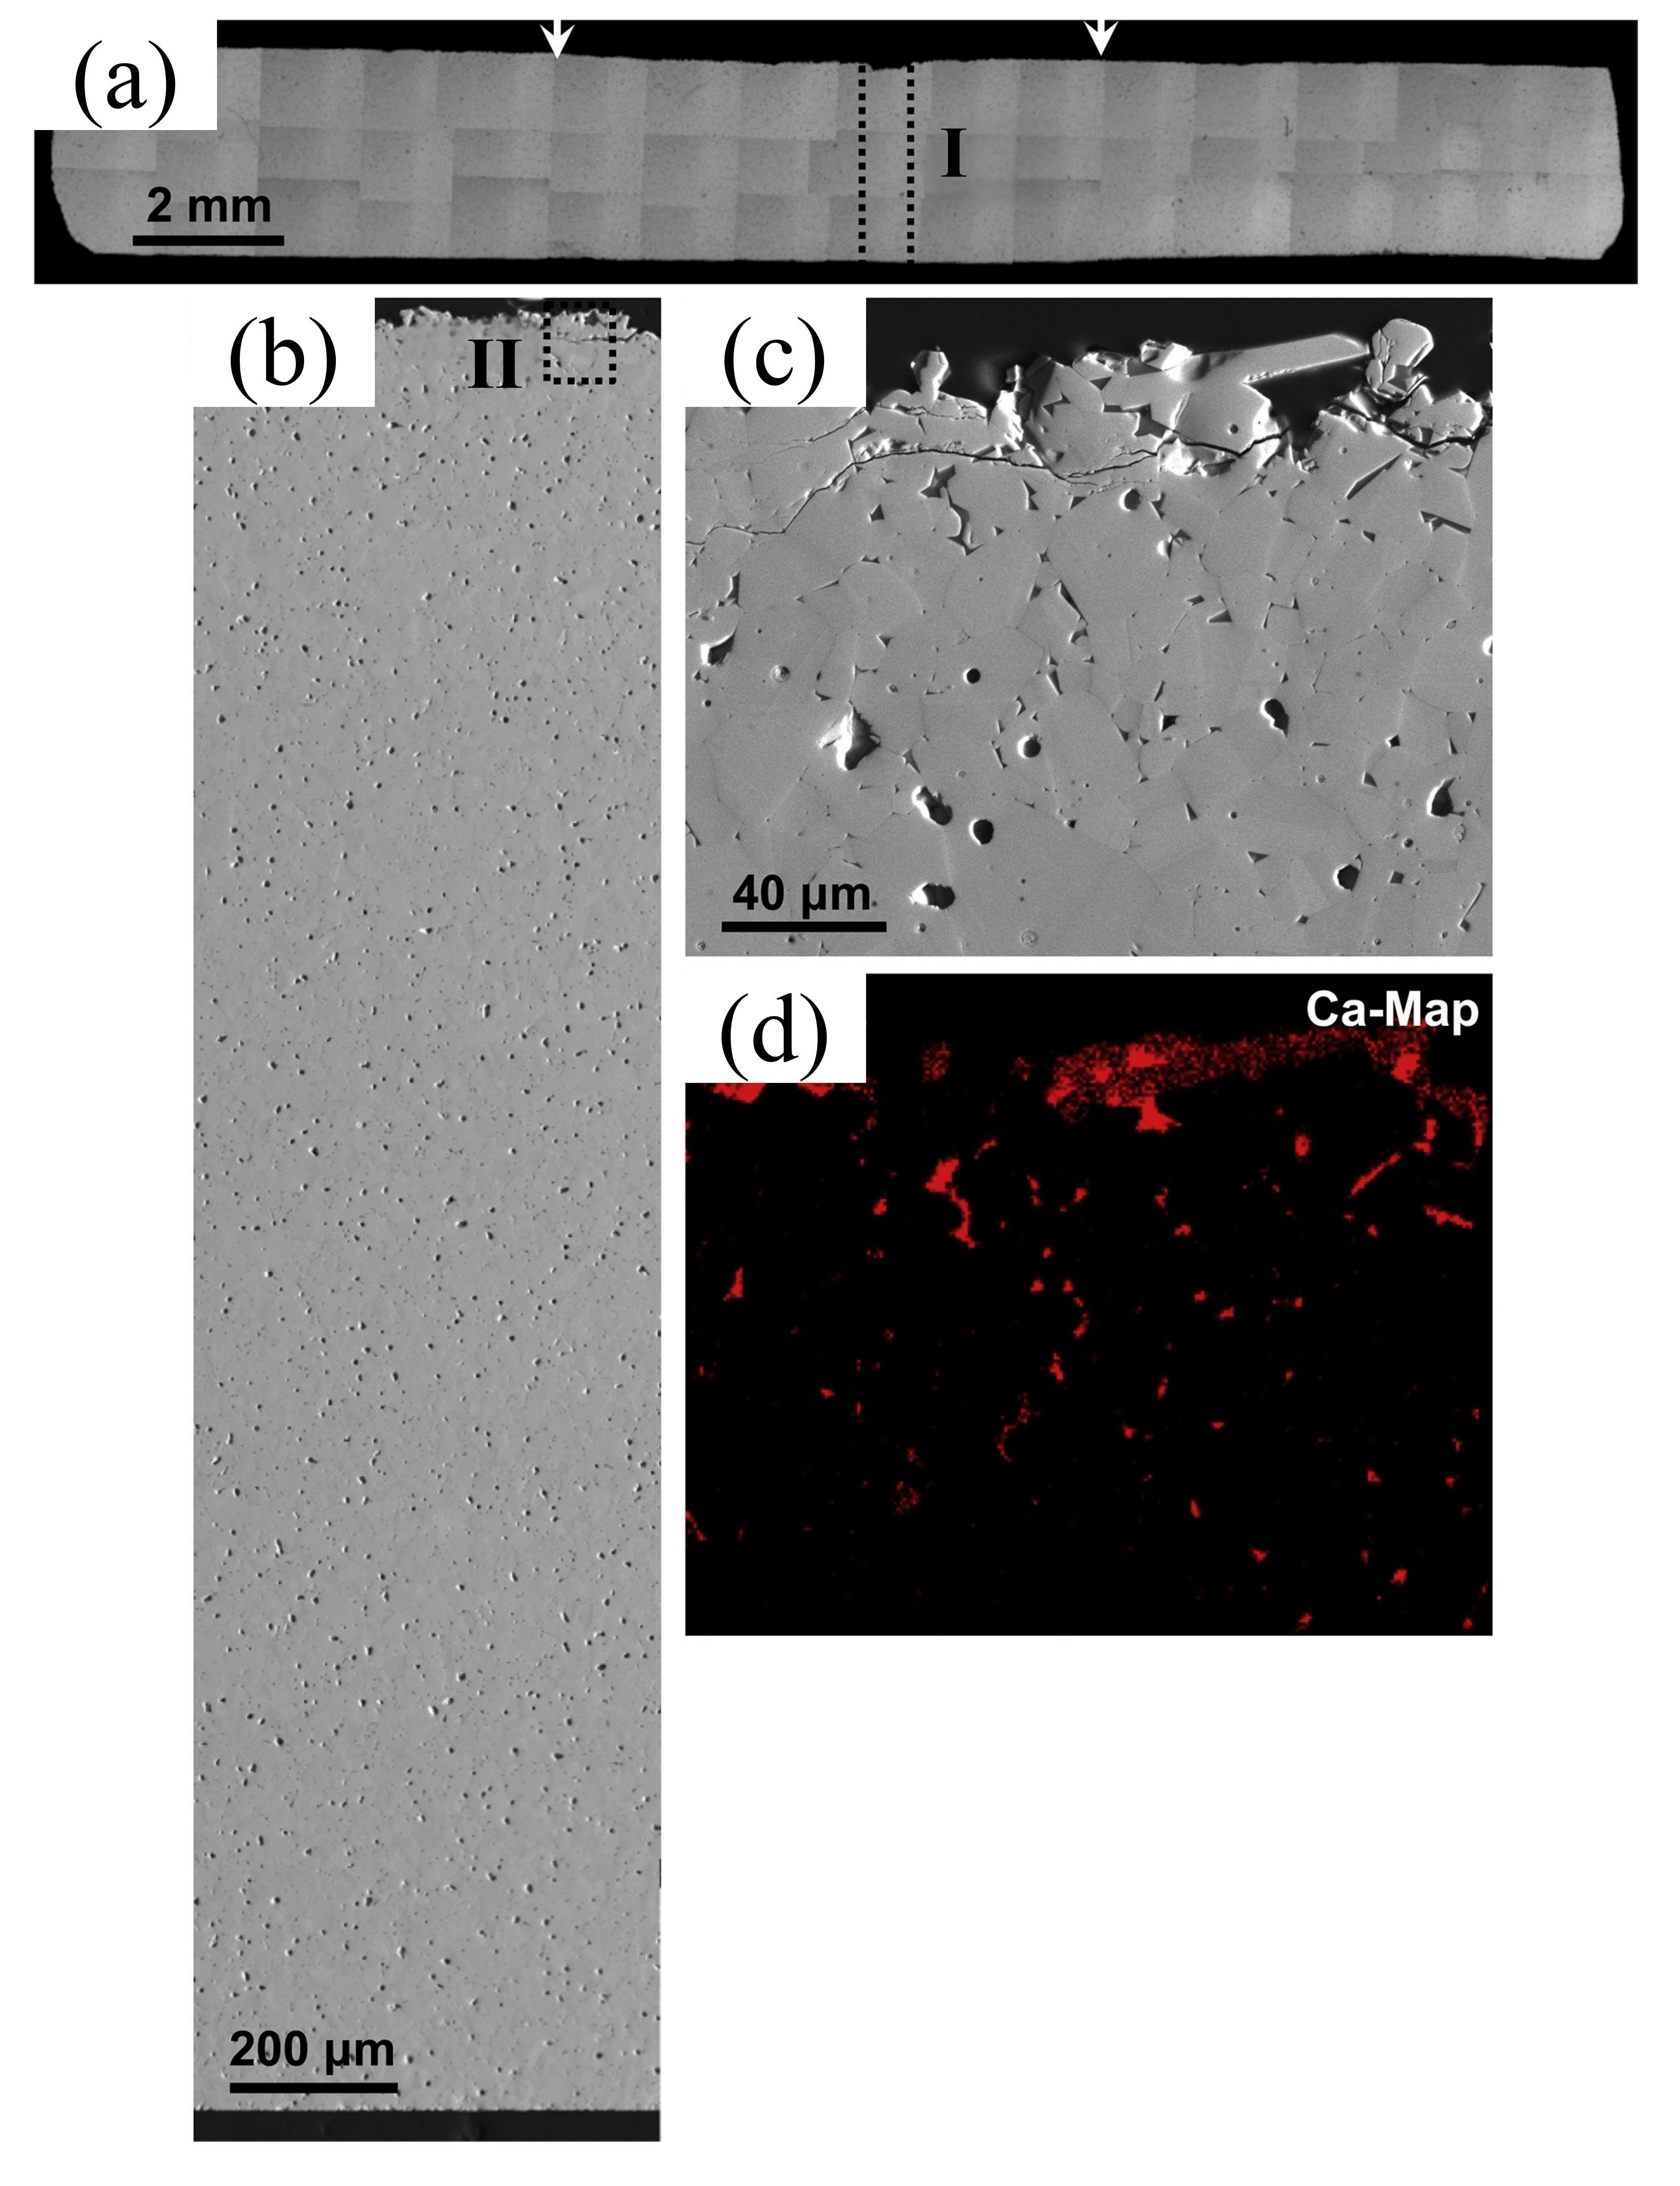
Fig. 23. Corrosion mechanism of M-YTaO4: (a) images of cross-sections and grain boundary infiltration depths of M-YTaO4 after CMAS corrosion, (b) schematic diagram of CMAS corrosion of M-YTaO4, (c) the interface between residual CMAS melt and M-YTaO4 substrate after CMAS corrosion at 1300 ℃ for 5 h, (d) Mapping and (e) section lines of reduced moduli corresponding to (c). Reproduced with permission from Ref. [83], © Elsevier 2024.
Other figure/table from this article