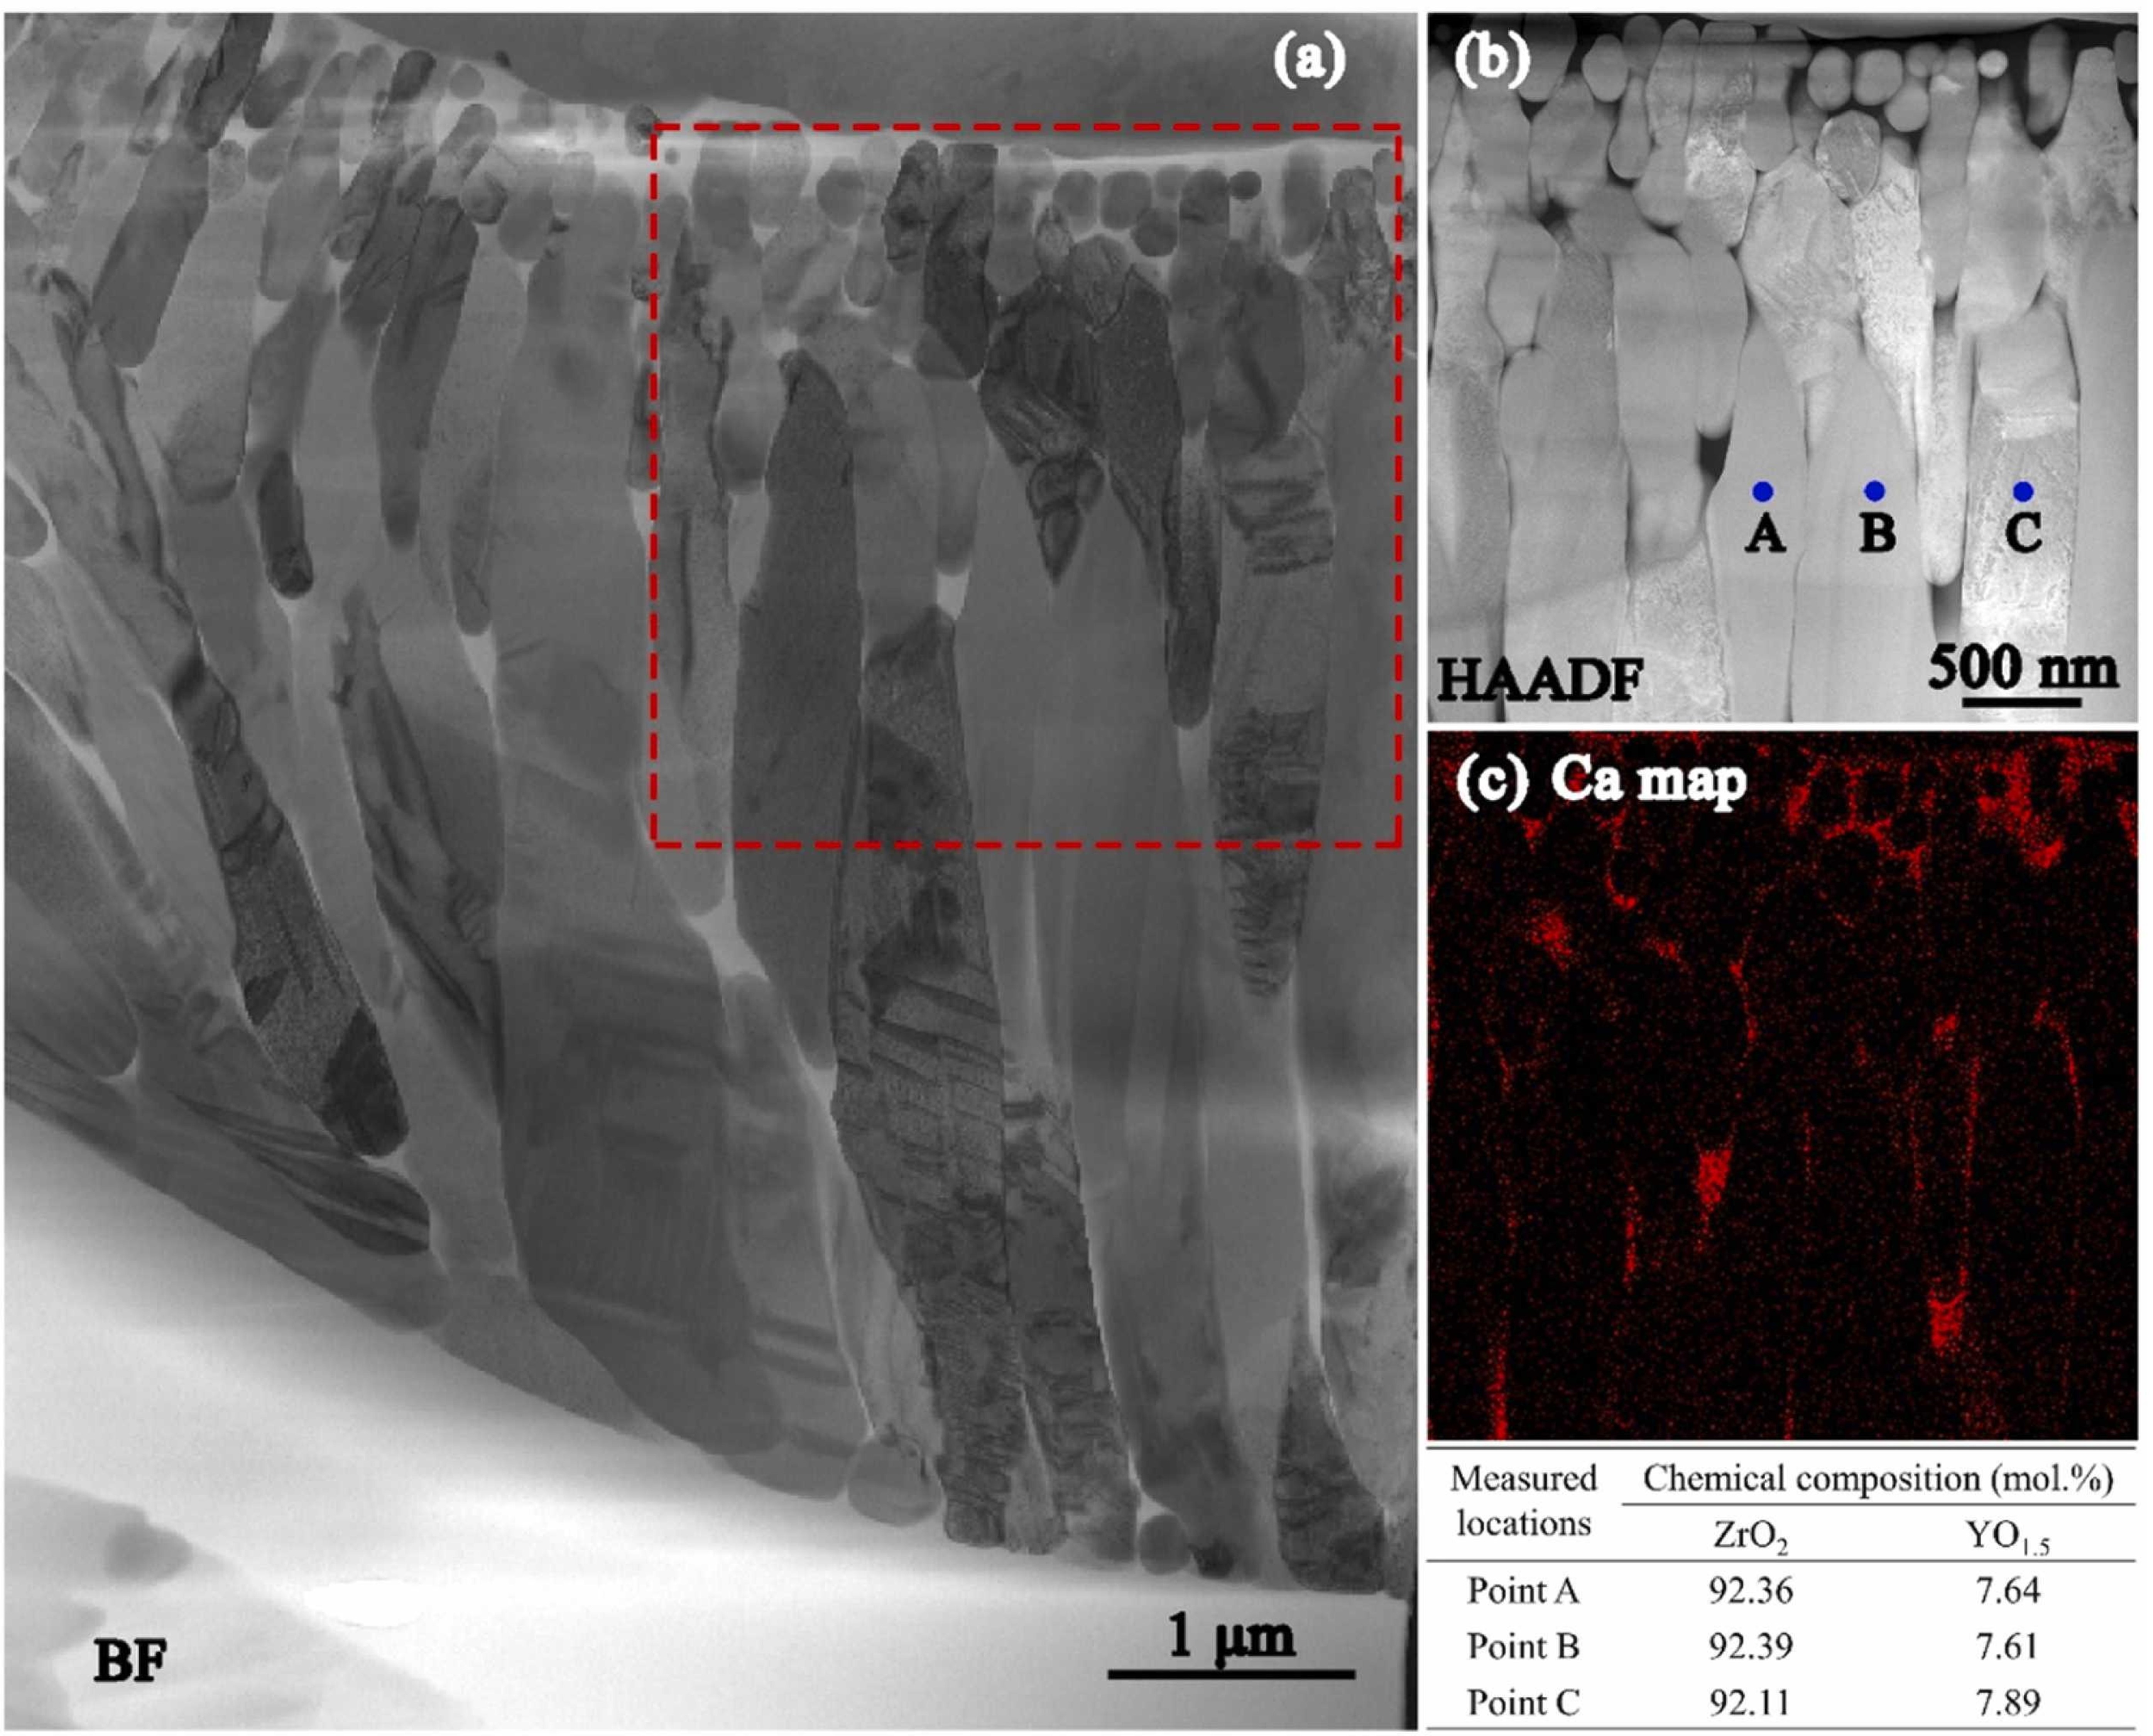
Fig 16. (a) Bright-field TEM image of CMAS infiltration front at 1250 ℃ for 2 h in 8YSZ TBC, (b-c) HAADF image, and the corresponding Ca mapping of the dashed rectangle area in (a). The table at the bottom right lists the chemical compositions of points A, B, and C in (b). Reproduced with permission from Ref. [60], © Elsvier 2022.
Other figure/table from this article