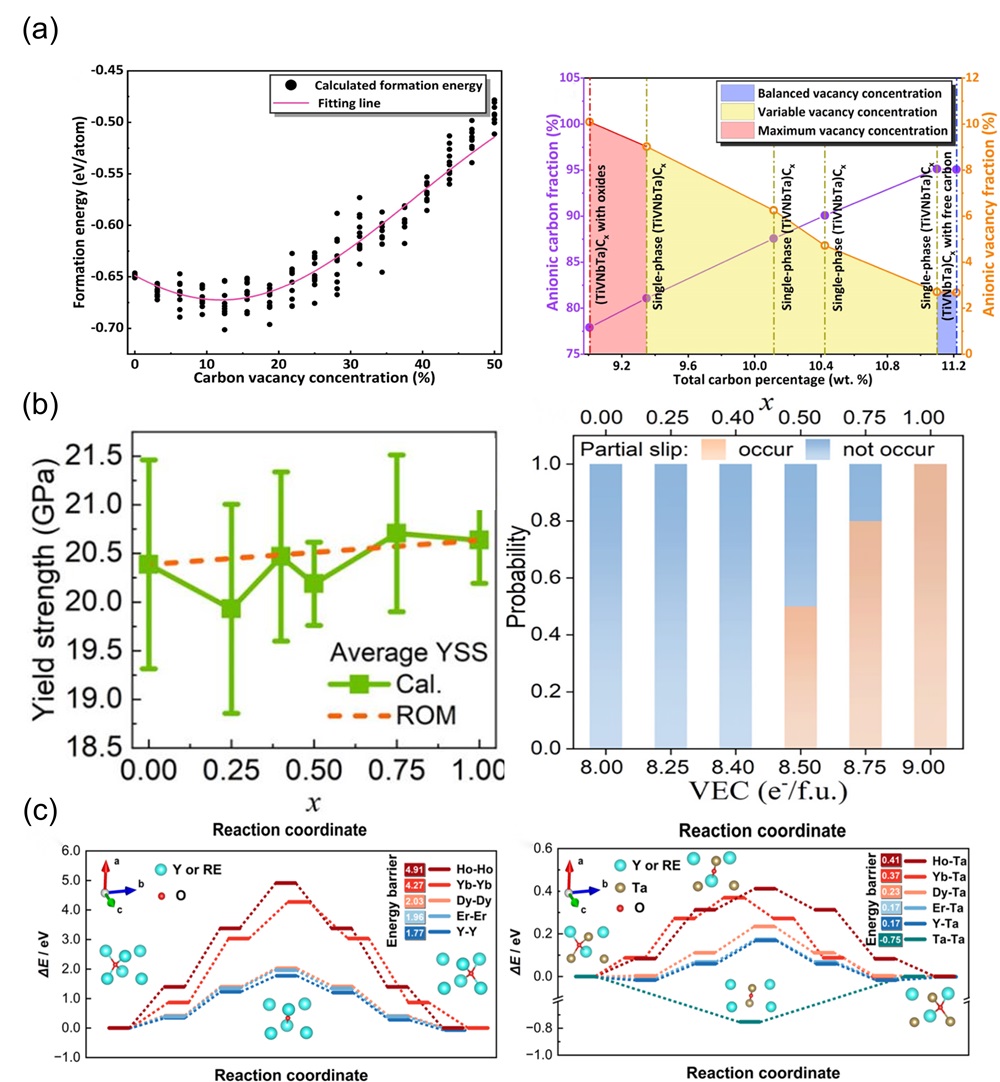
Fig. 4. (a) The fitting formation energy curve of (TiVNbTa)Cx with variation of anionic vacancy concentration; Curves of anionic carbon and vacancy fraction under changing carbon content [86]. (b) Average YSSs and ROM (rule of mixture) predictions for (HfTiZr)1-x (NbTa)xC (left); for each x/VEC (valence electron concentration) value, whether partial slip occurs when shearing along the [1 0](111) direction in five supercells with different atomic distributions (right) [89]. (c) Diffusion energy barriers for oxygen ions on the RE-RE edge (left) and on the RE-Ta and Ta-Ta edges (right), respectively, in RE3TaO7 [91].
Other figure/table from this article