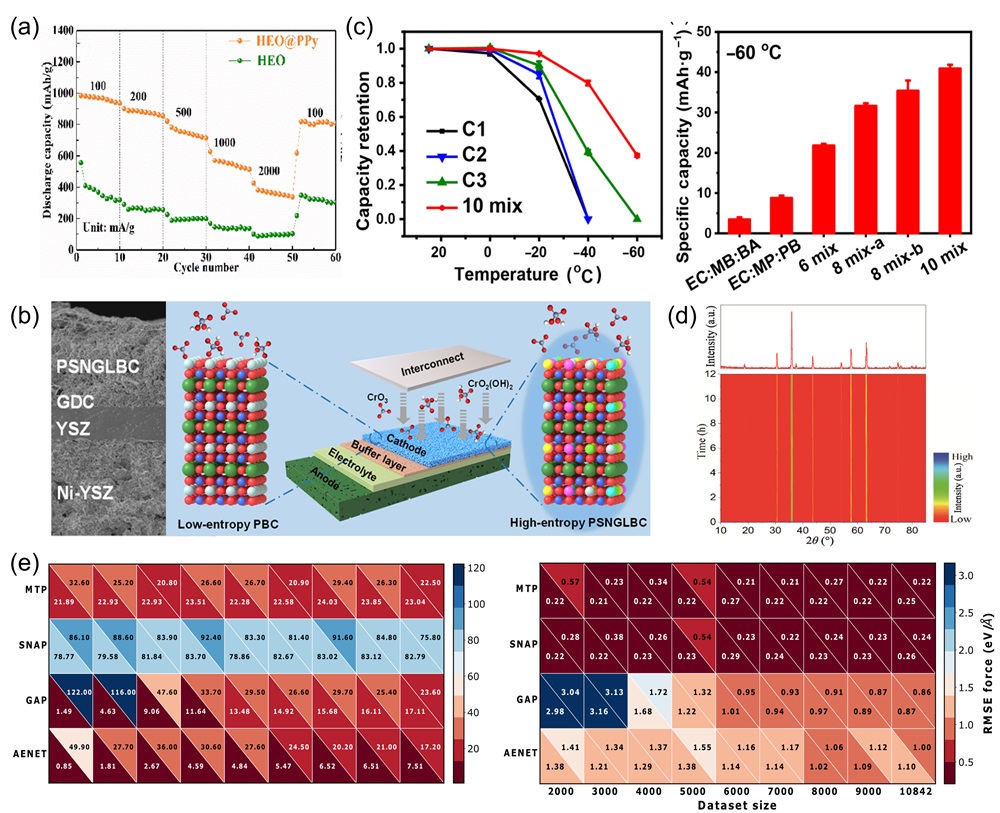
Fig. 14. (a) The rate discharge performance of HEO and HEO@PPy at various current densities; the rate performance of HEO@PPy significantly outperforms that of HEO [224]. (b) Schematic and SEM cross-section of a single cell with (PrSmNdGdLa)BaCo2O5+δ cathode [206]. (c) Capacity retention of batteries utilizing commercial and decimal solvent-based electrolytes; comparison of capacity retention at -60°C for batteries with electrolytes comprising different solvent combinations [225]. (d) In situ XRD measurements of (FeMnCoNiCr)3O4 powder at 600℃ under a CO2-containing atmosphere as a function of time (e) The MLIP energy (left panel) and force (right panel) of minimizing the root mean squared errors (RMSE). The lower-left and upper-right triangles within each square correspond to the training and test errors, respectively [226]. [33].
Other figure/table from this article