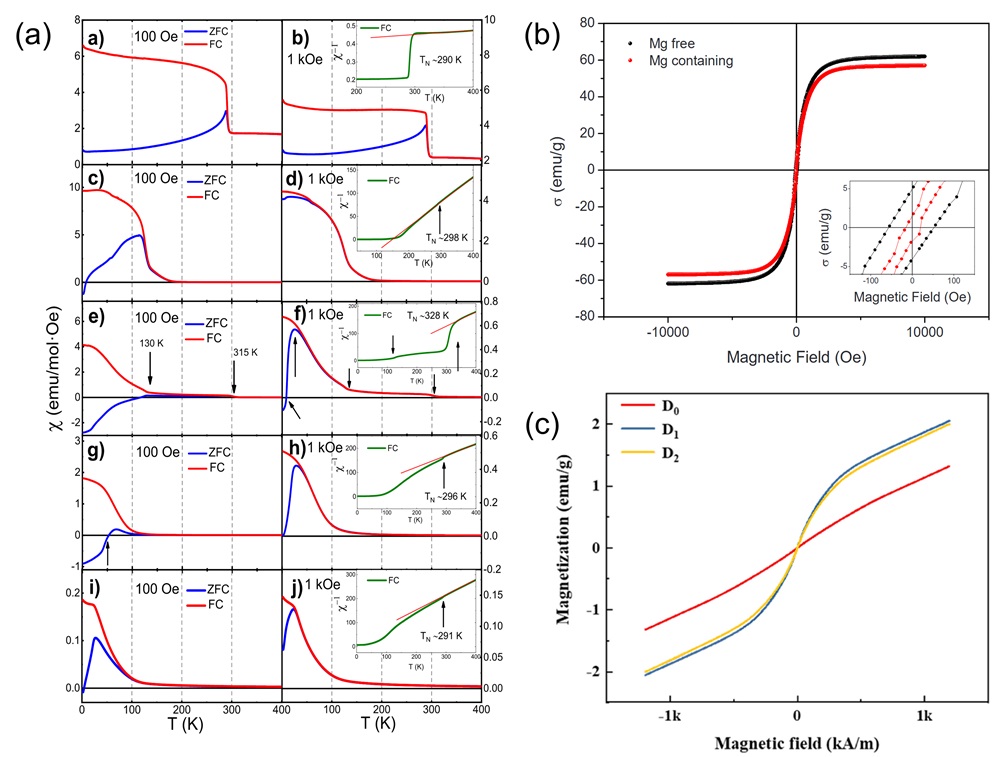
Fig. 16. (a) Magnetic induction strength versus temperature for (a-b) LC, (c-d) LCM, (e-f) LCMF, (g-h) LCMFA, and (i-j) LCMFAG ceramics in ZFC (Zero Field Cooling) and FC (Field Cooling) modes at 100 Oe and 1000 Oe, inset show the χ-1 vs T and the straight line represents the C-W fitting [34]. (b) Hysteresis loops of the prepared HEOs at 300 K. The inset shows the low-field region of the hysteresis loops [122]. (c) Magnetization versus magnetic field curves for the samples at 25°C [131].
Other figure/table from this article