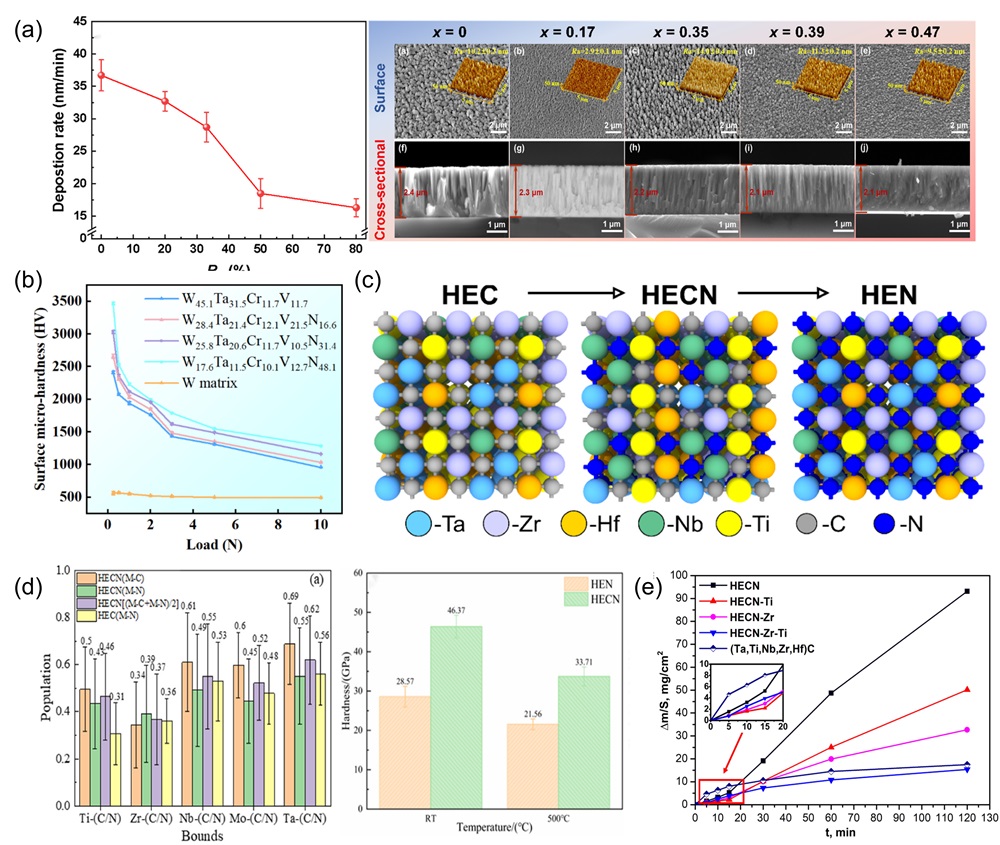
Fig. 10. (a) SEM images of surface and cross-sectional morphology of (MoNbTaTiZr)1-xNx coatings under different x; Deposition rates of (MoNbTaTiZr)1-xNx coatings with different RN [177]. (b) Surface micro-hardness of W-Ta-Cr-V-N coatings [176]. (c) Crystal Structures of HEC, HECN, and HEN [174]. (d) Bond populations and density of states for HEN and HECN coatings; Crystal Structures of HEC, HECN, and HEN [179]. (e) The increase in mass per unit area as a function of oxidation time reflects the variation of the surface mass of the sample with time at different oxidation durations [54].
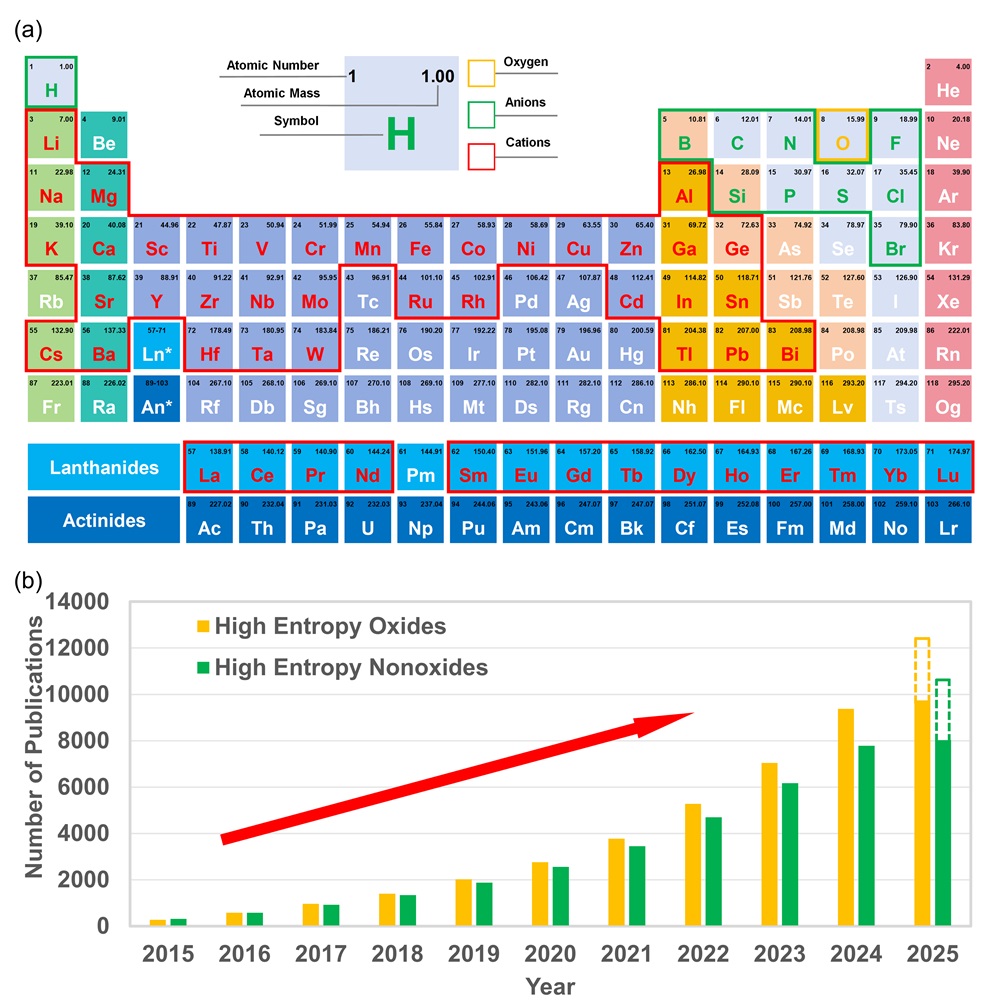
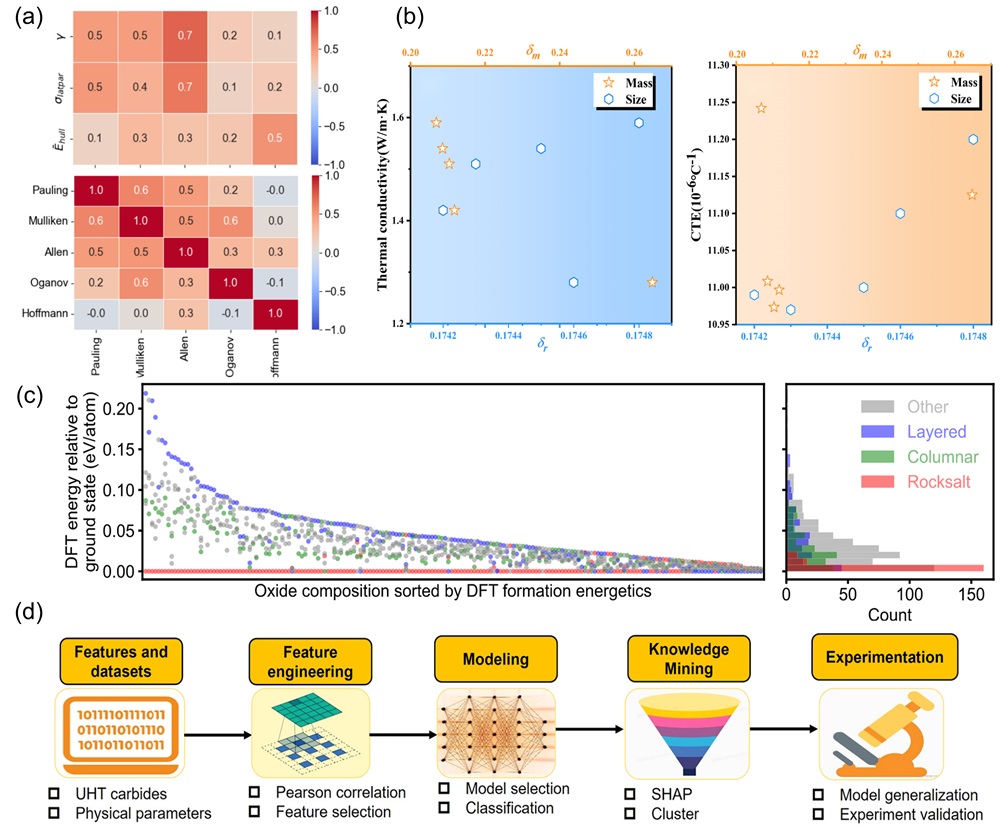
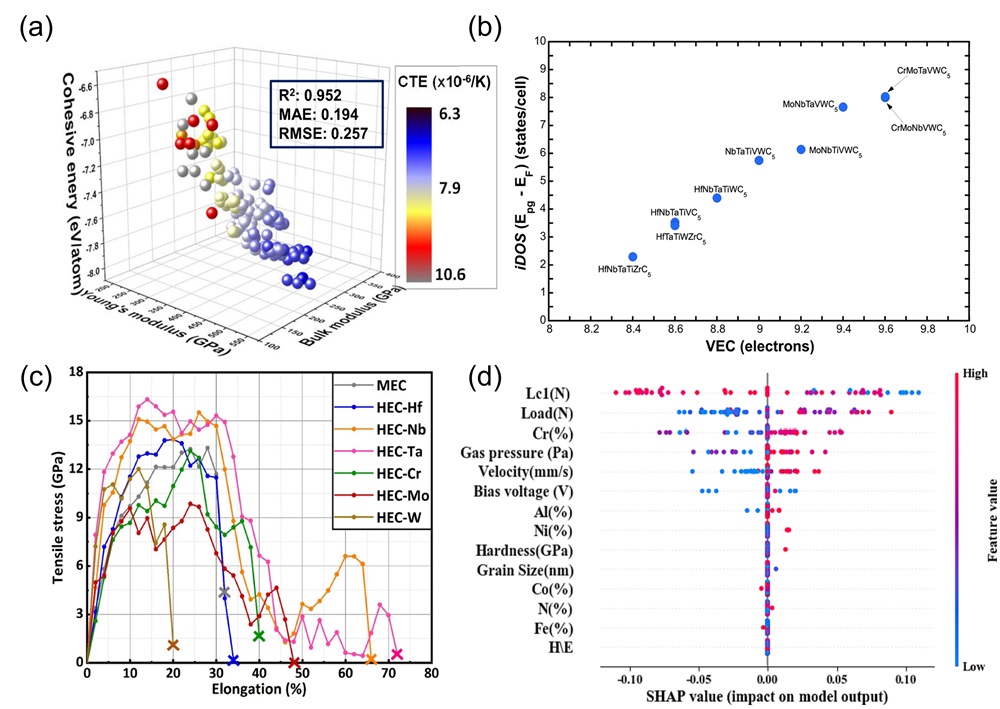
Other figure/table from this article